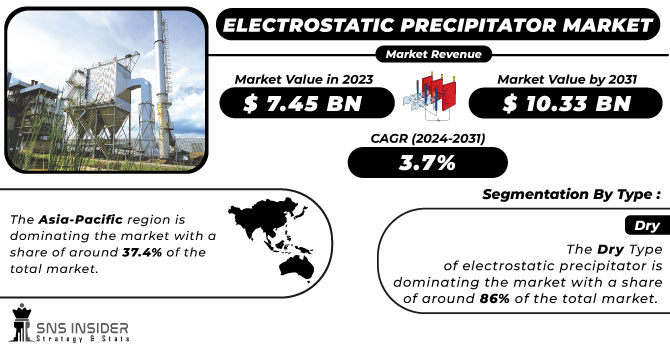
The Electrostatic Precipitator Market Size was estimated at USD 7.56 billion in 2023 and is expected to arrive at USD 11.52 billion by 2032 with a growing CAGR of 4.79% over the forecast period 2024-2032. This report offers a unique perspective on the Electrostatic Precipitator Market by analyzing installed base & capacity trends across key regions and utilization rates by industry, highlighting shifts in demand. It provides exclusive insights into maintenance & downtime metrics, helping industries optimize operational efficiency. The study examines technological adoption rates regionally, showcasing advancements like IoT-enabled ESPs and AI-driven monitoring systems. Additionally, export/import data offers a global trade outlook, revealing supply chain trends and regulatory impacts. Emerging trends, such as hybrid ESP systems and increasing adoption in biomass power plants, further differentiate this report.
Get More Information on Electrostatic Precipitator Market - Request Sample Report
Drivers
Stringent environmental regulations worldwide are driving demand for electrostatic precipitators as industries seek compliance with strict emission control standards.
Stringent environmental regulations are a key driver of the Electrostatic Precipitator Market, as governments globally enforce strict emission control measures to combat air pollution. The growing need for electrostatic precipitators to meet stringent standards aimed to limit particulate matter emissions in industries including power generation, cement, and steel manufacturing. Advanced air filtration technologies are mandated by regulatory frameworks such as the U.S. Clean Air Act, EU Industrial Emissions Directive, and India’s National Clean Air Program (NCAP). The growing environmental concerns and preference for smart, high-efficiency IoT-integrated electrostatic precipitators for real-time monitoring have been propelling the growth of the market. A shift towards wet electrostatic precipitators (WESP), which are better at removing fine particles, has been observed. Moreover, the upgrading and retrofitting of existing facilities as well as increasing investments in emission control across emerging economies, particularly in China and India, are also fuelling the evolution of the market while meeting the rising global air quality standards.
Restraint
The high initial investment and maintenance costs of electrostatic precipitators make them less accessible for small and medium-sized enterprises, limiting their adoption.
The adoption of electrostatic precipitators (ESPs) is often hindered by high initial investment and maintenance costs, making it challenging for small and medium-sized enterprises (SMEs) to implement this technology. New ESP installation involves a high CAPEX investment due to intricate equipment, engineering, and integration into existing plant infrastructure. Moreover, this creates a financial strain with the ongoing expenditures associated with upkeep, component replacement, and energy usage. For SMEs with limited financial resources to work with, such high costs are pushing them towards alternative air filtration technologies such as baghouse filters, which are nevertheless at lower efficiency levels than other competing technologies in some applications. Furthermore, ESPs must be manned by competent professionals to keep them performing properly, thereby increasing total operational costs. These economic constraints discourage industries that have variable revenues, like cement or metal processing, from investing in ESPs. This raises the need for cost-effective solutions and more government incentives to make ESP technology more widely available.
Opportunities
Retrofitting and upgrading electrostatic precipitators enhance efficiency, reduce emissions, and ensure compliance with stringent environmental regulations at a lower cost than new installations.
Retrofitting and upgrading existing electrostatic precipitator (ESP) systems have become essential as industries strive to meet increasingly stringent environmental regulations. Until then, because many older ESPs do not efficiently remove fine particulate matter, industries will invest in modernizing ESPs rather than replacing them entirely. Additionally, advances in high-frequency power supplies, hybrid filtration systems, and advanced control mechanisms serve to improve ESP performance, optimizing collection efficiency as well as lower emissions. Retrofitting enables industries to prolong the lifespan of existing machinery and lower the cost of compliance than at lower air quality standards than new setups. Such investment in ESP advancements is chiefly being adopted by the power generation, cement, steel, and chemical sectors for sustainable operation. Embracing automation and IoT-enabled monitoring also drive ESP performance for improved energy efficiency and lower maintenance costs. Retrofitting and upgrading ESPs, therefore, offer a cost- and time-effective means to abate pollution at the source, as nations across the world continue to place pressure on governments to reduce industrial emissions and strive for the cleaner, more sustainable processes of the future.
Challenges
Different industries require customized electrostatic precipitators to meet specific emission control needs, increasing design complexity and manufacturing costs.
Electrostatic precipitators (ESPs) must meet stringent industry-specific performance standards, which vary across sectors such as power generation, cement, steel, and chemicals. Different industries require different techniques to control emissions based on the pollutants they produce, operating temperatures, and gas compositions. For instance, coal-fired power plants demand high-efficiency ESPs to collect fine particulate matters, while cement industries produce high-temperature dusty gas that needs to be treated with heat resistant designs. Customization of ESP design (e.g., electrode configuration, plate spacing, and collection efficiency) makes the manufacturing process more complex and costly. Moreover, heavily regulated industries like pharmaceuticals and food processing use specialized ESPs to eliminate ultra-fine impurities while keeping their hardware hygienic. Fulfilling such a varied set of requirements requires constant evolution of technology, new material development and compliance with regulations; a real challenge for manufacturers. Because each ESP must have specific features that address the urgent needs of the different industries, the need for industry-specific ESP solutions leads to increased time-to-market, reduced scalability, and significant R&D effort, making industry-specific customization a key challenge for the ESP market.
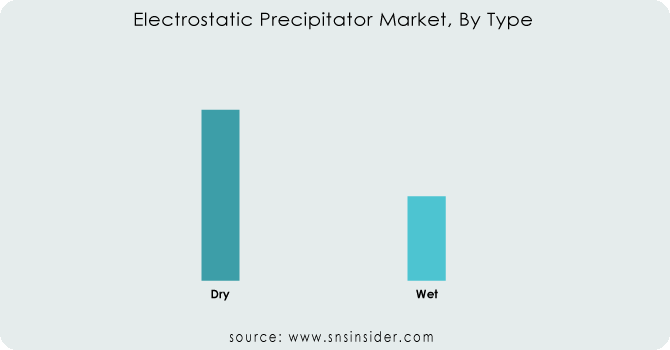
By Type
The Dry Electrostatic Precipitator (ESP) segment dominated with a market share of over 68% in 2023, due to its extensive use in industries such as power generation, cement, chemicals, and steel. Many industries need to remove particulates effectively to meet strict environmental standards. λDry ESPs effectively collect and eliminate fine dust, smoke, and other particulate matters from flue gases before they are released into the environment. Highlighted by the fact that they require very little maintenance while managing large volumes of gas, they are favored for industrial usage. Dry ESPs do not rely on site-supplied water the same way wet ESPs do, as the main essential, which addresses not only operational costs but also the challenge of wastewater issues. They also boast of long service life, high efficiency, and their adaptability to various industrial processes, which is important for steel and cement industries, adding to the dominance of global electrostatic precipitator market.
By Component
The Hardware segment dominated with a market share of over 52% in 2023, due to its essential role in air filtration systems. The discharge electrodes, collecting plates, hoppers, and power supply are key components of electrostatic precipitators. Rising industrial air pollution control in power plants, cement production, metal processing industry is also anticipated to fuel the segment growth. Furthermore, improvements in electrode design and high-voltage power supplies increase the electrostatic precipitators’ efficacy and longevity, which helps maintain the dominant hardware segment. In the current industrial milieu, redirecting towards strict emission laws, demand for hardware components functions as a bedrock for the component segment, maintaining its integrity to the market owing to their rigorous usage.
By End-User
The Power Industry segment dominated with a market share of over 34% in 2023, due to its significant role in controlling air pollution, particularly in coal-fired power plants. Owing to its substantial contribution to air pollution control across several industries, including coal-fired power plants. They are major emitters of particulates, which are known to impact air quality and degrade the environment. Strict global environmental regulations, for example, by the EPA and equivalent agencies, require effective emission controls like ESPs, to be installed to reduce particulate matter (PM) emissions. Electrostatic precipitators are extremely efficient particle capture devices, allowing widespread use in the power sector and compliance with these regulations. The power industry’s monopoly dependence on ESPs continues to be a central pillar of prevailing market domination as demand for cleaner energy and stricter environmental standards magnifies.
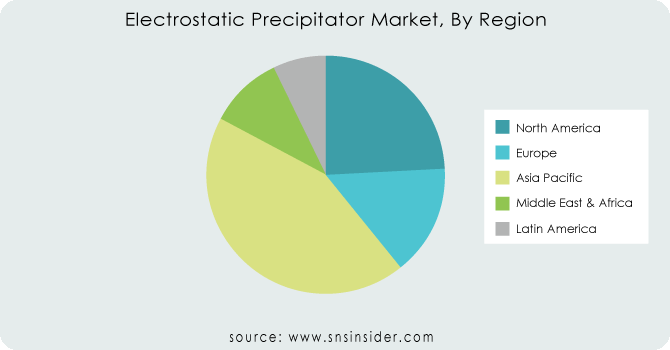
The Asia-Pacific region dominated with a market share of over 42% in 2023, owing to the large number of coal-fired power plants present in the region, especially in the countries such as China and India. These countries experience severe air pollution problems, as a result, they adopted strict environmental regulations to control emissions from industrial processes. Regulatory requirements for emission controls have become more stringent, enabling electrostatic precipitators to capture fine particulate matter with the highest efficiency. Additionally, the electricity demand has been propelled further due to rapid industrialization and insatiable energy appetite in Asia-Pacific, thereby fuelling the uptake of ESPs. However, as the region further develops and builds its industrialization, the demand for ESPs is expected to be strong, which, in turn, will maintain the position of the market leader in the global electrostatic precipitator market.
North America is the fastest-growing market for electrostatic precipitators (ESPs), primarily due to stringent environmental regulations and robust regulatory frameworks like the Clean Air Act in the United States. The most applicable are regulations limiting air pollution emissions, such as particulate matter, from power plants, cement plants, chemicals, and other industries. With growing environmental awareness and stricter emissions regulations set by governments, industries are incorporating high-end technologies such as ESPs to meet these requirements. If you tagged this as industrial activities reducing, and stopped technologies, this is because it gets of course much easier to have less environmental impact. As a result, demand for electrostatic precipitators in North America is increasing, and is projected to be the fastest-growing region in the global ESP market.
Some of the major key players in the Electrostatic Precipitator Market
Siemens AG (Germany) – (ESP Control Systems, High-Voltage Power Supplies)
General Electric (US) – (Dry & Wet Electrostatic Precipitators, Retrofit Solutions)
Mitsubishi Hitachi Power Systems (Japan) – (Dry ESP, Hybrid ESP, Air Pollution Control Systems)
Babcock & Wilcox (US) – (Fabric Filter ESP, Wet ESP, Particulate Control Systems)
AMEC Foster Wheeler (UK) – (ESP for Industrial Boilers, Flue Gas Treatment)
Thermax (India) – (Dry ESP, Industrial Air Pollution Control)
Ducon Technologies (US) – (Wet & Dry ESP, Multi-Stage Precipitators)
Fujian Longking (China) – (Industrial ESP, Flue Gas Cleaning Systems)
Hamon Group (Belgium) – (Wet ESP, Electrostatic Precipitator Retrofit)
Trion (US) – (Commercial & Industrial ESP, Kitchen Emission Control)
FLSmidth (Denmark) – (Air Pollution Control ESP, Power Plant ESP)
KC Cottrell (South Korea) – (Industrial ESP, Air Filtration Systems)
Elex AG (Switzerland) – (High-Efficiency ESP, Flue Gas Cleaning)
Feida Group (China) – (Large-Scale ESP, Coal-Fired Power Plant ESP)
McGill AirClean (US) – (Wet ESP, Particulate Matter Control)
Scheuch GmbH (Austria) – (Dry ESP, Hybrid ESP for Industrial Applications)
Envitech Inc. (US) – (Wet ESP, Acid Mist Control Systems)
Bionomic Industries (US) – (Multi-Stage ESP, Corrosion-Resistant ESP)
Southern Environmental, Inc. (US) – (High-Voltage ESP, Power Industry ESP)
Hitachi Plant Technologies (Japan) – (ESP for Heavy Industries, Air Quality Systems)
Suppliers for the Electrostatic Precipitator Market
ALPHAIR
Blowtech Engineers
Pinakin Technology Solutions
Dongguan Ruizhaohe Environmental Protection Equipment Co., Ltd. (DR. AIRE)
VT CORP Pvt. Ltd.
GEA Group
Babcock & Wilcox Enterprises, Inc.
FLSmidth & Co. A/S
Hamon Group
Thermax Limited
Recent Development
In June 2024: Babcock & Wilcox (B&W) revealed that its B&W Environmental business segment had secured over USD 18 million in contracts to design and provide wet and dry electrostatic precipitator (ESP) rebuilds for controlling particulate emissions at utility and industrial facilities in the United States and Europe.
| Report Attributes | Details |
|---|---|
| Market Size in 2023 | USD 7.56 Billion |
| Market Size by 2032 | USD 11.52 Billion |
| CAGR | CAGR of 4.79% From 2024 to 2032 |
| Base Year | 2023 |
| Forecast Period | 2024-2032 |
| Historical Data | 2020-2022 |
| Report Scope & Coverage | Market Size, Segments Analysis, Competitive Landscape, Regional Analysis, DROC & SWOT Analysis, Forecast Outlook |
| Key Segments | • By Type (Dry, Wet) • By Component (Hardware, Software, Services) • By End-User (Power, Metals, Cement, Chemicals, Media) |
| Regional Analysis/Coverage | North America (US, Canada, Mexico), Europe (Eastern Europe [Poland, Romania, Hungary, Turkey, Rest of Eastern Europe] Western Europe] Germany, France, UK, Italy, Spain, Netherlands, Switzerland, Austria, Rest of Western Europe]), Asia Pacific (China, India, Japan, South Korea, Vietnam, Singapore, Australia, Rest of Asia Pacific), Middle East & Africa (Middle East [UAE, Egypt, Saudi Arabia, Qatar, Rest of Middle East], Africa [Nigeria, South Africa, Rest of Africa], Latin America (Brazil, Argentina, Colombia, Rest of Latin America) |
| Company Profiles | Siemens AG, General Electric, Mitsubishi Hitachi Power Systems, Babcock & Wilcox, AMEC Foster Wheeler, Thermax, Ducon Technologies, Fujian Longking, Hamon Group, Trion, FLSmidth, KC Cottrell, Elex AG, Feida Group, McGill AirClean, Scheuch GmbH, Envitech Inc., Bionomic Industries, Southern Environmental, Inc., Hitachi Plant Technologies. |
Ans: The Electrostatic Precipitator Market is expected to grow at a CAGR of 4.79% during 2024-2032.
Ans: The Electrostatic Precipitator Market was USD 7.56 billion in 2023 and is expected to reach USD 11.52 billion by 2032.
Ans: The Electrostatic Precipitator Market was USD 7.56 billion in 2023 and is expected to reach USD 11.52 billion by 2032.
Ans: Stringent environmental regulations worldwide are driving demand for electrostatic precipitators as industries seek compliance with strict emission control standards.
Ans: The “Dry Electrostatic Precipitator (ESP)” segment dominated the Electrostatic Precipitator Market.
Ans: Asia-Pacific dominated the Electrostatic Precipitator Market in 2023.
1. Introduction
1.1 Market Definition
1.2 Scope (Inclusion and Exclusions)
1.3 Research Assumptions
2. Executive Summary
2.1 Market Overview
2.2 Regional Synopsis
2.3 Competitive Summary
3. Research Methodology
3.1 Top-Down Approach
3.2 Bottom-up Approach
3.3. Data Validation
3.4 Primary Interviews
4. Market Dynamics
4.1 Market Analysis
4.1.1 Drivers
4.1.2 Restraints
4.1.3 Opportunities
4.1.4 Challenges
4.2 PESTLE Analysis
4.3 Porter’s Five Forces Model
5. Statistical Insights and Trend Reporting
5.1 Installed Base & Capacity, by Region (2020-2023)
5.2 Utilization Rates, by Industry (2020-2023)
5.3 Maintenance & Downtime Metrics
5.4 Technological Adoption Rates, by Region
5.5 Export/Import Data, by Region (2023)
6. Competitive Landscape
6.1 List of Major Companies, By Region
6.2 Market Share Analysis, By Region
6.3 Product Benchmarking
6.3.1 Product specifications and features
6.3.2 Pricing
6.4 Strategic Initiatives
6.4.1 Marketing and promotional activities
6.4.2 Distribution and Supply Chain Strategies
6.4.3 Expansion plans and new product launches
6.4.4 Strategic partnerships and collaborations
6.5 Technological Advancements
6.6 Market Positioning and Branding
7. Electrostatic Precipitator Market Segmentation, By Type
7.1 Chapter Overview
7.2 Dry
7.2.1 Dry Market Trends Analysis (2020-2032)
7.2.2 Dry Market Size Estimates and Forecasts to 2032 (USD Billion)
7.3 Wet
7.3.1 Wet Market Trends Analysis (2020-2032)
7.3.2 Wet Market Size Estimates and Forecasts to 2032 (USD Billion)
8. Electrostatic Precipitator Market Segmentation, By Component
8.1 Chapter Overview
8.2 Hardware
8.2.1 Hardware Market Trends Analysis (2020-2032)
8.2.2 Hardware Market Size Estimates and Forecasts to 2032 (USD Billion)
8.3 Software
8.3.1 Software Market Trends Analysis (2020-2032)
8.3.2 Software Market Size Estimates and Forecasts to 2032 (USD Billion)
8.4 Services
8.3.1 Services Market Trends Analysis (2020-2032)
8.3.2 Services Market Size Estimates and Forecasts to 2032 (USD Billion)
9. Electrostatic Precipitator Market Segmentation, By End-User
9.1 Chapter Overview
9.2 Power
9.2.1 Power Market Trends Analysis (2020-2032)
9.2.2 Power Market Size Estimates and Forecasts to 2032 (USD Billion)
9.3 Metals
9.3.1 Metals Market Trends Analysis (2020-2032)
9.3.2 Metals Market Size Estimates and Forecasts to 2032 (USD Billion)
9.4 Cement
9.4.1 Cement Market Trends Analysis (2020-2032)
9.4.2 Cement Market Size Estimates and Forecasts to 2032 (USD Billion)
9.5 Chemicals
9.5.1 Chemicals Market Trends Analysis (2020-2032)
9.5.2 Chemicals Market Size Estimates and Forecasts to 2032 (USD Billion)
9.6 Media
9.6.1 Media Market Trends Analysis (2020-2032)
9.6.2 Media Market Size Estimates and Forecasts to 2032 (USD Billion)
10. Regional Analysis
10.1 Chapter Overview
10.2 North America
10.2.1 Trends Analysis
10.2.2 North America Electrostatic Precipitator Market Estimates and Forecasts, by Country (2020-2032) (USD Billion)
10.2.3 North America Electrostatic Precipitator Market Estimates and Forecasts, By Type (2020-2032) (USD Billion)
10.2.4 North America Electrostatic Precipitator Market Estimates and Forecasts, By Component (2020-2032) (USD Billion)
10.2.5 North America Electrostatic Precipitator Market Estimates and Forecasts, By End-User (2020-2032) (USD Billion)
10.2.6 USA
10.2.6.1 USA Electrostatic Precipitator Market Estimates and Forecasts, By Type (2020-2032) (USD Billion)
10.2.6.2 USA Electrostatic Precipitator Market Estimates and Forecasts, By Component (2020-2032) (USD Billion)
10.2.6.3 USA Electrostatic Precipitator Market Estimates and Forecasts, By End-User (2020-2032) (USD Billion)
10.2.7 Canada
10.2.7.1 Canada Electrostatic Precipitator Market Estimates and Forecasts, By Type (2020-2032) (USD Billion)
10.2.7.2 Canada Electrostatic Precipitator Market Estimates and Forecasts, By Component (2020-2032) (USD Billion)
10.2.7.3 Canada Electrostatic Precipitator Market Estimates and Forecasts, By End-User (2020-2032) (USD Billion)
10.2.8 Mexico
10.2.8.1 Mexico Electrostatic Precipitator Market Estimates and Forecasts, By Type (2020-2032) (USD Billion)
10.2.8.2 Mexico Electrostatic Precipitator Market Estimates and Forecasts, By Component (2020-2032) (USD Billion)
10.2.8.3 Mexico Electrostatic Precipitator Market Estimates and Forecasts, By End-User (2020-2032) (USD Billion)
10.3 Europe
10.3.1 Eastern Europe
10.3.1.1 Trends Analysis
10.3.1.2 Eastern Europe Electrostatic Precipitator Market Estimates and Forecasts, by Country (2020-2032) (USD Billion)
10.3.1.3 Eastern Europe Electrostatic Precipitator Market Estimates and Forecasts, By Type (2020-2032) (USD Billion)
10.3.1.4 Eastern Europe Electrostatic Precipitator Market Estimates and Forecasts, By Component (2020-2032) (USD Billion)
10.3.1.5 Eastern Europe Electrostatic Precipitator Market Estimates and Forecasts, By End-User (2020-2032) (USD Billion)
10.3.1.6 Poland
10.3.1.6.1 Poland Electrostatic Precipitator Market Estimates and Forecasts, By Type (2020-2032) (USD Billion)
10.3.1.6.2 Poland Electrostatic Precipitator Market Estimates and Forecasts, By Component (2020-2032) (USD Billion)
10.3.1.6.3 Poland Electrostatic Precipitator Market Estimates and Forecasts, By End-User (2020-2032) (USD Billion)
10.3.1.7 Romania
10.3.1.7.1 Romania Electrostatic Precipitator Market Estimates and Forecasts, By Type (2020-2032) (USD Billion)
10.3.1.7.2 Romania Electrostatic Precipitator Market Estimates and Forecasts, By Component (2020-2032) (USD Billion)
10.3.1.7.3 Romania Electrostatic Precipitator Market Estimates and Forecasts, By End-User (2020-2032) (USD Billion)
10.3.1.8 Hungary
10.3.1.8.1 Hungary Electrostatic Precipitator Market Estimates and Forecasts, By Type (2020-2032) (USD Billion)
10.3.1.8.2 Hungary Electrostatic Precipitator Market Estimates and Forecasts, By Component (2020-2032) (USD Billion)
10.3.1.8.3 Hungary Electrostatic Precipitator Market Estimates and Forecasts, By End-User (2020-2032) (USD Billion)
10.3.1.9 Turkey
10.3.1.9.1 Turkey Electrostatic Precipitator Market Estimates and Forecasts, By Type (2020-2032) (USD Billion)
10.3.1.9.2 Turkey Electrostatic Precipitator Market Estimates and Forecasts, By Component (2020-2032) (USD Billion)
10.3.1.9.3 Turkey Electrostatic Precipitator Market Estimates and Forecasts, By End-User (2020-2032) (USD Billion)
10.3.1.10 Rest of Eastern Europe
10.3.1.10.1 Rest of Eastern Europe Electrostatic Precipitator Market Estimates and Forecasts, By Type (2020-2032) (USD Billion)
10.3.1.10.2 Rest of Eastern Europe Electrostatic Precipitator Market Estimates and Forecasts, By Component (2020-2032) (USD Billion)
10.3.1.10.3 Rest of Eastern Europe Electrostatic Precipitator Market Estimates and Forecasts, By End-User (2020-2032) (USD Billion)
10.3.2 Western Europe
10.3.2.1 Trends Analysis
10.3.2.2 Western Europe Electrostatic Precipitator Market Estimates and Forecasts, by Country (2020-2032) (USD Billion)
10.3.2.3 Western Europe Electrostatic Precipitator Market Estimates and Forecasts, By Type (2020-2032) (USD Billion)
10.3.2.4 Western Europe Electrostatic Precipitator Market Estimates and Forecasts, By Component (2020-2032) (USD Billion)
10.3.2.5 Western Europe Electrostatic Precipitator Market Estimates and Forecasts, By End-User (2020-2032) (USD Billion)
10.3.2.6 Germany
10.3.2.6.1 Germany Electrostatic Precipitator Market Estimates and Forecasts, By Type (2020-2032) (USD Billion)
10.3.2.6.2 Germany Electrostatic Precipitator Market Estimates and Forecasts, By Component (2020-2032) (USD Billion)
10.3.2.6.3 Germany Electrostatic Precipitator Market Estimates and Forecasts, By End-User (2020-2032) (USD Billion)
10.3.2.7 France
10.3.2.7.1 France Electrostatic Precipitator Market Estimates and Forecasts, By Type (2020-2032) (USD Billion)
10.3.2.7.2 France Electrostatic Precipitator Market Estimates and Forecasts, By Component (2020-2032) (USD Billion)
10.3.2.7.3 France Electrostatic Precipitator Market Estimates and Forecasts, By End-User (2020-2032) (USD Billion)
10.3.2.8 UK
10.3.2.8.1 UK Electrostatic Precipitator Market Estimates and Forecasts, By Type (2020-2032) (USD Billion)
10.3.2.8.2 UK Electrostatic Precipitator Market Estimates and Forecasts, By Component (2020-2032) (USD Billion)
10.3.2.8.3 UK Electrostatic Precipitator Market Estimates and Forecasts, By End-User (2020-2032) (USD Billion)
10.3.2.9 Italy
10.3.2.9.1 Italy Electrostatic Precipitator Market Estimates and Forecasts, By Type (2020-2032) (USD Billion)
10.3.2.9.2 Italy Electrostatic Precipitator Market Estimates and Forecasts, By Component (2020-2032) (USD Billion)
10.3.2.9.3 Italy Electrostatic Precipitator Market Estimates and Forecasts, By End-User (2020-2032) (USD Billion)
10.3.2.10 Spain
10.3.2.10.1 Spain Electrostatic Precipitator Market Estimates and Forecasts, By Type (2020-2032) (USD Billion)
10.3.2.10.2 Spain Electrostatic Precipitator Market Estimates and Forecasts, By Component (2020-2032) (USD Billion)
10.3.2.10.3 Spain Electrostatic Precipitator Market Estimates and Forecasts, By End-User (2020-2032) (USD Billion)
10.3.2.11 Netherlands
10.3.2.11.1 Netherlands Electrostatic Precipitator Market Estimates and Forecasts, By Type (2020-2032) (USD Billion)
10.3.2.11.2 Netherlands Electrostatic Precipitator Market Estimates and Forecasts, By Component (2020-2032) (USD Billion)
10.3.2.11.3 Netherlands Electrostatic Precipitator Market Estimates and Forecasts, By End-User (2020-2032) (USD Billion)
10.3.2.12 Switzerland
10.3.2.12.1 Switzerland Electrostatic Precipitator Market Estimates and Forecasts, By Type (2020-2032) (USD Billion)
10.3.2.12.2 Switzerland Electrostatic Precipitator Market Estimates and Forecasts, By Component (2020-2032) (USD Billion)
10.3.2.12.3 Switzerland Electrostatic Precipitator Market Estimates and Forecasts, By End-User (2020-2032) (USD Billion)
10.3.2.13 Austria
10.3.2.13.1 Austria Electrostatic Precipitator Market Estimates and Forecasts, By Type (2020-2032) (USD Billion)
10.3.2.13.2 Austria Electrostatic Precipitator Market Estimates and Forecasts, By Component (2020-2032) (USD Billion)
10.3.2.13.3 Austria Electrostatic Precipitator Market Estimates and Forecasts, By End-User (2020-2032) (USD Billion)
10.3.2.14 Rest of Western Europe
10.3.2.14.1 Rest of Western Europe Electrostatic Precipitator Market Estimates and Forecasts, By Type (2020-2032) (USD Billion)
10.3.2.14.2 Rest of Western Europe Electrostatic Precipitator Market Estimates and Forecasts, By Component (2020-2032) (USD Billion)
10.3.2.14.3 Rest of Western Europe Electrostatic Precipitator Market Estimates and Forecasts, By End-User (2020-2032) (USD Billion)
10.4 Asia-Pacific
10.4.1 Trends Analysis
10.4.2 Asia-Pacific Electrostatic Precipitator Market Estimates and Forecasts, by Country (2020-2032) (USD Billion)
10.4.3 Asia-Pacific Electrostatic Precipitator Market Estimates and Forecasts, By Type (2020-2032) (USD Billion)
10.4.4 Asia-Pacific Electrostatic Precipitator Market Estimates and Forecasts, By Component (2020-2032) (USD Billion)
10.4.5 Asia-Pacific Electrostatic Precipitator Market Estimates and Forecasts, By End-User (2020-2032) (USD Billion)
10.4.6 China
10.4.6.1 China Electrostatic Precipitator Market Estimates and Forecasts, By Type (2020-2032) (USD Billion)
10.4.6.2 China Electrostatic Precipitator Market Estimates and Forecasts, By Component (2020-2032) (USD Billion)
10.4.6.3 China Electrostatic Precipitator Market Estimates and Forecasts, By End-User (2020-2032) (USD Billion)
10.4.7 India
10.4.7.1 India Electrostatic Precipitator Market Estimates and Forecasts, By Type (2020-2032) (USD Billion)
10.4.7.2 India Electrostatic Precipitator Market Estimates and Forecasts, By Component (2020-2032) (USD Billion)
10.4.7.3 India Electrostatic Precipitator Market Estimates and Forecasts, By End-User (2020-2032) (USD Billion)
10.4.8 Japan
10.4.8.1 Japan Electrostatic Precipitator Market Estimates and Forecasts, By Type (2020-2032) (USD Billion)
10.4.8.2 Japan Electrostatic Precipitator Market Estimates and Forecasts, By Component (2020-2032) (USD Billion)
10.4.8.3 Japan Electrostatic Precipitator Market Estimates and Forecasts, By End-User (2020-2032) (USD Billion)
10.4.9 South Korea
10.4.9.1 South Korea Electrostatic Precipitator Market Estimates and Forecasts, By Type (2020-2032) (USD Billion)
10.4.9.2 South Korea Electrostatic Precipitator Market Estimates and Forecasts, By Component (2020-2032) (USD Billion)
10.4.9.3 South Korea Electrostatic Precipitator Market Estimates and Forecasts, By End-User (2020-2032) (USD Billion)
10.4.10 Vietnam
10.4.10.1 Vietnam Electrostatic Precipitator Market Estimates and Forecasts, By Type (2020-2032) (USD Billion)
10.4.10.2 Vietnam Electrostatic Precipitator Market Estimates and Forecasts, By Component (2020-2032) (USD Billion)
10.4.10.3 Vietnam Electrostatic Precipitator Market Estimates and Forecasts, By End-User (2020-2032) (USD Billion)
10.4.11 Singapore
10.4.11.1 Singapore Electrostatic Precipitator Market Estimates and Forecasts, By Type (2020-2032) (USD Billion)
10.4.11.2 Singapore Electrostatic Precipitator Market Estimates and Forecasts, By Component (2020-2032) (USD Billion)
10.4.11.3 Singapore Electrostatic Precipitator Market Estimates and Forecasts, By End-User (2020-2032) (USD Billion)
10.4.12 Australia
10.4.12.1 Australia Electrostatic Precipitator Market Estimates and Forecasts, By Type (2020-2032) (USD Billion)
10.4.12.2 Australia Electrostatic Precipitator Market Estimates and Forecasts, By Component (2020-2032) (USD Billion)
10.4.12.3 Australia Electrostatic Precipitator Market Estimates and Forecasts, By End-User (2020-2032) (USD Billion)
10.4.13 Rest of Asia-Pacific
10.4.13.1 Rest of Asia-Pacific Electrostatic Precipitator Market Estimates and Forecasts, By Type (2020-2032) (USD Billion)
10.4.13.2 Rest of Asia-Pacific Electrostatic Precipitator Market Estimates and Forecasts, By Component (2020-2032) (USD Billion)
10.4.13.3 Rest of Asia-Pacific Electrostatic Precipitator Market Estimates and Forecasts, By End-User (2020-2032) (USD Billion)
10.5 Middle East and Africa
10.5.1 Middle East
10.5.1.1 Trends Analysis
10.5.1.2 Middle East Electrostatic Precipitator Market Estimates and Forecasts, by Country (2020-2032) (USD Billion)
10.5.1.3 Middle East Electrostatic Precipitator Market Estimates and Forecasts, By Type (2020-2032) (USD Billion)
10.5.1.4 Middle East Electrostatic Precipitator Market Estimates and Forecasts, By Component (2020-2032) (USD Billion)
10.5.1.5 Middle East Electrostatic Precipitator Market Estimates and Forecasts, By End-User (2020-2032) (USD Billion)
10.5.1.6 UAE
10.5.1.6.1 UAE Electrostatic Precipitator Market Estimates and Forecasts, By Type (2020-2032) (USD Billion)
10.5.1.6.2 UAE Electrostatic Precipitator Market Estimates and Forecasts, By Component (2020-2032) (USD Billion)
10.5.1.6.3 UAE Electrostatic Precipitator Market Estimates and Forecasts, By End-User (2020-2032) (USD Billion)
10.5.1.7 Egypt
10.5.1.7.1 Egypt Electrostatic Precipitator Market Estimates and Forecasts, By Type (2020-2032) (USD Billion)
10.5.1.7.2 Egypt Electrostatic Precipitator Market Estimates and Forecasts, By Component (2020-2032) (USD Billion)
10.5.1.7.3 Egypt Electrostatic Precipitator Market Estimates and Forecasts, By End-User (2020-2032) (USD Billion)
10.5.1.8 Saudi Arabia
10.5.1.8.1 Saudi Arabia Electrostatic Precipitator Market Estimates and Forecasts, By Type (2020-2032) (USD Billion)
10.5.1.8.2 Saudi Arabia Electrostatic Precipitator Market Estimates and Forecasts, By Component (2020-2032) (USD Billion)
10.5.1.8.3 Saudi Arabia Electrostatic Precipitator Market Estimates and Forecasts, By End-User (2020-2032) (USD Billion)
10.5.1.9 Qatar
10.5.1.9.1 Qatar Electrostatic Precipitator Market Estimates and Forecasts, By Type (2020-2032) (USD Billion)
10.5.1.9.2 Qatar Electrostatic Precipitator Market Estimates and Forecasts, By Component (2020-2032) (USD Billion)
10.5.1.9.3 Qatar Electrostatic Precipitator Market Estimates and Forecasts, By End-User (2020-2032) (USD Billion)
10.5.1.10 Rest of Middle East
10.5.1.10.1 Rest of Middle East Electrostatic Precipitator Market Estimates and Forecasts, By Type (2020-2032) (USD Billion)
10.5.1.10.2 Rest of Middle East Electrostatic Precipitator Market Estimates and Forecasts, By Component (2020-2032) (USD Billion)
10.5.1.10.3 Rest of Middle East Electrostatic Precipitator Market Estimates and Forecasts, By End-User (2020-2032) (USD Billion)
10.5.2 Africa
10.5.2.1 Trends Analysis
10.5.2.2 Africa Electrostatic Precipitator Market Estimates and Forecasts, by Country (2020-2032) (USD Billion)
10.5.2.3 Africa Electrostatic Precipitator Market Estimates and Forecasts, By Type (2020-2032) (USD Billion)
10.5.2.4 Africa Electrostatic Precipitator Market Estimates and Forecasts, By Component (2020-2032) (USD Billion)
10.5.2.5 Africa Electrostatic Precipitator Market Estimates and Forecasts, By End-User (2020-2032) (USD Billion)
10.5.2.6 South Africa
10.5.2.6.1 South Africa Electrostatic Precipitator Market Estimates and Forecasts, By Type (2020-2032) (USD Billion)
10.5.2.6.2 South Africa Electrostatic Precipitator Market Estimates and Forecasts, By Component (2020-2032) (USD Billion)
10.5.2.6.3 South Africa Electrostatic Precipitator Market Estimates and Forecasts, By End-User (2020-2032) (USD Billion)
10.5.2.7 Nigeria
10.5.2.7.1 Nigeria Electrostatic Precipitator Market Estimates and Forecasts, By Type (2020-2032) (USD Billion)
10.5.2.7.2 Nigeria Electrostatic Precipitator Market Estimates and Forecasts, By Component (2020-2032) (USD Billion)
10.5.2.7.3 Nigeria Electrostatic Precipitator Market Estimates and Forecasts, By End-User (2020-2032) (USD Billion)
10.5.2.8 Rest of Africa
10.5.2.8.1 Rest of Africa Electrostatic Precipitator Market Estimates and Forecasts, By Type (2020-2032) (USD Billion)
10.5.2.8.2 Rest of Africa Electrostatic Precipitator Market Estimates and Forecasts, By Component (2020-2032) (USD Billion)
10.5.2.8.3 Rest of Africa Electrostatic Precipitator Market Estimates and Forecasts, By End-User (2020-2032) (USD Billion)
10.6 Latin America
10.6.1 Trends Analysis
10.6.2 Latin America Electrostatic Precipitator Market Estimates and Forecasts, by Country (2020-2032) (USD Billion)
10.6.3 Latin America Electrostatic Precipitator Market Estimates and Forecasts, By Type (2020-2032) (USD Billion)
10.6.4 Latin America Electrostatic Precipitator Market Estimates and Forecasts, By Component (2020-2032) (USD Billion)
10.6.5 Latin America Electrostatic Precipitator Market Estimates and Forecasts, By End-User (2020-2032) (USD Billion)
10.6.6 Brazil
10.6.6.1 Brazil Electrostatic Precipitator Market Estimates and Forecasts, By Type (2020-2032) (USD Billion)
10.6.6.2 Brazil Electrostatic Precipitator Market Estimates and Forecasts, By Component (2020-2032) (USD Billion)
10.6.6.3 Brazil Electrostatic Precipitator Market Estimates and Forecasts, By End-User (2020-2032) (USD Billion)
10.6.7 Argentina
10.6.7.1 Argentina Electrostatic Precipitator Market Estimates and Forecasts, By Type (2020-2032) (USD Billion)
10.6.7.2 Argentina Electrostatic Precipitator Market Estimates and Forecasts, By Component (2020-2032) (USD Billion)
10.6.7.3 Argentina Electrostatic Precipitator Market Estimates and Forecasts, By End-User (2020-2032) (USD Billion)
10.6.8 Colombia
10.6.8.1 Colombia Electrostatic Precipitator Market Estimates and Forecasts, By Type (2020-2032) (USD Billion)
10.6.8.2 Colombia Electrostatic Precipitator Market Estimates and Forecasts, By Component (2020-2032) (USD Billion)
10.6.8.3 Colombia Electrostatic Precipitator Market Estimates and Forecasts, By End-User (2020-2032) (USD Billion)
10.6.9 Rest of Latin America
10.6.9.1 Rest of Latin America Electrostatic Precipitator Market Estimates and Forecasts, By Type (2020-2032) (USD Billion)
10.6.9.2 Rest of Latin America Electrostatic Precipitator Market Estimates and Forecasts, By Component (2020-2032) (USD Billion)
10.6.9.3 Rest of Latin America Electrostatic Precipitator Market Estimates and Forecasts, By End-User (2020-2032) (USD Billion)
11. Company Profiles
11.1 Siemens AG
11.1.1 Company Overview
11.1.2 Financial
11.1.3 Products/ Services Offered
11.1.4 SWOT Analysis
11.2 General Electric
11.2.1 Company Overview
11.2.2 Financial
11.2.3 Products/ Services Offered
11.2.4 SWOT Analysis
11.3 Mitsubishi Hitachi Power Systems
11.3.1 Company Overview
11.3.2 Financial
11.3.3 Products/ Services Offered
11.3.4 SWOT Analysis
11.4 Babcock & Wilcox Enterprises, Inc.
11.4.1 Company Overview
11.4.2 Financial
11.4.3 Products/ Services Offered
11.4.4 SWOT Analysis
11.5 AMEC Foster Wheeler
11.5.1 Company Overview
11.5.2 Financial
11.5.3 Products/ Services Offered
11.5.4 SWOT Analysis
11.6 Thermax Limited
11.6.1 Company Overview
11.6.2 Financial
11.6.3 Products/ Services Offered
11.6.4 SWOT Analysis
11.7 Ducon Technologies Inc.
11.7.1 Company Overview
11.7.2 Financial
11.7.3 Products/ Services Offered
11.7.4 SWOT Analysis
11.8 Fujian Longking Co., Ltd.
11.8.1 Company Overview
11.8.2 Financial
11.8.3 Products/ Services Offered
11.8.4 SWOT Analysis
11.9 Hamon Group
11.9.1 Company Overview
11.9.2 Financial
11.9.3 Products/ Services Offered
11.9.4 SWOT Analysis
11.10 Trion IAQ
11.10.1 Company Overview
11.10.2 Financial
11.10.3 Products/ Services Offered
11.10.4 SWOT Analysis
12. Use Cases and Best Practices
13. Conclusion
An accurate research report requires proper strategizing as well as implementation. There are multiple factors involved in the completion of good and accurate research report and selecting the best methodology to compete the research is the toughest part. Since the research reports we provide play a crucial role in any company’s decision-making process, therefore we at SNS Insider always believe that we should choose the best method which gives us results closer to reality. This allows us to reach at a stage wherein we can provide our clients best and accurate investment to output ratio.
Each report that we prepare takes a timeframe of 350-400 business hours for production. Starting from the selection of titles through a couple of in-depth brain storming session to the final QC process before uploading our titles on our website we dedicate around 350 working hours. The titles are selected based on their current market cap and the foreseen CAGR and growth.
The 5 steps process:
Step 1: Secondary Research:
Secondary Research or Desk Research is as the name suggests is a research process wherein, we collect data through the readily available information. In this process we use various paid and unpaid databases which our team has access to and gather data through the same. This includes examining of listed companies’ annual reports, Journals, SEC filling etc. Apart from this our team has access to various associations across the globe across different industries. Lastly, we have exchange relationships with various university as well as individual libraries.

Step 2: Primary Research
When we talk about primary research, it is a type of study in which the researchers collect relevant data samples directly, rather than relying on previously collected data. This type of research is focused on gaining content specific facts that can be sued to solve specific problems. Since the collected data is fresh and first hand therefore it makes the study more accurate and genuine.
We at SNS Insider have divided Primary Research into 2 parts.
Part 1 wherein we interview the KOLs of major players as well as the upcoming ones across various geographic regions. This allows us to have their view over the market scenario and acts as an important tool to come closer to the accurate market numbers. As many as 45 paid and unpaid primary interviews are taken from both the demand and supply side of the industry to make sure we land at an accurate judgement and analysis of the market.
This step involves the triangulation of data wherein our team analyses the interview transcripts, online survey responses and observation of on filed participants. The below mentioned chart should give a better understanding of the part 1 of the primary interview.

Part 2: In this part of primary research the data collected via secondary research and the part 1 of the primary research is validated with the interviews from individual consultants and subject matter experts.
Consultants are those set of people who have at least 12 years of experience and expertise within the industry whereas Subject Matter Experts are those with at least 15 years of experience behind their back within the same space. The data with the help of two main processes i.e., FGDs (Focused Group Discussions) and IDs (Individual Discussions). This gives us a 3rd party nonbiased primary view of the market scenario making it a more dependable one while collation of the data pointers.
Step 3: Data Bank Validation
Once all the information is collected via primary and secondary sources, we run that information for data validation. At our intelligence centre our research heads track a lot of information related to the market which includes the quarterly reports, the daily stock prices, and other relevant information. Our data bank server gets updated every fortnight and that is how the information which we collected using our primary and secondary information is revalidated in real time.

Step 4: QA/QC Process
After all the data collection and validation our team does a final level of quality check and quality assurance to get rid of any unwanted or undesired mistakes. This might include but not limited to getting rid of the any typos, duplication of numbers or missing of any important information. The people involved in this process include technical content writers, research heads and graphics people. Once this process is completed the title gets uploader on our platform for our clients to read it.
Step 5: Final QC/QA Process:
This is the last process and comes when the client has ordered the study. In this process a final QA/QC is done before the study is emailed to the client. Since we believe in giving our clients a good experience of our research studies, therefore, to make sure that we do not lack at our end in any way humanly possible we do a final round of quality check and then dispatch the study to the client.
By Type
Dry
Wet
By Component
Hardware
Software
Services
By End-User
Power
Metals
Cement
Chemicals
Media
Request for Segment Customization as per your Business Requirement: Segment Customization Request
North America
US
Canada
Mexico
Europe
Eastern Europe
Poland
Romania
Hungary
Turkey
Rest of Eastern Europe
Western Europe
Germany
France
UK
Italy
Spain
Netherlands
Switzerland
Austria
Rest of Western Europe
Asia Pacific
China
India
Japan
South Korea
Vietnam
Singapore
Australia
Rest of Asia Pacific
Middle East & Africa
Middle East
UAE
Egypt
Saudi Arabia
Qatar
Rest of Middle East
Africa
Nigeria
South Africa
Rest of Africa
Latin America
Brazil
Argentina
Colombia
Rest of Latin America
Request for Country Level Research Report: Country Level Customization Request
Available Customization
With the given market data, SNS Insider offers customization as per the company’s specific needs. The following customization options are available for the report:
Detailed Volume Analysis
Criss-Cross segment analysis (e.g. Product X Application)
Competitive Product Benchmarking
Geographic Analysis
Additional countries in any of the regions
Customized Data Representation
Detailed analysis and profiling of additional market players
Bubble Generator Market was estimated at USD 1.31 Bn in 2023 and is expected to arrive at USD 2.34 Bn by 2032 with a growing CAGR of 6.64% from 2024-2032.
The Carbonization Furnace Market Size was valued at USD 238.96 Million in 2023 and is expected to reach USD 564.19 Million by 2032 and grow at a CAGR of 10.07% over the forecast period 2024-2032.
The Bearings Market size was valued USD 82.48 Billion in 2023 and is expected to reach USD 186.43 Billion by 2032 and grow at a CAGR of 9.49% by 2024-2032.
The Laboratory Centrifuges Market Size was USD 1.76 Billion in 2023 and is expected to reach $2.65 Bn by 2032 and grow at a CAGR of 4.64% by 2024-2032.
The Gas Leak Detector Market Size was valued at USD 5.06 Billion in 2023 and is now anticipated to grow to USD 8.84 Billion by 2032, displaying a compound annual growth rate (CAGR) of 6.4% during the forecast Period 2024-2032.
The Intelligent Vending Machines Market size was valued at USD 22.15 billion in 2023 and is expected to reach USD 72.25 billion by 2032 and grow at a CAGR of 14.05% over the forecast period 2024-2032.

Hi! Click one of our member below to chat on Phone
© 2025 All Rights Reserved by SNS Insider Pvt Ltd


