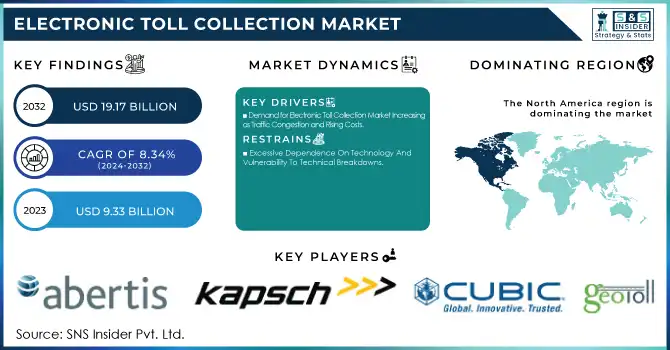
The Electronic Toll Collection Market Size was valued at USD 9.33 billion in 2023, is expected to grow to USD 19.17 billion by 2032, with a CAGR of 8.34% Over the Forecast Period 2024-2032.
The demand for reducing traffic congestion and road accidents as well as the development of smart transportation infrastructure is driving the growing market growth for smart traffic systems. Gen AI applications through fraud detection and analysis of traffic patterns are creating disruptive innovations in the area of toll management, including data optimized tolling rates in real-time. Innovation and R&D are leading to constant transformation, with ETC systems across the world becoming increasingly scalable and efficient.
Get more information on Electronic Toll Collection Market - Request Sample Report
Drivers:
Demand for Electronic Toll Collection Market Increasing as Traffic Congestion and Rising Costs
The growing problem of traffic congestion in urban areas and highways acts as another major driving factor for the Electronic Toll Collection (ETC) market. However, for instance, under congestion pricing, drivers with E-ZPass get a USD 3 credit on the USD 9 toll, a reminder of the need for a tolling solution that works seamlessly with each system. The sitting in traffic cost drivers more than 1800 USD per year, or almost three weeks of work, according to a transportation analytics company. Rising costs and inefficiencies are driving demand for next-generation Electronic Toll Collection systems that decrease wait times, enhance traffic flow, and mitigate congestion. With governments moving towards developing smart transport infrastructure, Electronic Toll Collection systems are becoming paramount to increase urban mobility and lower costs.
Restraints:
Excessive Dependence On Technology And Vulnerability To Technical Breakdowns
Reliance on technology is a major restraint on the ETC market as it is sensitive to technical failures. ETC (electronic toll collection) systems involve LIDAR, radio frequency identification (RFID), dedicated short range communication (DSRC) systems, and other communication systems to perform these transactions, resulting in operational challenges of signal interference and malfunctioning systems, and the consequence of an integrity deficiency of information. Either regular updates or maintenance of every system could increase operational cost or it could cause discontinuity in smooth functioning of Electronic Toll Collection systems. To overcome these hurdles, continuous development of Electronic Toll Collection tech is needed.
Opportunities:
Electronic Toll Collection Market Growth with Contactless Payment Solutions
Due to the increasing shift towards contactless payment methods in urban toll systems, the Electronic Toll Collection market is rapidly growing. Compared to traditional toll collection systems, which operate through cash transactions, these systems are more than 50% efficient, with congestion at tollbooths decreasing by up to 30%, while providing operational and environmental benefits. With governments placing greater focus on modernizing infrastructure, the need for better toll systems supported by contactless payments is likely to grow. As a result, electronic tolling systems are set to see increased investments, with benefits of accelerating traffic flow, improving sustainability, and optimizing the collection of tolls.
Challenges:
Cyber-security Risks and Data Privacy in Electronic Toll Collection Market
The Electronic Toll Collection market is expected to be impacted by rising concerns over data privacy associated with the collection and processing of data as it pertains to personal and payment-related information with respect to the vehicles. However, as more electronic toll systems are introduced, hackers, data breaches and unauthorized access, also increasingly target them. These kinds of privacy violations can put a company in hot water with regulators and cause it to lose user trust. Data Security On the cybersecurity side, robust security protocols need to be put in place to protect personal data and stave off threats associated with identity fraud or the tampering of travel records. This way, ETC market can grow sustainably while following data protection regulations like GDPR.
By Type
The Electronic Toll Collection market is dominated by Transponder/Tag-based tolling systems with a market share of approximately 70% in 2023. Equipped with RFID technology, these systems enable seamless and contactless toll collection, thereby reducing congestion and optimizing traffic flow. They are essential to modern tolling infrastructure due to their efficiency and convenience, as well as the increasing demand for digital payment solutions.
The Other Tolling Systems segment, which includes GPS, video-based, and ANPR technologies, will also see substantial growth as it requires hardly any field hardware and is highly scalable.
By Offering
In 2023, the Hardware segment dominated the Electronic Toll Collection Market, accounting for over 60% of the share, owing to the availability of transponders, tags, and readers. This increase is driven by a growing rollout of the automated toll systems that make the process more efficient and cut down on congestion.
The Back-office and Other Services segment is projected to have the highest CAGR over the forecast period 2024-2032, due to growth for software solutions, data analytics, and system integration, leading to improved data management, payment processing, and system scalability.
By Technology
In 2023, the market was segmented into RFID, ARP, GNSS, and others, with RFID dominating the Electronic Toll Collection Market holding upwards of a 55% market share leveraging radio frequency identification for seamless tolling. RFID technology is used in vehicles to the pass through the tollbooths without stopping, alleviating the traffic signals. Its growth trajectory is attributed to increasing demand for contactless payments, lower operational costs, and scalability.
The DSRC segment is projected to witness the fastest growth during the forecast period of 2024-2032, whose enabling rapid and low-latency communication facilitates data sharing in real time, enhances the efficiency of toll collection and this in conjunction with growing investment in smart infrastructure investment.
By Application
The Highways segment, including toll systems integrated within highways and expressways to decrease congestion and improve traffic flow, led the Electronic Toll Collection Market in 2023, accounting for 61% of the total market share. This growth is propelled by the requirement for efficient, contactless tolling solutions along with the development of smart highway infrastructure.
As urban areas invest in automated tolling systems for traffic management and improved air quality, the Urban Areas segment is anticipated to witness the fastest growth between 2024 and 2032. This growth is intensifying with government initiatives and smart city investments.
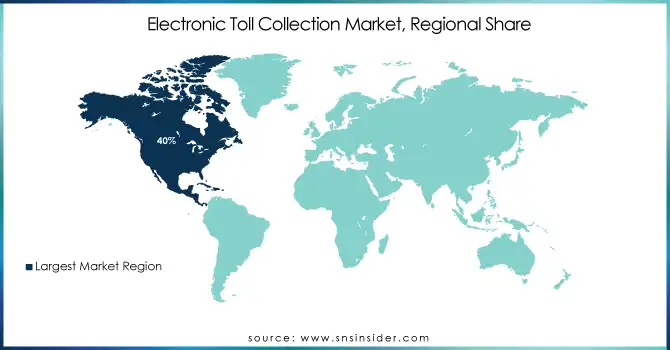
North America accounted for the largest revenue share in Electronic Toll Collection market, with over 40% revenue share in 2023. The growing adoption of advanced tolling technologies, especially in the U.S. and Canada, is a key driver for the region's domination. Infrastructure that increases the efficacy of toll collection over urban and highway areas is already well established in the U.S. The growth of the market increases due to the government initiatives supporting automated toll systems, contactless payments, and expansion of electronic tolling networks. North America's established network of transportation and continuous innovation further strengthened North America Electronic Toll Collection market.
The Asia-pacific region will be the fastest growing region in the Electronic Toll Collection market and will expect to develop rapidly throughout the forecast period of 2024-2032. Leading nations like China, India, Japan, and South Korea are at the spearhead of this drive for market expansion. China’s extensive investments in smart infrastructure and its efforts to promote digital payment systems are playing a big part in the growth of the region. Various countries are already adopting tolling systems to ensure efficient traffic management such as India while companies in Japan and South Korea are even updating with automated toll collection technologies. Factors such as the increasing urbanization, the increasing demand for smart transportation systems, and government initiatives to modernize infrastructure are driving the rapid growth of the region.
Need any customization research on Electronic Toll Collection Market - Enquiry Now
Some of the Major Key Players in Electronic Toll Collection Market Along With Their Product:
Kapsch TrafficCom AG (Austria) – (ETC Systems, RFID Transponders, Tolling Software)
Conduent Business Services (U.S.) – (Tolling Back-Office Solutions, Automatic Number Plate Recognition [ANPR])
EFKON GmbH (Austria) – (Multilane Free Flow Tolling, RFID & DSRC-Based Systems)
TransCore Holdings, Inc. (U.S.) – (RFID Toll Tags, Intelligent Tolling Systems, Traffic Management Solutions)
Thales Group (U.S.) – (Secure Toll Payment Solutions, Smart Mobility Platforms)
Raytheon Technologies Corporation (U.S.) – (Advanced Sensor Systems, Intelligent Transportation Solutions)
Cubic Corporation (U.S.) – (Contactless Toll Payment Systems, Smart Card-Based Fare Collection)
Siemens (Germany) – (Automated Toll Collection Systems, Intelligent Traffic Management)
Neology, Inc. (U.S.) – (RFID-Based Tolling, License Plate Recognition Systems)
VINCI (France) – (Toll Infrastructure Development, Highway Tolling Services)
Feig Electronic GmbH (Germany) – (RFID Toll Collection Readers, Smart Card Readers)
Toshiba Corporation (Japan) – (ETC Communication Units, Toll Gate Management Systems)
TRMI Systems Integration (Japan) – (Vehicle Detection & Classification Systems, Toll Automation)
Magnetic AutoControl (Germany) – (Barrier Gate Systems, Toll Access Control)
International Road Dynamics Inc. (IRD) (Canada) – (Weigh-in-Motion [WIM] Systems, Toll Data Processing Solutions)
Honeywell International, Inc. (U.S.) – (Traffic Monitoring Sensors, ETC Data Analytics)
Mitsubishi Heavy Industries, Ltd. (Japan) – (Electronic Toll Gates, ITS-Based Tolling Solutions)
Perceptics (U.S.) – (High-Resolution License Plate Readers, Vehicle Recognition Systems)
Q-Free (Norway) – (DSRC-Based Tolling, Congestion Charging Solutions)
List of Suppliers who provide raw material and Component
NXP Semiconductors (Netherlands)
STMicroelectronics (Switzerland)
Texas Instruments (U.S.)
Infineon Technologies (Germany)
Sony Corporation (Japan)
OmniVision Technologies (U.S.)
Qualcomm (U.S.)
u-blox (Switzerland)
Magnetic AutoControl (Germany)
FAAC Group (Italy)
May 03, 2024 – Neology’s 6C neoTag™ RFID transponders achieved IAG E-ZPass certification following 11,000 vehicle passes with 100% accuracy at Neology’s OmniAir Certified Test Track. That certification makes it interoperable with all agency tag types in the U.S. – an economical, battery-free and green solution to tolling.
February 21, 2024 – Toshiba introduced high-speed diodes for many types of DTMOSVI(HSD) power MOSFETs to enhance the efficiency of power supplies. The DTMOSVI Series enables 65% better reverse recovery in trr and x88% better in Qrr for 0.4% efficiency gain for data centers, photovoltaic power and electric toll collection.
| Report Attributes | Details |
| Market Size in 2023 | USD 9.33 Billion |
| Market Size by 2032 | USD 19.17 Billion |
| CAGR | CAGR of 8.34% From 2024 to 2032 |
| Base Year | 2023 |
| Forecast Period | 2024-2032 |
| Historical Data | 2020-2022 |
| Report Scope & Coverage | Market Size, Segments Analysis, Competitive Landscape, Regional Analysis, DROC & SWOT Analysis, Forecast Outlook |
| Key Segments | • By Type (Transponder-/Tag-based Tolling Systems, Other Tolling Systems) • By Offering (Hardware, Back-office and Other Services) • By Technology (RFID, DSRC, Others) • By Application (Highways, Urban Areas) |
| Regional Analysis/Coverage | North America (US, Canada, Mexico), Europe (Eastern Europe [Poland, Romania, Hungary, Turkey, Rest of Eastern Europe] Western Europe] Germany, France, UK, Italy, Spain, Netherlands, Switzerland, Austria, Rest of Western Europe]), Asia Pacific (China, India, Japan, South Korea, Vietnam, Singapore, Australia, Rest of Asia Pacific), Middle East & Africa (Middle East [UAE, Egypt, Saudi Arabia, Qatar, Rest of Middle East], Africa [Nigeria, South Africa, Rest of Africa], Latin America (Brazil, Argentina, Colombia, Rest of Latin America) |
| Company Profiles | Kapsch TrafficCom AG (Austria), Conduent Business Services (U.S.), EFKON GmbH (Austria), TransCore Holdings, Inc. (U.S.), Thales Group (U.S.), Raytheon Technologies Corporation (U.S.), Cubic Corporation (U.S.), Siemens (Germany), Neology, Inc. (U.S.), VINCI (France), Feig Electronic GmbH (Germany), Toshiba Corporation (Japan), TRMI Systems Integration (Japan), Magnetic AutoControl (Germany), International Road Dynamics Inc. (IRD) (Canada), Honeywell International, Inc. (U.S.), Mitsubishi Heavy Industries, Ltd. (Japan), Perceptics (U.S.), Q-Free (Norway). |
Ans: The Electronic Toll Collection Market size was valued at USD 9.33 billion in 2023.
Ans: The key market driver in the Electronic Toll Collection (ETC) market is the increasing demand for efficient, contactless toll collection solutions to reduce congestion and improve traffic flow.
Ans: The market has been segmented with respect to type, offering, technology and application.
Ans: North American region is expected to dominate the Electronic Toll Collection Market.
Ans: The Electronic Toll Collection Market is growing at a CAGR of 7.56% over the forecast period 2024-2032.
Table of Content
1. Introduction
1.1 Market Definition
1.2 Scope (Inclusion and Exclusions)
1.3 Research Assumptions
2. Executive Summary
2.1 Market Overview
2.2 Regional Synopsis
2.3 Competitive Summary
3. Research Methodology
3.1 Top-Down Approach
3.2 Bottom-up Approach
3.3. Data Validation
3.4 Primary Interviews
4. Market Dynamics Impact Analysis
4.1 Market Driving Factors Analysis
4.1.1 Drivers
4.1.2 Restraints
4.1.3 Opportunities
4.1.4 Challenges
4.2 PESTLE Analysis
4.3 Porter’s Five Forces Model
5. Statistical Insights and Trends Reporting
5.1 ETC Adoption & Usage Statistics
5.2 Government & Investment Data
5.3 Infrastructure & Adoption Data
5.5 Innovation and R&D
6. Competitive Landscape
6.1 List of Major Companies, By Region
6.2 Market Share Analysis, By Region
6.3 Product Benchmarking
6.3.1 Product specifications and features
6.3.2 Pricing
6.4 Strategic Initiatives
6.4.1 Marketing and promotional activities
6.4.2 Distribution and supply chain strategies
6.4.3 Expansion plans and new product launches
6.4.4 Strategic partnerships and collaborations
6.5 Technological Advancements
6.6 Market Positioning and Branding
7. Electronic Toll Collection Market Segmentation, by Type
7.1 Chapter Overview
7.2 Transponder/Tag-based Tolling Systems
7.2.1 Transponder/Tag-based Tolling Systems Market Trends Analysis (2020-2032)
7.2.2 Transponder/Tag-based Tolling Systems Market Size Estimates and Forecasts to 2032 (USD Billion)
7.3 Other Tolling Systems
7.3.1 Other Tolling Systems Market Trends Analysis (2020-2032)
7.3.2 Other Tolling Systems Market Size Estimates and Forecasts to 2032 (USD Billion)
8. Electronic Toll Collection Market Segmentation, by Offering
8.1 Chapter Overview
8.2 Hardware
8.2.1 Hardware Market Trends Analysis (2020-2032)
8.2.2 Hardware Market Size Estimates and Forecasts to 2032 (USD Billion)
8.3 Back-office and Other Services
8.3.1 Back-office and Other Services Market Trends Analysis (2020-2032)
8.3.2 Back-office and Other Services Market Size Estimates and Forecasts to 2032 (USD Billion)
9. Electronic Toll Collection Market Segmentation, by Technology
9.1 Chapter Overview
9.2 RFID
9.2.1 RFID Market Trends Analysis (2020-2032)
9.2.2 RFID Market Size Estimates and Forecasts to 2032 (USD Billion)
9.3 DSRC
9.3.1 DSRC Market Trends Analysis (2020-2032)
9.3.2 DSRC Market Size Estimates and Forecasts to 2032 (USD Billion)
9.4 Others
9.4.1 Others Market Trends Analysis (2020-2032)
9.4.2 Others Market Size Estimates and Forecasts to 2032 (USD Billion)
10. Electronic Toll Collection Market Segmentation, by Application
10.1 Chapter Overview
10.2 Highways
10.2.1 Highways Market Trends Analysis (2020-2032)
10.2.2 Highways Market Size Estimates and Forecasts to 2032 (USD Billion)
10.3 Urban Areas
10.3.1 Urban Areas Market Trends Analysis (2020-2032)
10.3.2 Urban Areas Market Size Estimates and Forecasts to 2032 (USD Billion)
11. Regional Analysis
11.1 Chapter Overview
11.2 North America
11.2.1 Trends Analysis
11.2.2 North America Electronic Toll Collection Market Estimates and Forecasts, by Country (2020-2032) (USD Billion)
11.2.3 North America Electronic Toll Collection Market Estimates and Forecasts, by Type (2020-2032) (USD Billion)
11.2.4 North America Electronic Toll Collection Market Estimates and Forecasts, by Offering (2020-2032) (USD Billion)
11.2.5 North America Electronic Toll Collection Market Estimates and Forecasts, by Technology (2020-2032) (USD Billion)
11.2.6 North America Electronic Toll Collection Market Estimates and Forecasts, by Application (2020-2032) (USD Billion)
11.2.7 USA
11.2.7.1 USA Electronic Toll Collection Market Estimates and Forecasts, by Type (2020-2032) (USD Billion)
11.2.7.2 USA Electronic Toll Collection Market Estimates and Forecasts, by Offering (2020-2032) (USD Billion)
11.2.7.3 USA Electronic Toll Collection Market Estimates and Forecasts, by Technology (2020-2032) (USD Billion)
11.2.7.4 USA Electronic Toll Collection Market Estimates and Forecasts, by Application (2020-2032) (USD Billion)
11.2.8 Canada
11.2.8.1 Canada Electronic Toll Collection Market Estimates and Forecasts, by Type (2020-2032) (USD Billion)
11.2.8.2 Canada Electronic Toll Collection Market Estimates and Forecasts, by Offering (2020-2032) (USD Billion)
11.2.8.3 Canada Electronic Toll Collection Market Estimates and Forecasts, by Technology (2020-2032) (USD Billion)
11.2.8.4 Canada Electronic Toll Collection Market Estimates and Forecasts, by Application (2020-2032) (USD Billion)
11.2.9 Mexico
11.2.9.1 Mexico Electronic Toll Collection Market Estimates and Forecasts, by Type (2020-2032) (USD Billion)
11.2.9.2 Mexico Electronic Toll Collection Market Estimates and Forecasts, by Offering (2020-2032) (USD Billion)
11.2.9.3 Mexico Electronic Toll Collection Market Estimates and Forecasts, by Technology (2020-2032) (USD Billion)
11.2.9.4 Mexico Electronic Toll Collection Market Estimates and Forecasts, by Application (2020-2032) (USD Billion)
11.3 Europe
11.3.1 Eastern Europe
11.3.1.1 Trends Analysis
11.3.1.2 Eastern Europe Electronic Toll Collection Market Estimates and Forecasts, by Country (2020-2032) (USD Billion)
11.3.1.3 Eastern Europe Electronic Toll Collection Market Estimates and Forecasts, by Type (2020-2032) (USD Billion)
11.3.1.4 Eastern Europe Electronic Toll Collection Market Estimates and Forecasts, by Offering (2020-2032) (USD Billion)
11.3.1.5 Eastern Europe Electronic Toll Collection Market Estimates and Forecasts, by Technology (2020-2032) (USD Billion)
11.3.1.6 Eastern Europe Electronic Toll Collection Market Estimates and Forecasts, by Application (2020-2032) (USD Billion)
11.3.1.7 Poland
11.3.1.7.1 Poland Electronic Toll Collection Market Estimates and Forecasts, by Type (2020-2032) (USD Billion)
11.3.1.7.2 Poland Electronic Toll Collection Market Estimates and Forecasts, by Offering (2020-2032) (USD Billion)
11.3.1.7.3 Poland Electronic Toll Collection Market Estimates and Forecasts, by Technology (2020-2032) (USD Billion)
11.3.1.7.4 Poland Electronic Toll Collection Market Estimates and Forecasts, by Application (2020-2032) (USD Billion)
11.3.1.8 Romania
11.3.1.8.1 Romania Electronic Toll Collection Market Estimates and Forecasts, by Type (2020-2032) (USD Billion)
11.3.1.8.2 Romania Electronic Toll Collection Market Estimates and Forecasts, by Offering (2020-2032) (USD Billion)
11.3.1.8.3 Romania Electronic Toll Collection Market Estimates and Forecasts, by Technology (2020-2032) (USD Billion)
11.3.1.8.4 Romania Electronic Toll Collection Market Estimates and Forecasts, by Application (2020-2032) (USD Billion)
11.3.1.9 Hungary
11.3.1.9.1 Hungary Electronic Toll Collection Market Estimates and Forecasts, by Type (2020-2032) (USD Billion)
11.3.1.9.2 Hungary Electronic Toll Collection Market Estimates and Forecasts, by Offering (2020-2032) (USD Billion)
11.3.1.9.3 Hungary Electronic Toll Collection Market Estimates and Forecasts, by Technology (2020-2032) (USD Billion)
11.3.1.9.4 Hungary Electronic Toll Collection Market Estimates and Forecasts, by Application (2020-2032) (USD Billion)
11.3.1.10 Turkey
11.3.1.10.1 Turkey Electronic Toll Collection Market Estimates and Forecasts, by Type (2020-2032) (USD Billion)
11.3.1.10.2 Turkey Electronic Toll Collection Market Estimates and Forecasts, by Offering (2020-2032) (USD Billion)
11.3.1.10.3 Turkey Electronic Toll Collection Market Estimates and Forecasts, by Technology (2020-2032) (USD Billion)
11.3.1.10.4 Turkey Electronic Toll Collection Market Estimates and Forecasts, by Application (2020-2032) (USD Billion)
11.3.1.11 Rest of Eastern Europe
11.3.1.11.1 Rest of Eastern Europe Electronic Toll Collection Market Estimates and Forecasts, by Type (2020-2032) (USD Billion)
11.3.1.11.2 Rest of Eastern Europe Electronic Toll Collection Market Estimates and Forecasts, by Offering (2020-2032) (USD Billion)
11.3.1.11.3 Rest of Eastern Europe Electronic Toll Collection Market Estimates and Forecasts, by Technology (2020-2032) (USD Billion)
11.3.1.11.4 Rest of Eastern Europe Electronic Toll Collection Market Estimates and Forecasts, by Application (2020-2032) (USD Billion)
11.3.2 Western Europe
11.3.2.1 Trends Analysis
11.3.2.2 Western Europe Electronic Toll Collection Market Estimates and Forecasts, by Country (2020-2032) (USD Billion)
11.3.2.3 Western Europe Electronic Toll Collection Market Estimates and Forecasts, by Type (2020-2032) (USD Billion)
11.3.2.4 Western Europe Electronic Toll Collection Market Estimates and Forecasts, by Offering (2020-2032) (USD Billion)
11.3.2.5 Western Europe Electronic Toll Collection Market Estimates and Forecasts, by Technology (2020-2032) (USD Billion)
11.3.2.6 Western Europe Electronic Toll Collection Market Estimates and Forecasts, by Application (2020-2032) (USD Billion)
11.3.2.7 Germany
11.3.2.7.1 Germany Electronic Toll Collection Market Estimates and Forecasts, by Type (2020-2032) (USD Billion)
11.3.2.7.2 Germany Electronic Toll Collection Market Estimates and Forecasts, by Offering (2020-2032) (USD Billion)
11.3.2.7.3 Germany Electronic Toll Collection Market Estimates and Forecasts, by Technology (2020-2032) (USD Billion)
11.3.2.7.4 Germany Electronic Toll Collection Market Estimates and Forecasts, by Application (2020-2032) (USD Billion)
11.3.2.8 France
11.3.2.8.1 France Electronic Toll Collection Market Estimates and Forecasts, by Type (2020-2032) (USD Billion)
11.3.2.8.2 France Electronic Toll Collection Market Estimates and Forecasts, by Offering (2020-2032) (USD Billion)
11.3.2.8.3 France Electronic Toll Collection Market Estimates and Forecasts, by Technology (2020-2032) (USD Billion)
11.3.2.8.4 France Electronic Toll Collection Market Estimates and Forecasts, by Application (2020-2032) (USD Billion)
11.3.2.9 UK
11.3.2.9.1 UK Electronic Toll Collection Market Estimates and Forecasts, by Type (2020-2032) (USD Billion)
11.3.2.9.2 UK Electronic Toll Collection Market Estimates and Forecasts, by Offering (2020-2032) (USD Billion)
11.3.2.9.3 UK Electronic Toll Collection Market Estimates and Forecasts, by Technology (2020-2032) (USD Billion)
11.3.2.9.4 UK Electronic Toll Collection Market Estimates and Forecasts, by Application (2020-2032) (USD Billion)
11.3.2.10 Italy
11.3.2.10.1 Italy Electronic Toll Collection Market Estimates and Forecasts, by Type (2020-2032) (USD Billion)
11.3.2.10.2 Italy Electronic Toll Collection Market Estimates and Forecasts, by Offering (2020-2032) (USD Billion)
11.3.2.10.3 Italy Electronic Toll Collection Market Estimates and Forecasts, by Technology (2020-2032) (USD Billion)
11.3.2.10.4 Italy Electronic Toll Collection Market Estimates and Forecasts, by Application (2020-2032) (USD Billion)
11.3.2.11 Spain
11.3.2.11.1 Spain Electronic Toll Collection Market Estimates and Forecasts, by Type (2020-2032) (USD Billion)
11.3.2.11.2 Spain Electronic Toll Collection Market Estimates and Forecasts, by Offering (2020-2032) (USD Billion)
11.3.2.11.3 Spain Electronic Toll Collection Market Estimates and Forecasts, by Technology (2020-2032) (USD Billion)
11.3.2.11.4 Spain Electronic Toll Collection Market Estimates and Forecasts, by Application (2020-2032) (USD Billion)
11.3.2.12 Netherlands
11.3.2.12.1 Netherlands Electronic Toll Collection Market Estimates and Forecasts, by Type (2020-2032) (USD Billion)
11.3.2.12.2 Netherlands Electronic Toll Collection Market Estimates and Forecasts, by Offering (2020-2032) (USD Billion)
11.3.2.12.3 Netherlands Electronic Toll Collection Market Estimates and Forecasts, by Technology (2020-2032) (USD Billion)
11.3.2.12.4 Netherlands Electronic Toll Collection Market Estimates and Forecasts, by Application (2020-2032) (USD Billion)
11.3.2.13 Switzerland
11.3.2.13.1 Switzerland Electronic Toll Collection Market Estimates and Forecasts, by Type (2020-2032) (USD Billion)
11.3.2.13.2 Switzerland Electronic Toll Collection Market Estimates and Forecasts, by Offering (2020-2032) (USD Billion)
11.3.2.13.3 Switzerland Electronic Toll Collection Market Estimates and Forecasts, by Technology (2020-2032) (USD Billion)
11.3.2.13.4 Switzerland Electronic Toll Collection Market Estimates and Forecasts, by Application (2020-2032) (USD Billion)
11.3.2.14 Austria
11.3.2.14.1 Austria Electronic Toll Collection Market Estimates and Forecasts, by Type (2020-2032) (USD Billion)
11.3.2.14.2 Austria Electronic Toll Collection Market Estimates and Forecasts, by Offering (2020-2032) (USD Billion)
11.3.2.14.3 Austria Electronic Toll Collection Market Estimates and Forecasts, by Technology (2020-2032) (USD Billion)
11.3.2.14.4 Austria Electronic Toll Collection Market Estimates and Forecasts, by Application (2020-2032) (USD Billion)
11.3.2.15 Rest of Western Europe
11.3.2.15.1 Rest of Western Europe Electronic Toll Collection Market Estimates and Forecasts, by Type (2020-2032) (USD Billion)
11.3.2.15.2 Rest of Western Europe Electronic Toll Collection Market Estimates and Forecasts, by Offering (2020-2032) (USD Billion)
11.3.2.15.3 Rest of Western Europe Electronic Toll Collection Market Estimates and Forecasts, by Technology (2020-2032) (USD Billion)
11.3.2.15.4 Rest of Western Europe Electronic Toll Collection Market Estimates and Forecasts, by Application (2020-2032) (USD Billion)
11.4 Asia-Pacific
11.4.1 Trends Analysis
11.4.2 Asia-Pacific Electronic Toll Collection Market Estimates and Forecasts, by Country (2020-2032) (USD Billion)
11.4.3 Asia-Pacific Electronic Toll Collection Market Estimates and Forecasts, by Type (2020-2032) (USD Billion)
11.4.4 Asia-Pacific Electronic Toll Collection Market Estimates and Forecasts, by Offering (2020-2032) (USD Billion)
11.4.5 Asia-Pacific Electronic Toll Collection Market Estimates and Forecasts, by Technology (2020-2032) (USD Billion)
11.4.6 Asia-Pacific Electronic Toll Collection Market Estimates and Forecasts, by Application (2020-2032) (USD Billion)
11.4.7 China
11.4.7.1 China Electronic Toll Collection Market Estimates and Forecasts, by Type (2020-2032) (USD Billion)
11.4.7.2 China Electronic Toll Collection Market Estimates and Forecasts, by Offering (2020-2032) (USD Billion)
11.4.7.3 China Electronic Toll Collection Market Estimates and Forecasts, by Technology (2020-2032) (USD Billion)
11.4.7.4 China Electronic Toll Collection Market Estimates and Forecasts, by Application (2020-2032) (USD Billion)
11.4.8 India
11.4.8.1 India Electronic Toll Collection Market Estimates and Forecasts, by Type (2020-2032) (USD Billion)
11.4.8.2 India Electronic Toll Collection Market Estimates and Forecasts, by Offering (2020-2032) (USD Billion)
11.4.8.3 India Electronic Toll Collection Market Estimates and Forecasts, by Technology (2020-2032) (USD Billion)
11.4.8.4 India Electronic Toll Collection Market Estimates and Forecasts, by Application (2020-2032) (USD Billion)
11.4.9 Japan
11.4.9.1 Japan Electronic Toll Collection Market Estimates and Forecasts, by Type (2020-2032) (USD Billion)
11.4.9.2 Japan Electronic Toll Collection Market Estimates and Forecasts, by Offering (2020-2032) (USD Billion)
11.4.9.3 Japan Electronic Toll Collection Market Estimates and Forecasts, by Technology (2020-2032) (USD Billion)
11.4.9.4 Japan Electronic Toll Collection Market Estimates and Forecasts, by Application (2020-2032) (USD Billion)
11.4.10 South Korea
11.4.10.1 South Korea Electronic Toll Collection Market Estimates and Forecasts, by Type (2020-2032) (USD Billion)
11.4.10.2 South Korea Electronic Toll Collection Market Estimates and Forecasts, by Offering (2020-2032) (USD Billion)
11.4.10.3 South Korea Electronic Toll Collection Market Estimates and Forecasts, by Technology (2020-2032) (USD Billion)
11.4.10.4 South Korea Electronic Toll Collection Market Estimates and Forecasts, by Application (2020-2032) (USD Billion)
11.4.11 Vietnam
11.4.11.1 Vietnam Electronic Toll Collection Market Estimates and Forecasts, by Type (2020-2032) (USD Billion)
11.4.11.2 Vietnam Electronic Toll Collection Market Estimates and Forecasts, by Offering (2020-2032) (USD Billion)
11.4.11.3 Vietnam Electronic Toll Collection Market Estimates and Forecasts, by Technology (2020-2032) (USD Billion)
11.4.11.4 Vietnam Electronic Toll Collection Market Estimates and Forecasts, by Application (2020-2032) (USD Billion)
11.4.12 Singapore
11.4.12.1 Singapore Electronic Toll Collection Market Estimates and Forecasts, by Type (2020-2032) (USD Billion)
11.4.12.2 Singapore Electronic Toll Collection Market Estimates and Forecasts, by Offering (2020-2032) (USD Billion)
11.4.12.3 Singapore Electronic Toll Collection Market Estimates and Forecasts, by Technology (2020-2032) (USD Billion)
11.4.12.4 Singapore Electronic Toll Collection Market Estimates and Forecasts, by Application (2020-2032) (USD Billion)
11.4.13 Australia
11.4.13.1 Australia Electronic Toll Collection Market Estimates and Forecasts, by Type (2020-2032) (USD Billion)
11.4.13.2 Australia Electronic Toll Collection Market Estimates and Forecasts, by Offering (2020-2032) (USD Billion)
11.4.13.3 Australia Electronic Toll Collection Market Estimates and Forecasts, by Technology (2020-2032) (USD Billion)
11.4.13.4 Australia Electronic Toll Collection Market Estimates and Forecasts, by Application (2020-2032) (USD Billion)
11.4.14 Rest of Asia-Pacific
11.4.14.1 Rest of Asia-Pacific Electronic Toll Collection Market Estimates and Forecasts, by Type (2020-2032) (USD Billion)
11.4.14.2 Rest of Asia-Pacific Electronic Toll Collection Market Estimates and Forecasts, by Offering (2020-2032) (USD Billion)
11.4.14.3 Rest of Asia-Pacific Electronic Toll Collection Market Estimates and Forecasts, by Technology (2020-2032) (USD Billion)
11.4.14.4 Rest of Asia-Pacific Electronic Toll Collection Market Estimates and Forecasts, by Application (2020-2032) (USD Billion)
11.5 Middle East and Africa
11.5.1 Middle East
11.5.1.1 Trends Analysis
11.5.1.2 Middle East Electronic Toll Collection Market Estimates and Forecasts, by Country (2020-2032) (USD Billion)
11.5.1.3 Middle East Electronic Toll Collection Market Estimates and Forecasts, by Type (2020-2032) (USD Billion)
11.5.1.4 Middle East Electronic Toll Collection Market Estimates and Forecasts, by Offering (2020-2032) (USD Billion)
11.5.1.5 Middle East Electronic Toll Collection Market Estimates and Forecasts, by Technology (2020-2032) (USD Billion)
11.5.1.6 Middle East Electronic Toll Collection Market Estimates and Forecasts, by Application (2020-2032) (USD Billion)
11.5.1.7 UAE
11.5.1.7.1 UAE Electronic Toll Collection Market Estimates and Forecasts, by Type (2020-2032) (USD Billion)
11.5.1.7.2 UAE Electronic Toll Collection Market Estimates and Forecasts, by Offering (2020-2032) (USD Billion)
11.5.1.7.3 UAE Electronic Toll Collection Market Estimates and Forecasts, by Technology (2020-2032) (USD Billion)
11.5.1.7.4 UAE Electronic Toll Collection Market Estimates and Forecasts, by Application (2020-2032) (USD Billion)
11.5.1.8 Egypt
11.5.1.8.1 Egypt Electronic Toll Collection Market Estimates and Forecasts, by Type (2020-2032) (USD Billion)
11.5.1.8.2 Egypt Electronic Toll Collection Market Estimates and Forecasts, by Offering (2020-2032) (USD Billion)
11.5.1.8.3 Egypt Electronic Toll Collection Market Estimates and Forecasts, by Technology (2020-2032) (USD Billion)
11.5.1.8.4 Egypt Electronic Toll Collection Market Estimates and Forecasts, by Application (2020-2032) (USD Billion)
11.5.1.9 Saudi Arabia
11.5.1.9.1 Saudi Arabia Electronic Toll Collection Market Estimates and Forecasts, by Type (2020-2032) (USD Billion)
11.5.1.9.2 Saudi Arabia Electronic Toll Collection Market Estimates and Forecasts, by Offering (2020-2032) (USD Billion)
11.5.1.9.3 Saudi Arabia Electronic Toll Collection Market Estimates and Forecasts, by Technology (2020-2032) (USD Billion)
11.5.1.9.4 Saudi Arabia Electronic Toll Collection Market Estimates and Forecasts, by Application (2020-2032) (USD Billion)
11.5.1.10 Qatar
11.5.1.10.1 Qatar Electronic Toll Collection Market Estimates and Forecasts, by Type (2020-2032) (USD Billion)
11.5.1.10.2 Qatar Electronic Toll Collection Market Estimates and Forecasts, by Offering (2020-2032) (USD Billion)
11.5.1.10.3 Qatar Electronic Toll Collection Market Estimates and Forecasts, by Technology (2020-2032) (USD Billion)
11.5.1.10.4 Qatar Electronic Toll Collection Market Estimates and Forecasts, by Application (2020-2032) (USD Billion)
11.5.1.11 Rest of Middle East
11.5.1.11.1 Rest of Middle East Electronic Toll Collection Market Estimates and Forecasts, by Type (2020-2032) (USD Billion)
11.5.1.11.2 Rest of Middle East Electronic Toll Collection Market Estimates and Forecasts, by Offering (2020-2032) (USD Billion)
11.5.1.11.3 Rest of Middle East Electronic Toll Collection Market Estimates and Forecasts, by Technology (2020-2032) (USD Billion)
11.5.1.11.4 Rest of Middle East Electronic Toll Collection Market Estimates and Forecasts, by Application (2020-2032) (USD Billion)
11.5.2 Africa
11.5.2.1 Trends Analysis
11.5.2.2 Africa Electronic Toll Collection Market Estimates and Forecasts, by Country (2020-2032) (USD Billion)
11.5.2.3 Africa Electronic Toll Collection Market Estimates and Forecasts, by Type (2020-2032) (USD Billion)
11.5.2.4 Africa Electronic Toll Collection Market Estimates and Forecasts, by Offering (2020-2032) (USD Billion)
11.5.2.5 Africa Electronic Toll Collection Market Estimates and Forecasts, by Technology (2020-2032) (USD Billion)
11.5.2.6 Africa Electronic Toll Collection Market Estimates and Forecasts, by Application (2020-2032) (USD Billion)
11.5.2.7 South Africa
11.5.2.7.1 South Africa Electronic Toll Collection Market Estimates and Forecasts, by Type (2020-2032) (USD Billion)
11.5.2.7.2 South Africa Electronic Toll Collection Market Estimates and Forecasts, by Offering (2020-2032) (USD Billion)
11.5.2.7.3 South Africa Electronic Toll Collection Market Estimates and Forecasts, by Technology (2020-2032) (USD Billion)
11.5.2.7.4 South Africa Electronic Toll Collection Market Estimates and Forecasts, by Application (2020-2032) (USD Billion)
11.5.2.8 Nigeria
11.5.2.8.1 Nigeria Electronic Toll Collection Market Estimates and Forecasts, by Type (2020-2032) (USD Billion)
11.5.2.8.2 Nigeria Electronic Toll Collection Market Estimates and Forecasts, by Offering (2020-2032) (USD Billion)
11.5.2.8.3 Nigeria Electronic Toll Collection Market Estimates and Forecasts, by Technology (2020-2032) (USD Billion)
11.5.2.8.4 Nigeria Electronic Toll Collection Market Estimates and Forecasts, by Application (2020-2032) (USD Billion)
11.5.2.9 Rest of Africa
11.5.2.9.1 Rest of Africa Electronic Toll Collection Market Estimates and Forecasts, by Type (2020-2032) (USD Billion)
11.5.2.9.2 Rest of Africa Electronic Toll Collection Market Estimates and Forecasts, by Offering (2020-2032) (USD Billion)
11.5.2.9.3 Rest of Africa Electronic Toll Collection Market Estimates and Forecasts, by Technology (2020-2032) (USD Billion)
11.5.2.9.4 Rest of Africa Electronic Toll Collection Market Estimates and Forecasts, by Application (2020-2032) (USD Billion)
11.6 Latin America
11.6.1 Trends Analysis
11.6.2 Latin America Electronic Toll Collection Market Estimates and Forecasts, by Country (2020-2032) (USD Billion)
11.6.3 Latin America Electronic Toll Collection Market Estimates and Forecasts, by Type (2020-2032) (USD Billion)
11.6.4 Latin America Electronic Toll Collection Market Estimates and Forecasts, by Offering (2020-2032) (USD Billion)
11.6.5 Latin America Electronic Toll Collection Market Estimates and Forecasts, by Technology (2020-2032) (USD Billion)
11.6.6 Latin America Electronic Toll Collection Market Estimates and Forecasts, by Application (2020-2032) (USD Billion)
11.6.7 Brazil
11.6.7.1 Brazil Electronic Toll Collection Market Estimates and Forecasts, by Type (2020-2032) (USD Billion)
11.6.7.2 Brazil Electronic Toll Collection Market Estimates and Forecasts, by Offering (2020-2032) (USD Billion)
11.6.7.3 Brazil Electronic Toll Collection Market Estimates and Forecasts, by Technology (2020-2032) (USD Billion)
11.6.7.4 Brazil Electronic Toll Collection Market Estimates and Forecasts, by Application (2020-2032) (USD Billion)
11.6.8 Argentina
11.6.8.1 Argentina Electronic Toll Collection Market Estimates and Forecasts, by Type (2020-2032) (USD Billion)
11.6.8.2 Argentina Electronic Toll Collection Market Estimates and Forecasts, by Offering (2020-2032) (USD Billion)
11.6.8.3 Argentina Electronic Toll Collection Market Estimates and Forecasts, by Technology (2020-2032) (USD Billion)
11.6.8.4 Argentina Electronic Toll Collection Market Estimates and Forecasts, by Application (2020-2032) (USD Billion)
11.6.9 Colombia
11.6.9.1 Colombia Electronic Toll Collection Market Estimates and Forecasts, by Type (2020-2032) (USD Billion)
11.6.9.2 Colombia Electronic Toll Collection Market Estimates and Forecasts, by Offering (2020-2032) (USD Billion)
11.6.9.3 Colombia Electronic Toll Collection Market Estimates and Forecasts, by Technology (2020-2032) (USD Billion)
11.6.9.4 Colombia Electronic Toll Collection Market Estimates and Forecasts, by Application (2020-2032) (USD Billion)
11.6.10 Rest of Latin America
11.6.10.1 Rest of Latin America Electronic Toll Collection Market Estimates and Forecasts, by Type (2020-2032) (USD Billion)
11.6.10.2 Rest of Latin America Electronic Toll Collection Market Estimates and Forecasts, by Offering (2020-2032) (USD Billion)
11.6.10.3 Rest of Latin America Electronic Toll Collection Market Estimates and Forecasts, by Technology (2020-2032) (USD Billion)
11.6.10.4 Rest of Latin America Electronic Toll Collection Market Estimates and Forecasts, by Application (2020-2032) (USD Billion)
12. Company Profiles
12.1 Kapsch TrafficCom AG
12.1.1 Company Overview
12.1.2 Financial
12.1.3 Products/ Services Offered
12.1.4 SWOT Analysis
12.2 Conduent Business Services
12.2.1 Company Overview
12.2.2 Financial
12.2.3 Products/ Services Offered
12.2.4 SWOT Analysis
12.3 EFKON GmbH
12.3.1 Company Overview
12.3.2 Financial
12.3.3 Products/ Services Offered
12.3.4 SWOT Analysis
12.4 TransCore Holdings, Inc.
12.4.1 Company Overview
12.4.2 Financial
12.4.3 Products/ Services Offered
12.4.4 SWOT Analysis
12.5 Thales Group
12.5.1 Company Overview
12.5.2 Financial
12.5.3 Products/ Services Offered
12.5.4 SWOT Analysis
12.6 Raytheon Technologies Corporation
12.6.1 Company Overview
12.6.2 Financial
12.6.3 Products/ Services Offered
12.6.4 SWOT Analysis
12.7 Cubic Corporation
12.7.1 Company Overview
12.7.2 Financial
12.7.3 Products/ Services Offered
12.7.4 SWOT Analysis
12.8 Siemens
12.8.1 Company Overview
12.8.2 Financial
12.8.3 Products/ Services Offered
12.8.4 SWOT Analysis
12.9 Neology, Inc.
12.9.1 Company Overview
12.9.2 Financial
12.9.3 Products/ Services Offered
12.9.4 SWOT Analysis
12.10 VINCI
12.10.1 Company Overview
12.10.2 Financial
12.10.3 Products/ Services Offered
12.10.4 SWOT Analysis
13. Use Cases and Best Practices
14. Conclusion
An accurate research report requires proper strategizing as well as implementation. There are multiple factors involved in the completion of good and accurate research report and selecting the best methodology to compete the research is the toughest part. Since the research reports we provide play a crucial role in any company’s decision-making process, therefore we at SNS Insider always believe that we should choose the best method which gives us results closer to reality. This allows us to reach at a stage wherein we can provide our clients best and accurate investment to output ratio.
Each report that we prepare takes a timeframe of 350-400 business hours for production. Starting from the selection of titles through a couple of in-depth brain storming session to the final QC process before uploading our titles on our website we dedicate around 350 working hours. The titles are selected based on their current market cap and the foreseen CAGR and growth.
The 5 steps process:
Step 1: Secondary Research:
Secondary Research or Desk Research is as the name suggests is a research process wherein, we collect data through the readily available information. In this process we use various paid and unpaid databases which our team has access to and gather data through the same. This includes examining of listed companies’ annual reports, Journals, SEC filling etc. Apart from this our team has access to various associations across the globe across different industries. Lastly, we have exchange relationships with various university as well as individual libraries.

Step 2: Primary Research
When we talk about primary research, it is a type of study in which the researchers collect relevant data samples directly, rather than relying on previously collected data. This type of research is focused on gaining content specific facts that can be sued to solve specific problems. Since the collected data is fresh and first hand therefore it makes the study more accurate and genuine.
We at SNS Insider have divided Primary Research into 2 parts.
Part 1 wherein we interview the KOLs of major players as well as the upcoming ones across various geographic regions. This allows us to have their view over the market scenario and acts as an important tool to come closer to the accurate market numbers. As many as 45 paid and unpaid primary interviews are taken from both the demand and supply side of the industry to make sure we land at an accurate judgement and analysis of the market.
This step involves the triangulation of data wherein our team analyses the interview transcripts, online survey responses and observation of on filed participants. The below mentioned chart should give a better understanding of the part 1 of the primary interview.

Part 2: In this part of primary research the data collected via secondary research and the part 1 of the primary research is validated with the interviews from individual consultants and subject matter experts.
Consultants are those set of people who have at least 12 years of experience and expertise within the industry whereas Subject Matter Experts are those with at least 15 years of experience behind their back within the same space. The data with the help of two main processes i.e., FGDs (Focused Group Discussions) and IDs (Individual Discussions). This gives us a 3rd party nonbiased primary view of the market scenario making it a more dependable one while collation of the data pointers.
Step 3: Data Bank Validation
Once all the information is collected via primary and secondary sources, we run that information for data validation. At our intelligence centre our research heads track a lot of information related to the market which includes the quarterly reports, the daily stock prices, and other relevant information. Our data bank server gets updated every fortnight and that is how the information which we collected using our primary and secondary information is revalidated in real time.

Step 4: QA/QC Process
After all the data collection and validation our team does a final level of quality check and quality assurance to get rid of any unwanted or undesired mistakes. This might include but not limited to getting rid of the any typos, duplication of numbers or missing of any important information. The people involved in this process include technical content writers, research heads and graphics people. Once this process is completed the title gets uploader on our platform for our clients to read it.
Step 5: Final QC/QA Process:
This is the last process and comes when the client has ordered the study. In this process a final QA/QC is done before the study is emailed to the client. Since we believe in giving our clients a good experience of our research studies, therefore, to make sure that we do not lack at our end in any way humanly possible we do a final round of quality check and then dispatch the study to the client.
By Type
Transponder-/Tag-based Tolling Systems
Other Tolling Systems
By Offering
Hardware
Back-office and Other Services
By Technology
RFID
DSRC
Others
By Application
Highways
Urban Areas
Request for Segment Customization as per your Business Requirement: Segment Customization Request
REGIONAL COVERAGE:
North America
US
Canada
Mexico
Europe
Eastern Europe
Poland
Romania
Hungary
Turkey
Rest of Eastern Europe
Western Europe
Germany
France
UK
Italy
Spain
Netherlands
Switzerland
Austria
Rest of Western Europe
Asia-Pacific
China
India
Japan
South Korea
Vietnam
Singapore
Australia
Rest of Asia Pacific
Middle East & Africa
Middle East
UAE
Egypt
Saudi Arabia
Qatar
Rest of the Middle East
Africa
Nigeria
South Africa
Rest of Africa
Latin America
Brazil
Argentina
Colombia
Rest of Latin America
Request for Country Level Research Report: Country Level Customization Request
Available Customization
With the given market data, SNS Insider offers customization as per the company’s specific needs. The following customization options are available for the report:
Product Analysis
Criss-Cross segment analysis (e.g. Product X Application)
Product Matrix which gives a detailed comparison of the product portfolio of each company
Geographic Analysis
Additional countries in any of the regions
Company Information
Detailed analysis and profiling of additional market players (Up to five)
The Battery-free Sensors Market Size was valued at USD 41.46 Million in 2023 and is expected to grow at a CAGR of 25.21% to reach USD 313.64 Million by 2032
The Active Optical Cable Market size was valued at USD 3.29 billion in 2023 and is expected to grow at a CAGR of 12.15% to reach USD 9.23 billion by 2032.
The Dark Fiber Market Size was valued at USD 6.19 Billion in 2023 and is expected to grow at a CAGR of 12.67% to reach USD 18.10 Billion by 2032.
The Automatic Ticket Machine Market Size was valued at USD 13.19 Billion in 2023 and is expected to grow at 13.11% CAGR to reach USD 39.91 Billion by 2032.
The Thyristor Rectifier Electric Locomotive Market was valued at USD 0.91 billion in 2023 and is expected to reach USD 1.48 billion by 2032, growing at a CAGR of 5.59% over the forecast period 2024-2032.
The Microprocessor Market Size was valued at USD 62.67 Billion in 2023 and is expected to grow at a CAGR of 8.20% to reach USD 126.91 Billion by 2032.

Hi! Click one of our member below to chat on Phone
© 2025 All Rights Reserved by SNS Insider Pvt Ltd


