image

Electronic Health Record (EHR) Apps Market Size & Overview:

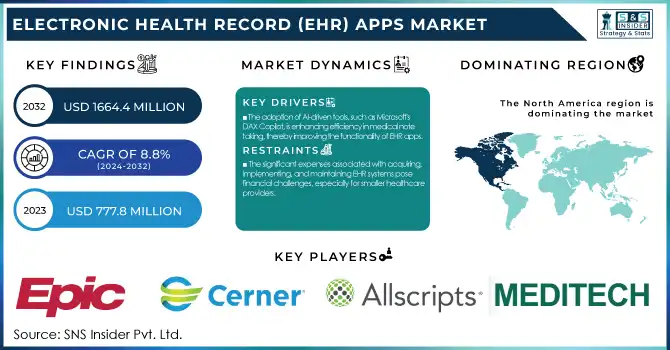
The Electronic Health Record (EHR) Apps Market was valued at USD 777.8 Million in 2023 and is expected to reach USD 1664.4 million by 2032, growing at a CAGR of 8.8% over the forecast period 2024-2032.

Electronic Health Record (EHR) Apps Market Revenue Analysis

To Get more information on Electronic Health Record (EHR) Apps Market- Request Free Sample Report

This report provides key statistics and trends in the Electronic Health Record (EHR) Apps Market, including adoption rates, user demographics, and deployment preferences, are provided in this report. It underscores the growing trend toward cloud-based EHR solutions, along with an in-depth cost analysis of implementation by region. The report explores integration capabilities with telehealth and pharmacy systems and highlights interoperability challenges and trends in regulatory compliance for HIPAA and GDPR. It also looks at how the role of healthcare professionals is evolving as EHR apps are utilized and the effect of government policies on usage rates. Such industry trends provide a holistic view of the overall market landscape and will help the stakeholders make strategic decisions regarding the technological disruptions, funding sources, and projected regulations that are likely to rewrite the EHR app market. Rising government initiatives to excel the innovations in digital health solutions are propelling the growth of global Electronic Health Record (EHR) Apps market.

Electronic Health Record (EHR) Apps Market Dynamics

Drivers

  • The adoption of AI-driven tools, such as Microsoft's DAX Copilot, is enhancing efficiency in medical note-taking, thereby improving the functionality of EHR apps.

Applications of Artificial Intelligence (AI) in Electronic Health Record (EHR) systems are fully automating the note-taking process in medical documentation, resulting in time-saving and effective work processes in healthcare organizations. In 2024, investments in AI-driven medical note-taking applications reached $800 million, a substantial increase from $390 million in 2023. A well-known example is Microsoft’s Nuance DAX Copilot, which already records more than 1.3 million patient encounters a month. The approach has been piloted successfully at Stanford Medical School and is now being used more widely following positive results. Startups are also making significant contributions. One of them, Abridge, is an AI medical scribe app, creating what it refers to as contracts with around 50,000 clinicians, including with large name partners like Kaiser Permanente. The platform records and transcribes doctor-patient interactions, creating summaries for both parties. Clinicians have reported a 40% reduction in time spent on administrative tasks, allowing more focus on patient care.

Similarly, Nabla's application, utilizing OpenAI's Whisper technology, has demonstrated significant time savings during medical consultations. The use of AI in medical documentation poses some challenges. A few studies have detected a small but substantial percentage of inaccurate or outright false information in AI-generated transcripts, which almost certainly has implications for the accuracy of these tools. Overall, when looking at all of these issues combined, the benefits clearly outweigh the negatives. Easier administrative load has encouraged reduced stress and better patient interactions for many clinicians. To illustrate, AI based voice assistants have reduced documentation hours from 10-20 hours a week to only 15 minutes per day.

Restraints:

  • The significant expenses associated with acquiring, implementing, and maintaining EHR systems pose financial challenges, especially for smaller healthcare providers.

The costs of implementing Electronic Health Record (EHR) systems can weigh heavily on healthcare providers, especially those in smaller practices. The costs encompass software acquisition, hardware investments, training, and ongoing maintenance. For example, small solo practices can pay from $74 to $729 monthly per user depending on the software applications, with the average being around $250 per user annually. Larger healthcare organizations, on the other hand, carry much higher prices; self-hosted EHR systems can cost well over $500,000 per year, and the average cost to implement one for a multi-physician practice is roughly $162,000. These cost demands can discourage smaller practices from adopting EHR systems and further the technology gap between large and small providers. Also, the cost is not just for the initial setup. This includes the cost of software updates, system maintenance, and employee training, all of which are ongoing expenses that could add up over time. The Cambridge University Hospitals NHS Foundation Trust spent £200 million over ten years on the installation of an EHR system indicating the long-term financial concern available. Moreover, the complex nature of EHR systems may result in operational perturbations during the transition phase. In some cases, inadequate planning and implementation have resulted in increased software errors and reduced efficiency, as observed in the Nanaimo Regional General Hospital in British Columbia.

Opportunities:

  • Various government programs and incentives are encouraging healthcare providers to implement EHR systems, thereby expanding the market.

Many opportunities for the healthcare sector emerge from government initiatives that are increasingly accelerating the uptake of Electronic Health Record (EHR) systems. The My Health Record system has made impressive gains in Australia, with over 24.1 million Australians signed up as of late 2024, and 99% of those records contain crucial health data. In 2022 alone, there were over 118.2 million telehealth services enabled through this digital integration, highlighting a significant move towards tech-enabled, patient-centric care.

In the United States, the Department of Health and Human Services released the 2024-2030 Federal Health IT Strategic Plan in September 2024. This ambitious roadmap seeks to improve health experiences and health outcomes for all, through health equity, scientific advances, and modernization of public health infrastructure. Secure data handling according to the different use cases of all the health IT users is an important part of the plan. From better access to potentially life-saving devices to automation that enables healthcare professionals to focus on what matters, these initiatives are not just setting the gold standard for first-in-patient care, they are also laying the ground for the next wave of technological evolution in healthcare, leading to improved patient outcomes and better data management. Government policy and multi-million-dollar investments around the world highlight the importance of EHR systems in the future of healthcare.

Challenges:

  • The increasing digitization of patient records raises significant concerns about data breaches and the protection of sensitive health information.

Challenges in the Electronic Health Record (EHR) Apps Market include data privacy and security. In 2024, the U.S. healthcare industry suffered from 720 reported data breaches, affecting roughly 186 million user records. For example, a ransomware attack on Change Healthcare exposed the data of an estimated 100 million, exemplifying the potential risk of EHRs to cyber threats. These breaches typically include unauthorized access to sensitive patient data including medical records, Social Security numbers, and insurance information. The healthcare industry continues to be an easy and consistent target for cybercriminals because of the high value of medical data on the black market. In 2024, 84% of healthcare organizations reported experiencing a cyberattack, with 69% suffering financial damages as a result. These breaches carry a significant financial cost, resulting in higher operational expenses, legal repercussions, and damage to reputation. For instance, UnitedHealth Group faced a ransomware attack that compromised the data of over 100 million individuals, resulting in a $22 million ransom payment. Additionally, regulatory bodies are imposing stricter cybersecurity requirements, further increasing the compliance burden on healthcare providers.

Segmentation Insights

By Type

In 2023, the Android segment held the largest revenue share, accounting for 84% of the total market. Factors such as the adoption of Android devices in healthcare, the platform's open-source nature, and the flexibility and better integration with existing healthcare systems have contributed to this sizable market share. This fact is otherwise verified by government stats to prove Android is the dominating platform of EHR apps. HHS claims that 78% of healthcare facilities are using mobile devices to access clinical information, and the Android platform is not only cheap and versatile but also the most preferred because of the numerous Android apps for healthcare providers that specifically address patients' needs. According to the National Institutes of Health (NIH), healthcare professionals have adopted Android-based health apps 35% more than other platforms.

In fact, Android-based EHR apps have been reported by the Centers for Disease Control and Prevention (CDC) to improve the timely recording of patient data by 22%, resulting in better care coordination and greater improvements in patient outcomes. The Office of the National Coordinator for Health Information Technology (ONC) also pointed out that the number of healthcare apps on Android has been growing 15% faster than other platforms, with market share up significantly since 2020.

By Application

In 2023, the administrative segment held the dominant revenue share of 33%. The large share of this segment can be attributed to the rising need for seamless administrative operations in healthcare facilities and the increasing focus on limiting operational costs. Administrative applications make up a significant portion of EHR systems, as evidenced by government statistics. CMS reported that healthcare providers using administrative EHR apps have seen 28% less paperwork and a 35% improvement in the billing accuracy of healthcare claims. The Agency for Healthcare Research and Quality (AHRQ) determined that administrative Electronic health record (EHR) applications have resulted in a 40% reduction in claim denials and a 25% decrease in administrative workload. Additionally, the U.S. Government Accountability Office (GAO) reported that the use of administrative EHR apps in healthcare facilities increased revenue cycle billing efficiency by 20% and reduced operational costs by 15%. Observing that administrative EHR apps have already led to 30% better patient scheduling and 25% fewer no-shows, the Office of the National Coordinator for Health Information Technology (ONC) said.

By End Use

In 2023, the hospital segment held the highest revenue share of 54%. This substantial market share is driven by the complexity of hospital systems and their requirement for advanced EHR solutions capable of handling high volumes of patient data and patients across numerous departments. Importance of EHR Apps in Hospital Settings Government statistics on hospitals emphasize the importance of EHR apps. According to the CDC, overall errors in healthcare systems have been reduced by 15% in hospitals using comprehensive EHR systems with patient outcome measures improving by 20%. According to the Agency for Healthcare Research and Quality (AHRQ), EHR adoption in hospitals has resulted in a 25% drop in duplicate tests and a 30% increase in care coordination.

The U.S. HHS also stated that hospitals employing advanced EHR systems have experienced a 22% improvement in physician productivity and an 18% reduction in mean length of stay. The National Institutes of Health (NIH) reported that EHRs are responsible for a 35% improvement in clinical decision support and a 28% improvement in adherence to evidence-based guidelines in hospitals.

Electronic Health Record (EHR) Apps Market Regional Analysis

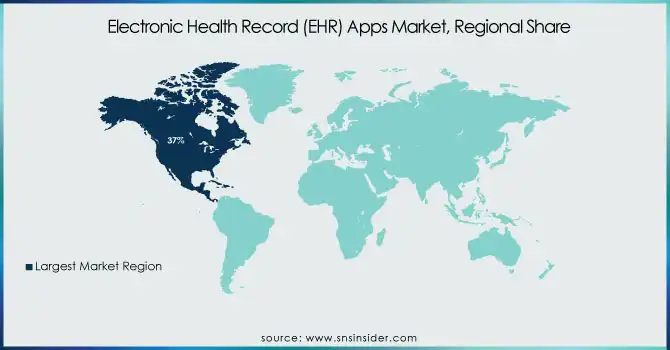
In 2023, North America held the largest revenues share 37% of the Electronic Health Record Apps Market. The region's advanced healthcare infrastructure, high levels of adoption of digital health technologies, and supportive government initiatives all contribute to this leadership position. According to the U.S. Department of Health and Human Services, 96 percent of U.S. hospitals and 78 percent of office-based physicians have adopted certified EHR technology. On the other hand, the EHR apps market in the Asia Pacific region is growing at the highest CAGR. This growing trend can be attributed to increasing government investments in healthcare IT infrastructure, rising awareness about digital health solutions, and a high patient population. For example, the Indian government is implementing the National Digital Health Mission to build a complete ecosystem of digital health and we expect this plan to greatly accelerate EHR adoption in the country. Especially China witnessing incredible growth in the segment. This characteristic of EHRs led to the national policy of EHR promulgated in China, and as a result, according to the National Health Commission of China, by 2023, more than 80% of public hospitals have established EHR systems. This trend will only be accelerated further with the Chinese government's Internet Plus Healthcare initiative, which is driving more and more providers in the country to adopt digital health solutions such as EHR apps.

Electronic-Health-Record-EHR-Apps-Market-Regional-Share

Get Customized Report as per Your Business Requirement - Enquiry Now

Key Players

Key Service Providers/Manufacturers

  • Epic Systems Corporation (EpicCare Ambulatory, MyChart)

  • Cerner Corporation (now Oracle Health) (Cerner Millennium, PowerChart)

  • Allscripts Healthcare Solutions (now Veradigm Inc.) (Sunrise EHR, TouchWorks EHR)

  • MEDITECH (Expanse EHR, MEDITECH as a Service)

  • NextGen Healthcare (NextGen Office, NextGen Enterprise)

  • eClinicalWorks (eClinicalWorks EHR, Healow)

  • Athenahealth (AthenaClinicals, AthenaOne)

  • Greenway Health (Intergy, Prime Suite)

  • Practice Fusion (Practice Fusion EHR, Patient Fusion)

  • Kareo (now part of Tebra) (Kareo Clinical, Kareo Billing)

  • GE Healthcare (Centricity EMR, Centricity Practice Solution)

  • McKesson Corporation (Paragon, Horizon Clinicals)

  • Siemens Healthineers (Soarian Clinicals, Syngo)

  • Philips Healthcare (Tasy EMR, IntelliSpace)

  • IBM Watson Health (Merge EHR, Watson Health EHR)

  • Amazing Charts (Amazing Charts EHR, CareTracker PM)

  • DrChrono (DrChrono EHR, OnPatient)

  • AdvancedMD (AdvancedEHR, AdvancedPM)

  • CareCloud (CareCloud Charts, CareCloud Central)

  • Wellsoft Corporation (Wellsoft EDIS, Wellsoft EHR)

Recent Developments

  • In November 2024, the Cerner Corporation introduced a new, cloud-based EHR platform that reportedly features enhanced interoperability and improved data analytics functionalities.

  • In March 2024, Allscripts Healthcare Solutions launched a new mobile EHR app for small and medium-sized healthcare practices to drive EHR adoption in this underserved market segment.

Electronic Health Record (EHR) Apps Market Report Scope

Report Attributes Details
Market Size in 2023 USD 777.8 Million 
Market Size by 2032 USD 1664.4 Million 
CAGR CAGR of 8.8% From 2024 to 2032
Base Year 2023
Forecast Period 2024-2032
Historical Data 2020-2022
Report Scope & Coverage Market Size, Segments Analysis, Competitive Landscape, Regional Analysis, DROC & SWOT Analysis, Forecast Outlook
Key Segments • By Type (Android, iOS)
• By Application (Administrative, Clinical, e-prescribing, Others)
• By End-use (Hospitals, Ambulatory Care Centers, Others)
Regional Analysis/Coverage North America (US, Canada, Mexico), Europe (Eastern Europe [Poland, Romania, Hungary, Turkey, Rest of Eastern Europe] Western Europe] Germany, France, UK, Italy, Spain, Netherlands, Switzerland, Austria, Rest of Western Europe]), Asia Pacific (China, India, Japan, South Korea, Vietnam, Singapore, Australia, Rest of Asia Pacific), Middle East & Africa (Middle East [UAE, Egypt, Saudi Arabia, Qatar, Rest of Middle East], Africa [Nigeria, South Africa, Rest of Africa], Latin America (Brazil, Argentina, Colombia, Rest of Latin America)
Company Profiles Epic Systems Corporation, Cerner Corporation (now Oracle Health), Allscripts Healthcare Solutions (now Veradigm Inc.), MEDITECH, NextGen Healthcare, eClinicalWorks, Athenahealth, Greenway Health, Practice Fusion, Kareo (now part of Tebra), GE Healthcare, McKesson Corporation, Siemens Healthineers, Philips Healthcare, IBM Watson Health, Amazing Charts, DrChrono, AdvancedMD, CareCloud, Wellsoft Corporation

Frequently Asked Questions

Ans. The projected market size for the Electronic Health Record (EHR) Apps Market is USD 1664.4 Million by 2032.

Ans: The North American region dominated the Electronic Health Record (EHR) Apps Market in 2023.

Ans. The CAGR of the Electronic Health Record (EHR) Apps Market is 8.8% During the forecast period of 2024-2032.

Ans:

  • The increasing digitization of patient records raises significant concerns about data breaches and the protection of sensitive health information.

Ans:  The hospital end-use segment dominated the Electronic Health Record (EHR) Apps Market.

Table of Contents:

1. Introduction

1.1 Market Definition

1.2 Scope (Inclusion and Exclusions)

1.3 Research Assumptions

2. Executive Summary

2.1 Market Overview

2.2 Regional Synopsis

2.3 Competitive Summary

3. Research Methodology

3.1 Top-Down Approach

3.2 Bottom-up Approach

3.3. Data Validation

3.4 Primary Interviews

4. Market Dynamics Impact Analysis

4.1 Market Driving Factors Analysis

4.1.1 Drivers

4.1.2 Restraints

4.1.3 Opportunities

4.1.4 Challenges

4.2 PESTLE Analysis

4.3 Porter’s Five Forces Model

5. Statistical Insights and Trends Reporting

5.1 Global EHR Adoption Rate and User Demographics (2023)

5.2 Average Cost of EHR Implementation (2023)

5.3 Integration and Interoperability Rates (2023)

5.4 Regulatory Compliance Trends (2023)

6. Competitive Landscape

6.1 List of Major Companies, By Region

6.2 Market Share Analysis, By Region

6.3 Product Benchmarking

6.3.1 Product specifications and features

6.3.2 Pricing

6.4 Strategic Initiatives

6.4.1 Marketing and promotional activities

6.4.2 Distribution and Supply Chain Strategies

6.4.3 Expansion plans and new product launches

6.4.4 Strategic partnerships and collaborations

6.5 Technological Advancements

6.6 Market Positioning and Branding

7. Electronic Health Record (EHR) Apps Market Segmentation, By Type

7.1 Chapter Overview

7.2 Android

7.2.1 Android Market Trends Analysis (2020-2032)

7.2.2 Android Market Size Estimates and Forecasts to 2032 (USD Million)

7.3 IOS

7.3.1 IOS Market Trends Analysis (2020-2032)

7.3.2 IOS Market Size Estimates and Forecasts to 2032 (USD Million)

8. Electronic Health Record (EHR) Apps Market Segmentation, By Application

8.1 Chapter Overview

8.2 Administrative

8.2.1 Administrative Market Trends Analysis (2020-2032)

8.2.2 Administrative Market Size Estimates and Forecasts to 2032 (USD Million)

8.3 Clinical

8.3.1 Clinical Market Trends Analysis (2020-2032)

8.3.2 Clinical Market Size Estimates and Forecasts to 2032 (USD Million)

8.4 E-Prescribing

8.4.1 E-Prescribing Market Trends Analysis (2020-2032)

8.4.2 E-Prescribing Market Size Estimates and Forecasts to 2032 (USD Million)

8.5 Others

8.5.1 Others Market Trends Analysis (2020-2032)

8.5.2 Others Market Size Estimates and Forecasts to 2032 (USD Million)

9. Electronic Health Record (EHR) Apps Market Segmentation, By End-Use

9.1 Chapter Overview

9.2 Hospitals

9.2.1 Hospitals Market Trends Analysis (2020-2032)

9.2.2 Hospitals Market Size Estimates and Forecasts to 2032 (USD Million)

9.3 Ambulatory Care Centers

9.3.1 Ambulatory Care Centers Market Trends Analysis (2020-2032)

9.3.2 Ambulatory Care Centers Market Size Estimates and Forecasts to 2032 (USD Million)

9.4 Others

9.4.1 Others Market Trends Analysis (2020-2032)

9.4.2 Others Market Size Estimates and Forecasts to 2032 (USD Million)

10. Regional Analysis

10.1 Chapter Overview

10.2 North America

10.2.1 Trends Analysis

10.2.2 North America Electronic Health Record (EHR) Apps Market Estimates and Forecasts, by Country (2020-2032) (USD Million)

10.2.3 North America Electronic Health Record (EHR) Apps Market Estimates and Forecasts, By Type (2020-2032) (USD Million) 

10.2.4 North America Electronic Health Record (EHR) Apps Market Estimates and Forecasts, By Application (2020-2032) (USD Million)

10.2.5 North America Electronic Health Record (EHR) Apps Market Estimates and Forecasts, By End-Use (2020-2032) (USD Million)

10.2.6 USA

10.2.6.1 USA Electronic Health Record (EHR) Apps Market Estimates and Forecasts, By Type (2020-2032) (USD Million)

10.2.6.2 USA Electronic Health Record (EHR) Apps Market Estimates and Forecasts, By Application (2020-2032) (USD Million)

10.2.6.3 USA Electronic Health Record (EHR) Apps Market Estimates and Forecasts, By End-Use (2020-2032) (USD Million)

10.2.7 Canada

10.2.7.1 Canada Electronic Health Record (EHR) Apps Market Estimates and Forecasts, By Type (2020-2032) (USD Million)

10.2.7.2 Canada Electronic Health Record (EHR) Apps Market Estimates and Forecasts, By Application (2020-2032) (USD Million)

10.2.7.3 Canada Electronic Health Record (EHR) Apps Market Estimates and Forecasts, By End-Use (2020-2032) (USD Million)

10.2.8 Mexico

10.2.8.1 Mexico Electronic Health Record (EHR) Apps Market Estimates and Forecasts, By Type (2020-2032) (USD Million)

10.2.8.2 Mexico Electronic Health Record (EHR) Apps Market Estimates and Forecasts, By Application (2020-2032) (USD Million)

10.2.8.3 Mexico Electronic Health Record (EHR) Apps Market Estimates and Forecasts, By End-Use (2020-2032) (USD Million)

10.3 Europe

10.3.1 Eastern Europe

10.3.1.1 Trends Analysis

10.3.1.2 Eastern Europe Electronic Health Record (EHR) Apps Market Estimates and Forecasts, by Country (2020-2032) (USD Million)

10.3.1.3 Eastern Europe Electronic Health Record (EHR) Apps Market Estimates and Forecasts, By Type (2020-2032) (USD Million) 

10.3.1.4 Eastern Europe Electronic Health Record (EHR) Apps Market Estimates and Forecasts, By Application (2020-2032) (USD Million)

10.3.1.5 Eastern Europe Electronic Health Record (EHR) Apps Market Estimates and Forecasts, By End-Use (2020-2032) (USD Million)

10.3.1.6 Poland

10.3.1.6.1 Poland Electronic Health Record (EHR) Apps Market Estimates and Forecasts, By Type (2020-2032) (USD Million)

10.3.1.6.2 Poland Electronic Health Record (EHR) Apps Market Estimates and Forecasts, By Application (2020-2032) (USD Million)

10.3.1.6.3 Poland Electronic Health Record (EHR) Apps Market Estimates and Forecasts, By End-Use (2020-2032) (USD Million)

10.3.1.7 Romania

10.3.1.7.1 Romania Electronic Health Record (EHR) Apps Market Estimates and Forecasts, By Type (2020-2032) (USD Million)

10.3.1.7.2 Romania Electronic Health Record (EHR) Apps Market Estimates and Forecasts, By Application (2020-2032) (USD Million)

10.3.1.7.3 Romania Electronic Health Record (EHR) Apps Market Estimates and Forecasts, By End-Use (2020-2032) (USD Million)

10.3.1.8 Hungary

10.3.1.8.1 Hungary Electronic Health Record (EHR) Apps Market Estimates and Forecasts, By Type (2020-2032) (USD Million)

10.3.1.8.2 Hungary Electronic Health Record (EHR) Apps Market Estimates and Forecasts, By Application (2020-2032) (USD Million)

10.3.1.8.3 Hungary Electronic Health Record (EHR) Apps Market Estimates and Forecasts, By End-Use (2020-2032) (USD Million)

10.3.1.9 Turkey

10.3.1.9.1 Turkey Electronic Health Record (EHR) Apps Market Estimates and Forecasts, By Type (2020-2032) (USD Million)

10.3.1.9.2 Turkey Electronic Health Record (EHR) Apps Market Estimates and Forecasts, By Application (2020-2032) (USD Million)

10.3.1.9.3 Turkey Electronic Health Record (EHR) Apps Market Estimates and Forecasts, By End-Use (2020-2032) (USD Million)

10.3.1.10 Rest of Eastern Europe

10.3.1.10.1 Rest of Eastern Europe Electronic Health Record (EHR) Apps Market Estimates and Forecasts, By Type (2020-2032) (USD Million)

10.3.1.10.2 Rest of Eastern Europe Electronic Health Record (EHR) Apps Market Estimates and Forecasts, By Application (2020-2032) (USD Million)

10.3.1.10.3 Rest of Eastern Europe Electronic Health Record (EHR) Apps Market Estimates and Forecasts, By End-Use (2020-2032) (USD Million)

10.3.2 Western Europe

10.3.2.1 Trends Analysis

10.3.2.2 Western Europe Electronic Health Record (EHR) Apps Market Estimates and Forecasts, by Country (2020-2032) (USD Million)

10.3.2.3 Western Europe Electronic Health Record (EHR) Apps Market Estimates and Forecasts, By Type (2020-2032) (USD Million) 

10.3.2.4 Western Europe Electronic Health Record (EHR) Apps Market Estimates and Forecasts, By Application (2020-2032) (USD Million)

10.3.2.5 Western Europe Electronic Health Record (EHR) Apps Market Estimates and Forecasts, By End-Use (2020-2032) (USD Million)

10.3.2.6 Germany

10.3.2.6.1 Germany Electronic Health Record (EHR) Apps Market Estimates and Forecasts, By Type (2020-2032) (USD Million)

10.3.2.6.2 Germany Electronic Health Record (EHR) Apps Market Estimates and Forecasts, By Application (2020-2032) (USD Million)

10.3.2.6.3 Germany Electronic Health Record (EHR) Apps Market Estimates and Forecasts, By End-Use (2020-2032) (USD Million)

10.3.2.7 France

10.3.2.7.1 France Electronic Health Record (EHR) Apps Market Estimates and Forecasts, By Type (2020-2032) (USD Million)

10.3.2.7.2 France Electronic Health Record (EHR) Apps Market Estimates and Forecasts, By Application (2020-2032) (USD Million)

10.3.2.7.3 France Electronic Health Record (EHR) Apps Market Estimates and Forecasts, By End-Use (2020-2032) (USD Million)

10.3.2.8 UK

10.3.2.8.1 UK Electronic Health Record (EHR) Apps Market Estimates and Forecasts, By Type (2020-2032) (USD Million)

10.3.2.8.2 UK Electronic Health Record (EHR) Apps Market Estimates and Forecasts, By Application (2020-2032) (USD Million)

10.3.2.8.3 UK Electronic Health Record (EHR) Apps Market Estimates and Forecasts, By End-Use (2020-2032) (USD Million)

10.3.2.9 Italy

10.3.2.9.1 Italy Electronic Health Record (EHR) Apps Market Estimates and Forecasts, By Type (2020-2032) (USD Million)

10.3.2.9.2 Italy Electronic Health Record (EHR) Apps Market Estimates and Forecasts, By Application (2020-2032) (USD Million)

10.3.2.9.3 Italy Electronic Health Record (EHR) Apps Market Estimates and Forecasts, By End-Use (2020-2032) (USD Million)

10.3.2.10 Spain

10.3.2.10.1 Spain Electronic Health Record (EHR) Apps Market Estimates and Forecasts, By Type (2020-2032) (USD Million)

10.3.2.10.2 Spain Electronic Health Record (EHR) Apps Market Estimates and Forecasts, By Application (2020-2032) (USD Million)

10.3.2.10.3 Spain Electronic Health Record (EHR) Apps Market Estimates and Forecasts, By End-Use (2020-2032) (USD Million)

10.3.2.11 Netherlands

10.3.2.11.1 Netherlands Electronic Health Record (EHR) Apps Market Estimates and Forecasts, By Type (2020-2032) (USD Million)

10.3.2.11.2 Netherlands Electronic Health Record (EHR) Apps Market Estimates and Forecasts, By Application (2020-2032) (USD Million)

10.3.2.11.3 Netherlands Electronic Health Record (EHR) Apps Market Estimates and Forecasts, By End-Use (2020-2032) (USD Million)

10.3.2.12 Switzerland

10.3.2.12.1 Switzerland Electronic Health Record (EHR) Apps Market Estimates and Forecasts, By Type (2020-2032) (USD Million)

10.3.2.12.2 Switzerland Electronic Health Record (EHR) Apps Market Estimates and Forecasts, By Application (2020-2032) (USD Million)

10.3.2.12.3 Switzerland Electronic Health Record (EHR) Apps Market Estimates and Forecasts, By End-Use (2020-2032) (USD Million)

10.3.2.13 Austria

10.3.2.13.1 Austria Electronic Health Record (EHR) Apps Market Estimates and Forecasts, By Type (2020-2032) (USD Million)

10.3.2.13.2 Austria Electronic Health Record (EHR) Apps Market Estimates and Forecasts, By Application (2020-2032) (USD Million)

10.3.2.13.3 Austria Electronic Health Record (EHR) Apps Market Estimates and Forecasts, By End-Use (2020-2032) (USD Million)

10.3.2.14 Rest of Western Europe

10.3.2.14.1 Rest of Western Europe Electronic Health Record (EHR) Apps Market Estimates and Forecasts, By Type (2020-2032) (USD Million)

10.3.2.14.2 Rest of Western Europe Electronic Health Record (EHR) Apps Market Estimates and Forecasts, By Application (2020-2032) (USD Million)

10.3.2.14.3 Rest of Western Europe Electronic Health Record (EHR) Apps Market Estimates and Forecasts, By End-Use (2020-2032) (USD Million)

10.4 Asia Pacific

10.4.1 Trends Analysis

10.4.2 Asia Pacific Electronic Health Record (EHR) Apps Market Estimates and Forecasts, by Country (2020-2032) (USD Million)

10.4.3 Asia Pacific Electronic Health Record (EHR) Apps Market Estimates and Forecasts, By Type (2020-2032) (USD Million) 

10.4.4 Asia Pacific Electronic Health Record (EHR) Apps Market Estimates and Forecasts, By Application (2020-2032) (USD Million)

10.4.5 Asia Pacific Electronic Health Record (EHR) Apps Market Estimates and Forecasts, By End-Use (2020-2032) (USD Million)

10.4.6 China

10.4.6.1 China Electronic Health Record (EHR) Apps Market Estimates and Forecasts, By Type (2020-2032) (USD Million)

10.4.6.2 China Electronic Health Record (EHR) Apps Market Estimates and Forecasts, By Application (2020-2032) (USD Million)

10.4.6.3 China Electronic Health Record (EHR) Apps Market Estimates and Forecasts, By End-Use (2020-2032) (USD Million)

10.4.7 India

10.4.7.1 India Electronic Health Record (EHR) Apps Market Estimates and Forecasts, By Type (2020-2032) (USD Million)

10.4.7.2 India Electronic Health Record (EHR) Apps Market Estimates and Forecasts, By Application (2020-2032) (USD Million)

10.4.7.3 India Electronic Health Record (EHR) Apps Market Estimates and Forecasts, By End-Use (2020-2032) (USD Million)

10.4.8 Japan

10.4.8.1 Japan Electronic Health Record (EHR) Apps Market Estimates and Forecasts, By Type (2020-2032) (USD Million)

10.4.8.2 Japan Electronic Health Record (EHR) Apps Market Estimates and Forecasts, By Application (2020-2032) (USD Million)

10.4.8.3 Japan Electronic Health Record (EHR) Apps Market Estimates and Forecasts, By End-Use (2020-2032) (USD Million)

10.4.9 South Korea

10.4.9.1 South Korea Electronic Health Record (EHR) Apps Market Estimates and Forecasts, By Type (2020-2032) (USD Million)

10.4.9.2 South Korea Electronic Health Record (EHR) Apps Market Estimates and Forecasts, By Application (2020-2032) (USD Million)

10.4.9.3 South Korea Electronic Health Record (EHR) Apps Market Estimates and Forecasts, By End-Use (2020-2032) (USD Million)

10.4.10 Vietnam

10.4.10.1 Vietnam Electronic Health Record (EHR) Apps Market Estimates and Forecasts, By Type (2020-2032) (USD Million)

10.4.10.2 Vietnam Electronic Health Record (EHR) Apps Market Estimates and Forecasts, By Application (2020-2032) (USD Million)

10.4.10.3 Vietnam Electronic Health Record (EHR) Apps Market Estimates and Forecasts, By End-Use (2020-2032) (USD Million)

10.4.11 Singapore

10.4.11.1 Singapore Electronic Health Record (EHR) Apps Market Estimates and Forecasts, By Type (2020-2032) (USD Million)

10.4.11.2 Singapore Electronic Health Record (EHR) Apps Market Estimates and Forecasts, By Application (2020-2032) (USD Million)

10.4.11.3 Singapore Electronic Health Record (EHR) Apps Market Estimates and Forecasts, By End-Use (2020-2032) (USD Million)

10.4.12 Australia

10.4.12.1 Australia Electronic Health Record (EHR) Apps Market Estimates and Forecasts, By Type (2020-2032) (USD Million)

10.4.12.2 Australia Electronic Health Record (EHR) Apps Market Estimates and Forecasts, By Application (2020-2032) (USD Million)

10.4.12.3 Australia Electronic Health Record (EHR) Apps Market Estimates and Forecasts, By End-Use (2020-2032) (USD Million)

10.4.13 Rest of Asia Pacific

10.4.13.1 Rest of Asia Pacific Electronic Health Record (EHR) Apps Market Estimates and Forecasts, By Type (2020-2032) (USD Million)

10.4.13.2 Rest of Asia Pacific Electronic Health Record (EHR) Apps Market Estimates and Forecasts, By Application (2020-2032) (USD Million)

10.4.13.3 Rest of Asia Pacific Electronic Health Record (EHR) Apps Market Estimates and Forecasts, By End-Use (2020-2032) (USD Million)

10.5 Middle East and Africa

10.5.1 Middle East

10.5.1.1 Trends Analysis

10.5.1.2 Middle East Electronic Health Record (EHR) Apps Market Estimates and Forecasts, by Country (2020-2032) (USD Million)

10.5.1.3 Middle East Electronic Health Record (EHR) Apps Market Estimates and Forecasts, By Type (2020-2032) (USD Million) 

10.5.1.4 Middle East Electronic Health Record (EHR) Apps Market Estimates and Forecasts, By Application (2020-2032) (USD Million)

10.5.1.5 Middle East Electronic Health Record (EHR) Apps Market Estimates and Forecasts, By End-Use (2020-2032) (USD Million)

10.5.1.6 UAE

10.5.1.6.1 UAE Electronic Health Record (EHR) Apps Market Estimates and Forecasts, By Type (2020-2032) (USD Million)

10.5.1.6.2 UAE Electronic Health Record (EHR) Apps Market Estimates and Forecasts, By Application (2020-2032) (USD Million)

10.5.1.6.3 UAE Electronic Health Record (EHR) Apps Market Estimates and Forecasts, By End-Use (2020-2032) (USD Million)

10.5.1.7 Egypt

10.5.1.7.1 Egypt Electronic Health Record (EHR) Apps Market Estimates and Forecasts, By Type (2020-2032) (USD Million)

10.5.1.7.2 Egypt Electronic Health Record (EHR) Apps Market Estimates and Forecasts, By Application (2020-2032) (USD Million)

10.5.1.7.3 Egypt Electronic Health Record (EHR) Apps Market Estimates and Forecasts, By End-Use (2020-2032) (USD Million)

10.5.1.8 Saudi Arabia

10.5.1.8.1 Saudi Arabia Electronic Health Record (EHR) Apps Market Estimates and Forecasts, By Type (2020-2032) (USD Million)

10.5.1.8.2 Saudi Arabia Electronic Health Record (EHR) Apps Market Estimates and Forecasts, By Application (2020-2032) (USD Million)

10.5.1.8.3 Saudi Arabia Electronic Health Record (EHR) Apps Market Estimates and Forecasts, By End-Use (2020-2032) (USD Million)

10.5.1.9 Qatar

10.5.1.9.1 Qatar Electronic Health Record (EHR) Apps Market Estimates and Forecasts, By Type (2020-2032) (USD Million)

10.5.1.9.2 Qatar Electronic Health Record (EHR) Apps Market Estimates and Forecasts, By Application (2020-2032) (USD Million)

10.5.1.9.3 Qatar Electronic Health Record (EHR) Apps Market Estimates and Forecasts, By End-Use (2020-2032) (USD Million)

10.5.1.10 Rest of Middle East

10.5.1.10.1 Rest of Middle East Electronic Health Record (EHR) Apps Market Estimates and Forecasts, By Type (2020-2032) (USD Million)

10.5.1.10.2 Rest of Middle East Electronic Health Record (EHR) Apps Market Estimates and Forecasts, By Application (2020-2032) (USD Million)

10.5.1.10.3 Rest of Middle East Electronic Health Record (EHR) Apps Market Estimates and Forecasts, By End-Use (2020-2032) (USD Million)

10.5.2 Africa

10.5.2.1 Trends Analysis

10.5.2.2 Africa Electronic Health Record (EHR) Apps Market Estimates and Forecasts, by Country (2020-2032) (USD Million)

10.5.2.3 Africa Electronic Health Record (EHR) Apps Market Estimates and Forecasts, By Type (2020-2032) (USD Million) 

10.5.2.4 Africa Electronic Health Record (EHR) Apps Market Estimates and Forecasts, By Application (2020-2032) (USD Million)

10.5.2.5 Africa Electronic Health Record (EHR) Apps Market Estimates and Forecasts, By End-Use (2020-2032) (USD Million)

10.5.2.6 South Africa

10.5.2.6.1 South Africa Electronic Health Record (EHR) Apps Market Estimates and Forecasts, By Type (2020-2032) (USD Million)

10.5.2.6.2 South Africa Electronic Health Record (EHR) Apps Market Estimates and Forecasts, By Application (2020-2032) (USD Million)

10.5.2.6.3 South Africa Electronic Health Record (EHR) Apps Market Estimates and Forecasts, By End-Use (2020-2032) (USD Million)

10.5.2.7 Nigeria

10.5.2.7.1 Nigeria Electronic Health Record (EHR) Apps Market Estimates and Forecasts, By Type (2020-2032) (USD Million)

10.5.2.7.2 Nigeria Electronic Health Record (EHR) Apps Market Estimates and Forecasts, By Application (2020-2032) (USD Million)

10.5.2.7.3 Nigeria Electronic Health Record (EHR) Apps Market Estimates and Forecasts, By End-Use (2020-2032) (USD Million)

10.5.2.8 Rest of Africa

10.5.2.8.1 Rest of Africa Electronic Health Record (EHR) Apps Market Estimates and Forecasts, By Type (2020-2032) (USD Million)

10.5.2.8.2 Rest of Africa Electronic Health Record (EHR) Apps Market Estimates and Forecasts, By Application (2020-2032) (USD Million)

10.5.2.8.3 Rest of Africa Electronic Health Record (EHR) Apps Market Estimates and Forecasts, By End-Use (2020-2032) (USD Million)

10.6 Latin America

10.6.1 Trends Analysis

10.6.2 Latin America Electronic Health Record (EHR) Apps Market Estimates and Forecasts, by Country (2020-2032) (USD Million)

10.6.3 Latin America Electronic Health Record (EHR) Apps Market Estimates and Forecasts, By Type (2020-2032) (USD Million) 

10.6.4 Latin America Electronic Health Record (EHR) Apps Market Estimates and Forecasts, By Application (2020-2032) (USD Million)

10.6.5 Latin America Electronic Health Record (EHR) Apps Market Estimates and Forecasts, By End-Use (2020-2032) (USD Million)

10.6.6 Brazil

10.6.6.1 Brazil Electronic Health Record (EHR) Apps Market Estimates and Forecasts, By Type (2020-2032) (USD Million)

10.6.6.2 Brazil Electronic Health Record (EHR) Apps Market Estimates and Forecasts, By Application (2020-2032) (USD Million)

10.6.6.3 Brazil Electronic Health Record (EHR) Apps Market Estimates and Forecasts, By End-Use (2020-2032) (USD Million)

10.6.7 Argentina

10.6.7.1 Argentina Electronic Health Record (EHR) Apps Market Estimates and Forecasts, By Type (2020-2032) (USD Million)

10.6.7.2 Argentina Electronic Health Record (EHR) Apps Market Estimates and Forecasts, By Application (2020-2032) (USD Million)

10.6.7.3 Argentina Electronic Health Record (EHR) Apps Market Estimates and Forecasts, By End-Use (2020-2032) (USD Million)

10.6.8 Colombia

10.6.8.1 Colombia Electronic Health Record (EHR) Apps Market Estimates and Forecasts, By Type (2020-2032) (USD Million)

10.6.8.2 Colombia Electronic Health Record (EHR) Apps Market Estimates and Forecasts, By Application (2020-2032) (USD Million)

10.6.8.3 Colombia Electronic Health Record (EHR) Apps Market Estimates and Forecasts, By End-Use (2020-2032) (USD Million)

10.6.9 Rest of Latin America

10.6.9.1 Rest of Latin America Electronic Health Record (EHR) Apps Market Estimates and Forecasts, By Type (2020-2032) (USD Million)

10.6.9.2 Rest of Latin America Electronic Health Record (EHR) Apps Market Estimates and Forecasts, By Application (2020-2032) (USD Million)

10.6.9.3 Rest of Latin America Electronic Health Record (EHR) Apps Market Estimates and Forecasts, By End-Use (2020-2032) (USD Million)

11. Company Profiles

11.1 Epic Systems Corporation

11.1.1 Company Overview

11.1.2 Financial

11.1.3 Products/ Services Offered

11.1.4 SWOT Analysis

11.2 Cerner Corporation (now Oracle Health)

11.2.1 Company Overview

11.2.2 Financial

11.2.3 Products/ Services Offered

11.2.4 SWOT Analysis

11.3 Allscripts Healthcare Solutions (now Veradigm Inc.)

11.3.1 Company Overview

11.3.2 Financial

11.3.3 Products/ Services Offered

11.3.4 SWOT Analysis

11.4 MEDITECH

11.4.1 Company Overview

11.4.2 Financial

11.4.3 Products/ Services Offered

11.4.4 SWOT Analysis

11.5 NextGen Healthcare

11.5.1 Company Overview

11.5.2 Financial

11.5.3 Products/ Services Offered

11.5.4 SWOT Analysis

11.6 eClinicalWorks

11.6.1 Company Overview

11.6.2 Financial

11.6.3 Products/ Services Offered

11.6.4 SWOT Analysis

11.7 Athenahealth

11.7.1 Company Overview

11.7.2 Financial

11.7.3 Products/ Services Offered

11.7.4 SWOT Analysis

11.8 IBM Watson Health

11.8.1 Company Overview

11.8.2 Financial

11.8.3 Products/ Services Offered

11.8.4 SWOT Analysis

11.9 Philips Healthcare

11.9.1 Company Overview

11.9.2 Financial

11.9.3 Products/ Services Offered

11.9.4 SWOT Analysis

11.10 GE Healthcare

11.10.1 Company Overview

11.10.2 Financial

11.10.3 Products/ Services Offered

11.10.4 SWOT Analysis

12. Use Cases and Best Practices

13. Conclusion

An accurate research report requires proper strategizing as well as implementation. There are multiple factors involved in the completion of good and accurate research report and selecting the best methodology to compete the research is the toughest part. Since the research reports we provide play a crucial role in any company’s decision-making process, therefore we at SNS Insider always believe that we should choose the best method which gives us results closer to reality. This allows us to reach at a stage wherein we can provide our clients best and accurate investment to output ratio.

Each report that we prepare takes a timeframe of 350-400 business hours for production. Starting from the selection of titles through a couple of in-depth brain storming session to the final QC process before uploading our titles on our website we dedicate around 350 working hours. The titles are selected based on their current market cap and the foreseen CAGR and growth.


The 5 steps process:

Step 1: Secondary Research:

Secondary Research or Desk Research is as the name suggests is a research process wherein, we collect data through the readily available information. In this process we use various paid and unpaid databases which our team has access to and gather data through the same. This includes examining of listed companies’ annual reports, Journals, SEC filling etc. Apart from this our team has access to various associations across the globe across different industries. Lastly, we have exchange relationships with various university as well as individual libraries.

Secondary Research

Step 2: Primary Research

When we talk about primary research, it is a type of study in which the researchers collect relevant data samples directly, rather than relying on previously collected data.  This type of research is focused on gaining content specific facts that can be sued to solve specific problems. Since the collected data is fresh and first hand therefore it makes the study more accurate and genuine.

We at SNS Insider have divided Primary Research into 2 parts.

Part 1 wherein we interview the KOLs of major players as well as the upcoming ones across various geographic regions. This allows us to have their view over the market scenario and acts as an important tool to come closer to the accurate market numbers. As many as 45 paid and unpaid primary interviews are taken from both the demand and supply side of the industry to make sure we land at an accurate judgement and analysis of the market.

This step involves the triangulation of data wherein our team analyses the interview transcripts, online survey responses and observation of on filed participants. The below mentioned chart should give a better understanding of the part 1 of the primary interview.

Primary Research

Part 2: In this part of primary research the data collected via secondary research and the part 1 of the primary research is validated with the interviews from individual consultants and subject matter experts.

Consultants are those set of people who have at least 12 years of experience and expertise within the industry whereas Subject Matter Experts are those with at least 15 years of experience behind their back within the same space. The data with the help of two main processes i.e., FGDs (Focused Group Discussions) and IDs (Individual Discussions). This gives us a 3rd party nonbiased primary view of the market scenario making it a more dependable one while collation of the data pointers.

Step 3: Data Bank Validation

Once all the information is collected via primary and secondary sources, we run that information for data validation. At our intelligence centre our research heads track a lot of information related to the market which includes the quarterly reports, the daily stock prices, and other relevant information. Our data bank server gets updated every fortnight and that is how the information which we collected using our primary and secondary information is revalidated in real time.

Data Bank Validation

Step 4: QA/QC Process

After all the data collection and validation our team does a final level of quality check and quality assurance to get rid of any unwanted or undesired mistakes. This might include but not limited to getting rid of the any typos, duplication of numbers or missing of any important information. The people involved in this process include technical content writers, research heads and graphics people. Once this process is completed the title gets uploader on our platform for our clients to read it.

Step 5: Final QC/QA Process:

This is the last process and comes when the client has ordered the study. In this process a final QA/QC is done before the study is emailed to the client. Since we believe in giving our clients a good experience of our research studies, therefore, to make sure that we do not lack at our end in any way humanly possible we do a final round of quality check and then dispatch the study to the client.

Key Market Segments:

By Type

  • Android

  • iOS

By Application

  • Administrative

  • Clinical

  • e-Prescribing

  • Others

By End-use

  • Hospitals

  • Ambulatory Care Centers

  • Others

Request for Segment Customization as per your Business Requirement: Segment Customization Request

Regional Coverage:

North America

  • US

  • Canada

  • Mexico

Europe

  • Eastern Europe

    • Poland

    • Romania

    • Hungary

    • Turkey

    • Rest of Eastern Europe

  • Western Europe

    • Germany

    • France

    • UK

    • Italy

    • Spain

    • Netherlands

    • Switzerland

    • Austria

    • Rest of Western Europe

Asia Pacific

  • China

  • India

  • Japan

  • South Korea

  • Vietnam

  • Singapore

  • Australia

  • Rest of Asia Pacific

Middle East & Africa

  • Middle East

    • UAE

    • Egypt

    • Saudi Arabia

    • Qatar

    • Rest of Middle East

  • Africa

    • Nigeria

    • South Africa

    • Rest of Africa

Latin America

  • Brazil

  • Argentina

  • Colombia

  • Rest of Latin America

Request for Country Level Research Report: Country Level Customization Request

Available Customization

With the given market data, SNS Insider offers customization as per the company’s specific needs. The following customization options are available for the report:

  • Detailed Volume Analysis

  • Criss-Cross segment analysis (e.g. Product X Application)

  • Competitive Product Benchmarking

  • Geographic Analysis

  • Additional countries in any of the regions

  • Customized Data Representation

  • Detailed analysis and profiling of additional market players


  •            5000 (33% Discount)


  •            8950 (40% Discount)


  •            3050 (23% Discount)

Start a Conversation

Hi! Click one of our member below to chat on Phone