Get More Information on Electronic Display Market - Request Sample Report
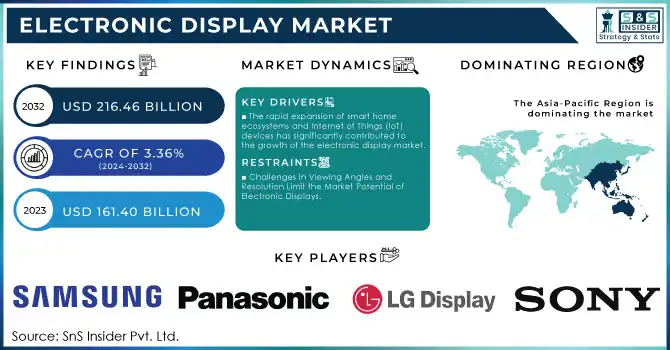
The Electronic Display Market Size was valued at USD 161.40 Billion in 2023 and is expected to reach USD 216.46 Billion by 2032, growing at a CAGR of 3.36% over the forecast period 2024-2032.
The electronic display market is experiencing significant growth across diverse sectors, from consumer electronics like smartphones, tablets, and TVs to industrial and automotive applications, where they serve as critical tools for communication, monitoring, and control. Devices such as smartphones, smartwatches, and tablets rely on electronic displays to deliver sharp visuals, vibrant colors, and touch-responsive features. As of 2024, the global smartphone landscape is remarkable, with approximately 7.21 billion smartphones in use, accounting for around 90% of the world's 8 billion population. The demographic distribution reveals that China leads in smartphone users, boasting around 1,000 million active users, followed by India with 650 million and the United States with 280 million. Similarly, in 2024, the global smartwatch market boasts approximately 228 million users, with projections indicating this number will grow to 231 million by 2026. The market is set to ship nearly 200 million smartwatches in 2024, reflecting a 16% increase from the previous year, primarily driven by advancements in health and fitness tracking technologies. Manufacturers are continuously investing in developing next-generation displays such as OLEDs, micro-LEDs, and QLEDs to provide enhanced brightness and contrast levels, thus meeting consumers' increasing expectations for quality. Furthermore, the rise of 4K and 8K displays is creating new opportunities in the market, especially in home entertainment systems and gaming monitors, where ultra-high-resolution displays provide immersive viewing experiences.
In the automotive industry, electronic displays have become an integral part of modern vehicle design, significantly contributing to market growth. Displays are utilized in digital instrument clusters, infotainment systems, heads-up displays (HUDs), and rear-seat entertainment systems. These displays enable seamless interaction between the driver and vehicle, offering real-time information such as speed, navigation, and vehicle diagnostics. As electric vehicles (EVs) and autonomous driving technology advance, the demand for high-resolution and adaptable displays in vehicles is expected to rise. The automotive sector's shift toward smart and connected vehicles has made electronic displays an essential component for enhancing user experience and improving safety through advanced display solutions.
Drivers
The rapid expansion of smart home ecosystems and Internet of Things (IoT) devices has significantly contributed to the growth of the electronic display market.
Displays are a necessary part of smart appliances like refrigerators, washing machines, thermostats, and lighting control systems in smart homes. Around 70 million households in the US are actively using smart home devices in 2024. This is 10.2% more than the 65 million recorded in 2023. With the increasing number of users embracing smart home technologies, there is a rising demand for connected displays that improve user control and interact with other devices. For example, smart speakers such as the Amazon Echo Show or Google Nest Hub, heavily depend on top-notch displays for visual engagement. These screens offer users weather updates, video calls, and interfaces for controlling smart homes. The increasing need for advanced display technologies has resulted from the smooth integration of IoT devices and their interconnected features. Furthermore, IoT integration is becoming more prevalent in sectors such as healthcare and automotive. Modern medical devices, including health monitors and diagnostic equipment, along with infotainment systems in cars, now have state-of-the-art displays. These displays allow for the visualization of data in real time, enhancing functionality and user satisfaction. The increasing use of IoT devices in different industries presents substantial growth opportunities for the electronic display market.
The increasing use of AR and VR technologies in gaming, education, healthcare, and retail has led to a growing demand for advanced electronic displays.
High-resolution displays, fast refresh rates, and low latency are necessary for AR and VR to provide immersive experiences. There are approximately 2 billion active AR user devices. Around 3 in 4 adults under the age of 44 are aware of Augmented reality. The use of these technologies in areas like entertainment and training is expanding the limits of display technology. In the world of gaming, VR headsets such as the Oculus Rift and PlayStation VR utilize advanced display technology to offer realistic and immersive gameplay. These screens need to have high resolution and fast refresh rates to reduce motion sickness and improve the realism in the virtual world. In the same way, industries like retail (virtual try-ons), education (interactive learning tools), and healthcare (surgical training) rely on electronic displays that can smoothly superimpose digital information into the physical environment. The progress in AR/VR technologies is still fueling the demand for innovation in display technology, stimulating growth in the electronic display market as businesses pour resources into developing more immersive and captivating experiences.
Restraints
Challenges in Viewing Angles and Resolution Limit the Market Potential of Electronic Displays.
Despite improvements in display technology, many electronic displays still have limitations in viewing angles and resolutions. For example, when looked at from a different angle, traditional LCDs may show color distortion and decreased visibility, which can negatively impact the user's experience. Limitations in viewing angles and resolution may discourage consumers from purchasing specific display types, especially for applications that need wide viewing angles, like digital signage and collaborative workspaces. If consumers view a product's performance as unsatisfactory, they might opt for different technologies or brands, hindering market expansion. Addressing these technical hurdles frequently demands a notable financial commitment to research and development, which in turn adds complexity to manufacturing and raises expenses. This investment could put pressure on resources for businesses, especially smaller ones that may not have enough funds to heavily invest in technology development.
By Technology
The LCD segment held a major market share of more than 38% in 2023, because of its widespread use in different industries. LCDs are recognized for being cost-effective, energy-efficient, and capable of producing high-quality images, making them ideal for televisions, computer monitors, cell phones, and car displays. Furthermore, the production facilities for LCDs are already in place, resulting in reduced manufacturing expenses when compared to emerging technologies. Samsung and LG heavily rely on LCD technology for their televisions and monitors, whereas Apple has integrated LCDs into a few iPad models.
OLED is to experience the fastest growth rate during the 2024-2032, electronic display market because of its exceptional image quality, flexibility, and lightweight design. OLED screens provide superior contrast ratios, quicker refresh rates, and darker blacks, making them perfect for premium smartphones, televisions, and smartwatches. OLEDs, in contrast to LCDs, do not need a backlight, resulting in thinner screens with more vivid colors. This technology is becoming increasingly popular in the high-end market of electronic screens, as evidenced by Apple's iPhone and Samsung's Galaxy series.
By Application
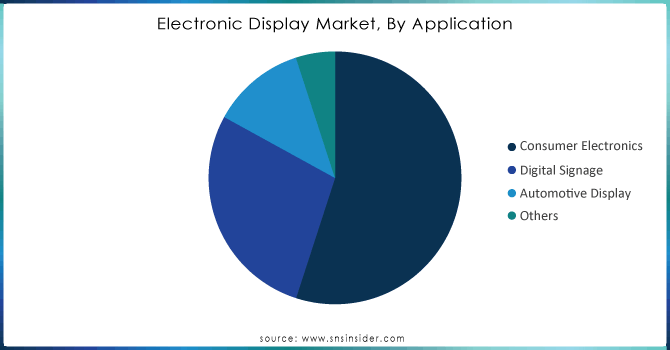
The consumer electronics segment led the market in the electronic display market with a 55% market share in 2023. The rise in HD and UHD screens has raised consumer standards for better visual experiences. The rise of OLED and AMOLED technologies has increased this expansion due to their superior color accuracy, contrast, and energy efficiency. Samsung and Apple have been leading the way in incorporating advanced displays into their top-of-the-line products, like the Samsung Galaxy series and iPhones, which use OLED screens to provide vibrant and engaging viewing experiences.
The digital signage segment is projected to show the fastest CAGR during 2024-2032, due to the rising need for dynamic advertising, interactive displays, and real-time content delivery across different industries. Retail stores, transport centers, business headquarters, and communal areas utilize digital signage solutions to interact with customers and provide specific information. LG Electronics and NEC play a significant role in offering digital signage solutions to the retail and hospitality industries.
Need Any Customization Research On Electronic Display Market - Inquiry Now
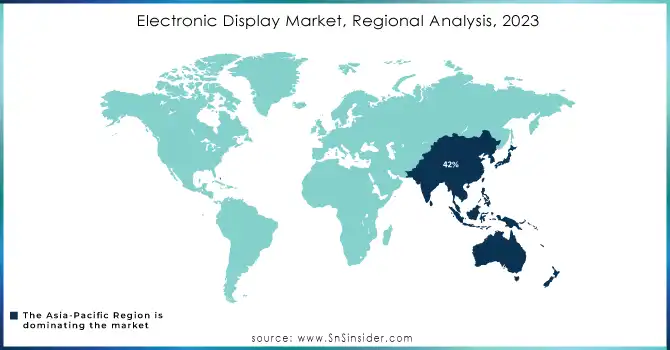
Asia-Pacific dominated with a 42% market share in 2023, due to its significant production capabilities, efficient manufacturing processes, and a sizable customer population. Nations such as China, Japan, and South Korea are where you can find major display makers like Samsung Electronics, LG Display, and BOE Technology that hold a significant share of the worldwide market. The region's leadership is also reinforced by an increased desire for smartphones, televisions, and gaming monitors, especially in growing markets such as India and Southeast Asia.
North America is anticipated to have the fastest CAGR during 2024-2032, due to the rising popularity of advanced display technologies such as OLED, micro-LED, and quantum dot displays. The region's increasing demand for high-resolution screens in smartphones, tablets, and televisions, along with the growing use of digital signage in industries such as retail and hospitality, continues to drive this growth. Additionally, the participation of major tech companies like Apple, Google, and Microsoft plays a role in the region's progress in display technologies.
The major key players in the Electronic Display Market are:
Samsung Electronics (QLED TV, OLED Display Panels)
LG Display (OLED TVs, Transparent OLED Panels)
Sony Corporation (BRAVIA OLED TVs, Crystal LED Display System)
BOE Technology Group (Flexible OLED Panels, LCD Panels)
Panasonic Corporation (4K UHD TVs, Automotive Display Panels)
AU Optronics (AMOLED Displays, TFT-LCD Panels)
Sharp Corporation (IGZO Display Panels, AQUOS TVs)
TCL Technology (Mini-LED TVs, QLED Displays)
Innolux Corporation (LCD TV Panels, Medical Display Panels)
Hisense (ULED TVs, Laser Display Technology)
Kyocera Corporation (Industrial LCD Displays, Ruggedized Touch Panels)
Leyard Optoelectronic (LED Video Walls, MicroLED Displays)
ViewSonic Corporation (Projectors, LED Monitors)
Barco NV (LED Video Walls, High-Resolution Projectors)
Planar Systems (LED Video Walls, Transparent OLED Displays)
JDI (Japan Display Inc.) (LTPS LCD Panels, Automotive Display Panels)
Acer Inc. (LED Monitors, Gaming Displays)
ASUS (Gaming Monitors, OLED Laptops)
Vizio Inc. (Smart TVs, Quantum LED TVs)
Apple Inc. (Retina Displays, Pro Display XDR)
Corning Inc.
Nitto Denko Corporation
3M Company
Nichia Corporation
Asahi Glass Co., Ltd. (AGC)
Sumitomo Chemical Co., Ltd.
Merck KGaA
DuPont de Nemours, Inc.
Saint-Gobain
Mitsubishi Chemical Corporation
In June 2024, Samsung Electronics announced the global launch of its 2024 Odyssey OLED gaming monitor, Smart Monitor and ViewFinity monitor series. Designed for people and equipped with unexpected features, new and improved models create a new user experience no matter how you use your monitor.
In September 2024, MRS Electronics announced the launch of two new displays. This new 4.3-inch and 7-inch display size provides a cost-effective, versatile human-machine interface that fills the gaps between smaller and larger current product offerings that address market demand.
In August 2024, Apple Inc., which is looking for new revenue sources, began developing a high-priced home device with a tabletop on which an iPad-like display is located on top of a robotic limb.
| Report Attributes | Details |
|---|---|
| Market Size in 2023 | USD 161.40 Billion |
| Market Size by 2032 | USD 216.46 Billion |
| CAGR | CAGR of 3.36% From 2024 to 2032 |
| Base Year | 2023 |
| Forecast Period | 2024-2032 |
| Historical Data | 2020-2022 |
| Report Scope & Coverage | Market Size, Segments Analysis, Competitive Landscape, Regional Analysis, DROC & SWOT Analysis, Forecast Outlook |
| Key Segments | • By Technology (LCD, LED, OLED, Others) • By Application (Consumer Electronics, Digital Signage, Automotive Display, Others) • By End User (Retail, Entertainment, Corporate, Healthcare, Government) |
| Regional Analysis/Coverage | North America (US, Canada, Mexico), Europe (Eastern Europe [Poland, Romania, Hungary, Turkey, Rest of Eastern Europe] Western Europe [Germany, France, UK, Italy, Spain, Netherlands, Switzerland, Austria, Rest of Western Europe]), Asia Pacific (China, India, Japan, South Korea, Vietnam, Singapore, Australia, Rest of Asia Pacific), Middle East & Africa (Middle East [UAE, Egypt, Saudi Arabia, Qatar, Rest of Middle East], Africa [Nigeria, South Africa, Rest of Africa], Latin America (Brazil, Argentina, Colombia, Rest of Latin America) |
| Company Profiles | Samsung Electronics, LG Display, Sony Corporation, BOE Technology Group, Panasonic Corporation, AU Optronics, Sharp Corporation, TCL Technology, Innolux Corporation, Hisense, Kyocera Corporation, Leyard Optoelectronic, ViewSonic Corporation, Barco NV, Planar Systems, JDI (Japan Display Inc.), Acer Inc., ASUS, Vizio Inc., Apple Inc |
| Key Drivers | • The rapid expansion of smart home ecosystems and Internet of Things (IoT) devices has significantly contributed to the growth of the electronic display market. • The increasing use of AR and VR technologies in gaming, education, healthcare, and retail has led to a growing demand for advanced electronic displays. |
| Restraints | • Challenges in Viewing Angles and Resolution Limit the Market Potential of Electronic Displays. |
Ans: The Electronic Display Market is expected to grow at a CAGR of 3.36% during 2024-2032.
Ans: The Electronic Display Market was USD 161.40 Billion in 2023 and is expected to Reach USD 216.46 Billion by 2032.
Ans: The rapid expansion of smart home ecosystems and Internet of Things (IoT) devices has significantly contributed to the growth of the electronic display market.
Ans: The consumer electronics segment dominated the Electronic Display Market.
Ans: Asia-Pacific dominated the Electronic Display Market in 2023.
Table of Content
1. Introduction
1.1 Market Definition
1.2 Scope (Inclusion and Exclusions)
1.3 Research Assumptions
2. Executive Summary
2.1 Market Overview
2.2 Regional Synopsis
2.3 Competitive Summary
3. Research Methodology
3.1 Top-Down Approach
3.2 Bottom-up Approach
3.3. Data Validation
3.4 Primary Interviews
4. Market Dynamics Impact Analysis
4.1 Market Driving Factors Analysis
4.1.1 Drivers
4.1.2 Restraints
4.1.3 Opportunities
4.1.4 Challenges
4.2 PESTLE Analysis
4.3 Porter’s Five Forces Model
5. Statistical Insights and Trends Reporting
5.1 Electronic Display Volume of Units Sold, by Region (2023)
5.2 Electronic Display Adoption Rates, by Region
5.3 Innovation Metrics
5.4 Supply Chain Metrics
6. Competitive Landscape
6.1 List of Major Companies, By Region
6.2 Market Share Analysis, By Region
6.3 Product Benchmarking
6.3.1 Product specifications and features
6.3.2 Pricing
6.4 Strategic Initiatives
6.4.1 Marketing and promotional activities
6.4.2 Distribution and Supply Chain Strategies
6.4.3 Expansion plans and new product launches
6.4.4 Strategic partnerships and collaborations
6.5 Technological Advancements
6.6 Market Positioning and Branding
7. Electronic Display Market Segmentation, By Technology
7.1 Chapter Overview
7.2 LCD
7.2.1 LCD Market Trends Analysis (2020-2032)
7.2.2 LCD Market Size Estimates and Forecasts to 2032 (USD Billion)
7.3 LED
7.3.1 LED Market Trends Analysis (2020-2032)
7.3.2 LED Market Size Estimates and Forecasts to 2032 (USD Billion)
7.4 OLED
7.4.1 OLED Market Trends Analysis (2020-2032)
7.4.2 OLED Market Size Estimates and Forecasts to 2032 (USD Billion)
7.5 Others
7.5.1 Others Market Trends Analysis (2020-2032)
7.5.2 Others Market Size Estimates and Forecasts to 2032 (USD Billion)
8. Electronic Display Market Segmentation, By Application
8.1 Chapter Overview
8.2 Consumer Electronics
8.2.1 8 Consumer Electronics Market Trends Analysis (2020-2032)
8.2.2 8 Consumer Electronics Market Size Estimates and Forecasts to 2032 (USD Billion)
8.3 Digital Signage
8.3.1 Digital Signage Market Trends Analysis (2020-2032)
8.3.2 Digital Signage Market Size Estimates and Forecasts to 2032 (USD Billion)
8.4 Automotive Display
8.4.1 Automotive Display Market Trends Analysis (2020-2032)
8.4.2 Automotive Display Market Size Estimates and Forecasts to 2032 (USD Billion)
8.5 Others
8.5.1 Others Market Trends Analysis (2020-2032)
8.5.2 Others Market Size Estimates and Forecasts to 2032 (USD Billion)
9. Electronic Display Market Segmentation, By End User
9.1 Chapter Overview
9.2 Retail
9.2.1 Retail Market Trends Analysis (2020-2032)
9.2.2 Retail Market Size Estimates and Forecasts to 2032 (USD Billion)
9.3 Entertainment
9.3.1 Entertainment Market Trends Analysis (2020-2032)
9.3.2 Entertainment Market Size Estimates and Forecasts to 2032 (USD Billion)
9.4 Corporate
9.4.1 Corporate Market Trends Analysis (2020-2032)
9.4.2 Corporate Market Size Estimates and Forecasts to 2032 (USD Billion)
9.5 Healthcare
9.5.1 Healthcare Market Trends Analysis (2020-2032)
9.5.2 Healthcare Market Size Estimates and Forecasts to 2032 (USD Billion)
9.6 Government
9.6.1 Government Market Trends Analysis (2020-2032)
9.6.2 Government Market Size Estimates and Forecasts to 2032 (USD Billion)
10. Regional Analysis
10.1 Chapter Overview
10.2 North America
10.2.1 Trends Analysis
10.2.2 North America Electronic Display Market Estimates and Forecasts, by Country (2020-2032) (USD Billion)
10.2.3 North America Electronic Display Market Estimates and Forecasts, By Technology (2020-2032) (USD Billion)
10.2.4 North America Electronic Display Market Estimates and Forecasts, By Application (2020-2032) (USD Billion)
10.2.5 North America Electronic Display Market Estimates and Forecasts, By End User (2020-2032) (USD Billion)
10.2.6 USA
10.2.6.1 USA Electronic Display Market Estimates and Forecasts, By Technology (2020-2032) (USD Billion)
10.2.6.2 USA Electronic Display Market Estimates and Forecasts, By Application (2020-2032) (USD Billion)
10.2.6.3 USA Electronic Display Market Estimates and Forecasts, By End User (2020-2032) (USD Billion)
10.2.7 Canada
10.2.7.1 Canada Electronic Display Market Estimates and Forecasts, By Technology (2020-2032) (USD Billion)
10.2.7.2 Canada Electronic Display Market Estimates and Forecasts, By Application (2020-2032) (USD Billion)
10.2.7.3 Canada Electronic Display Market Estimates and Forecasts, By End User (2020-2032) (USD Billion)
10.2.8 Mexico
10.2.8.1 Mexico Electronic Display Market Estimates and Forecasts, By Technology (2020-2032) (USD Billion)
10.2.8.2 Mexico Electronic Display Market Estimates and Forecasts, By Application (2020-2032) (USD Billion)
10.2.8.3 Mexico Electronic Display Market Estimates and Forecasts, By End User (2020-2032) (USD Billion)
10.3 Europe
10.3.1 Eastern Europe
10.3.1.1 Trends Analysis
10.3.1.2 Eastern Europe Electronic Display Market Estimates and Forecasts, by Country (2020-2032) (USD Billion)
10.3.1.3 Eastern Europe Electronic Display Market Estimates and Forecasts, By Technology (2020-2032) (USD Billion)
10.3.1.4 Eastern Europe Electronic Display Market Estimates and Forecasts, By Application (2020-2032) (USD Billion)
10.3.1.5 Eastern Europe Electronic Display Market Estimates and Forecasts, By End User (2020-2032) (USD Billion)
10.3.1.6 Poland
10.3.1.6.1 Poland Electronic Display Market Estimates and Forecasts, By Technology (2020-2032) (USD Billion)
10.3.1.6.2 Poland Electronic Display Market Estimates and Forecasts, By Application (2020-2032) (USD Billion)
10.3.1.6.3 Poland Electronic Display Market Estimates and Forecasts, By End User (2020-2032) (USD Billion)
10.3.1.7 Romania
10.3.1.7.1 Romania Electronic Display Market Estimates and Forecasts, By Technology (2020-2032) (USD Billion)
10.3.1.7.2 Romania Electronic Display Market Estimates and Forecasts, By Application (2020-2032) (USD Billion)
10.3.1.7.3 Romania Electronic Display Market Estimates and Forecasts, By End User (2020-2032) (USD Billion)
10.3.1.8 Hungary
10.3.1.8.1 Hungary Electronic Display Market Estimates and Forecasts, By Technology (2020-2032) (USD Billion)
10.3.1.8.2 Hungary Electronic Display Market Estimates and Forecasts, By Application (2020-2032) (USD Billion)
10.3.1.8.3 Hungary Electronic Display Market Estimates and Forecasts, By End User (2020-2032) (USD Billion)
10.3.1.9 Turkey
10.3.1.9.1 Turkey Electronic Display Market Estimates and Forecasts, By Technology (2020-2032) (USD Billion)
10.3.1.9.2 Turkey Electronic Display Market Estimates and Forecasts, By Application (2020-2032) (USD Billion)
10.3.1.9.3 Turkey Electronic Display Market Estimates and Forecasts, By End User (2020-2032) (USD Billion)
10.3.1.10 Rest of Eastern Europe
10.3.1.10.1 Rest of Eastern Europe Electronic Display Market Estimates and Forecasts, By Technology (2020-2032) (USD Billion)
10.3.1.10.2 Rest of Eastern Europe Electronic Display Market Estimates and Forecasts, By Application (2020-2032) (USD Billion)
10.3.1.10.3 Rest of Eastern Europe Electronic Display Market Estimates and Forecasts, By End User (2020-2032) (USD Billion)
10.3.2 Western Europe
10.3.2.1 Trends Analysis
10.3.2.2 Western Europe Electronic Display Market Estimates and Forecasts, by Country (2020-2032) (USD Billion)
10.3.2.3 Western Europe Electronic Display Market Estimates and Forecasts, By Technology (2020-2032) (USD Billion)
10.3.2.4 Western Europe Electronic Display Market Estimates and Forecasts, By Application (2020-2032) (USD Billion)
10.3.2.5 Western Europe Electronic Display Market Estimates and Forecasts, By End User (2020-2032) (USD Billion)
10.3.2.6 Germany
10.3.2.6.1 Germany Electronic Display Market Estimates and Forecasts, By Technology (2020-2032) (USD Billion)
10.3.2.6.2 Germany Electronic Display Market Estimates and Forecasts, By Application (2020-2032) (USD Billion)
10.3.2.6.3 Germany Electronic Display Market Estimates and Forecasts, By End User (2020-2032) (USD Billion)
10.3.2.7 France
10.3.2.7.1 France Electronic Display Market Estimates and Forecasts, By Technology (2020-2032) (USD Billion)
10.3.2.7.2 France Electronic Display Market Estimates and Forecasts, By Application (2020-2032) (USD Billion)
10.3.2.7.3 France Electronic Display Market Estimates and Forecasts, By End User (2020-2032) (USD Billion)
10.3.2.8 UK
10.3.2.8.1 UK Electronic Display Market Estimates and Forecasts, By Technology (2020-2032) (USD Billion)
10.3.2.8.2 UK Electronic Display Market Estimates and Forecasts, By Application (2020-2032) (USD Billion)
10.3.2.8.3 UK Electronic Display Market Estimates and Forecasts, By End User (2020-2032) (USD Billion)
10.3.2.9 Italy
10.3.2.9.1 Italy Electronic Display Market Estimates and Forecasts, By Technology (2020-2032) (USD Billion)
10.3.2.9.2 Italy Electronic Display Market Estimates and Forecasts, By Application (2020-2032) (USD Billion)
10.3.2.9.3 Italy Electronic Display Market Estimates and Forecasts, By End User (2020-2032) (USD Billion)
10.3.2.10 Spain
10.3.2.10.1 Spain Electronic Display Market Estimates and Forecasts, By Technology (2020-2032) (USD Billion)
10.3.2.10.2 Spain Electronic Display Market Estimates and Forecasts, By Application (2020-2032) (USD Billion)
10.3.2.10.3 Spain Electronic Display Market Estimates and Forecasts, By End User (2020-2032) (USD Billion)
10.3.2.11 Netherlands
10.3.2.11.1 Netherlands Electronic Display Market Estimates and Forecasts, By Technology (2020-2032) (USD Billion)
10.3.2.11.2 Netherlands Electronic Display Market Estimates and Forecasts, By Application (2020-2032) (USD Billion)
10.3.2.11.3 Netherlands Electronic Display Market Estimates and Forecasts, By End User (2020-2032) (USD Billion)
10.3.2.12 Switzerland
10.3.2.12.1 Switzerland Electronic Display Market Estimates and Forecasts, By Technology (2020-2032) (USD Billion)
10.3.2.12.2 Switzerland Electronic Display Market Estimates and Forecasts, By Application (2020-2032) (USD Billion)
10.3.2.12.3 Switzerland Electronic Display Market Estimates and Forecasts, By End User (2020-2032) (USD Billion)
10.3.2.13 Austria
10.3.2.13.1 Austria Electronic Display Market Estimates and Forecasts, By Technology (2020-2032) (USD Billion)
10.3.2.13.2 Austria Electronic Display Market Estimates and Forecasts, By Application (2020-2032) (USD Billion)
10.3.2.13.3 Austria Electronic Display Market Estimates and Forecasts, By End User (2020-2032) (USD Billion)
10.3.2.14 Rest of Western Europe
10.3.2.14.1 Rest of Western Europe Electronic Display Market Estimates and Forecasts, By Technology (2020-2032) (USD Billion)
10.3.2.14.2 Rest of Western Europe Electronic Display Market Estimates and Forecasts, By Application (2020-2032) (USD Billion)
10.3.2.14.3 Rest of Western Europe Electronic Display Market Estimates and Forecasts, By End User (2020-2032) (USD Billion)
10.4 Asia-Pacific
10.4.1 Trends Analysis
10.4.2 Asia-Pacific Electronic Display Market Estimates and Forecasts, by Country (2020-2032) (USD Billion)
10.4.3 Asia-Pacific Electronic Display Market Estimates and Forecasts, By Technology (2020-2032) (USD Billion)
10.4.4 Asia-Pacific Electronic Display Market Estimates and Forecasts, By Application (2020-2032) (USD Billion)
10.4.5 Asia-Pacific Electronic Display Market Estimates and Forecasts, By End User (2020-2032) (USD Billion)
10.4.6 China
10.4.6.1 China Electronic Display Market Estimates and Forecasts, By Technology (2020-2032) (USD Billion)
10.4.6.2 China Electronic Display Market Estimates and Forecasts, By Application (2020-2032) (USD Billion)
10.4.6.3 China Electronic Display Market Estimates and Forecasts, By End User (2020-2032) (USD Billion)
10.4.7 India
10.4.7.1 India Electronic Display Market Estimates and Forecasts, By Technology (2020-2032) (USD Billion)
10.4.7.2 India Electronic Display Market Estimates and Forecasts, By Application (2020-2032) (USD Billion)
10.4.7.3 India Electronic Display Market Estimates and Forecasts, By End User (2020-2032) (USD Billion)
10.4.8 Japan
10.4.8.1 Japan Electronic Display Market Estimates and Forecasts, By Technology (2020-2032) (USD Billion)
10.4.8.2 Japan Electronic Display Market Estimates and Forecasts, By Application (2020-2032) (USD Billion)
10.4.8.3 Japan Electronic Display Market Estimates and Forecasts, By End User (2020-2032) (USD Billion)
10.4.9 South Korea
10.4.9.1 South Korea Electronic Display Market Estimates and Forecasts, By Technology (2020-2032) (USD Billion)
10.4.9.2 South Korea Electronic Display Market Estimates and Forecasts, By Application (2020-2032) (USD Billion)
10.4.9.3 South Korea Electronic Display Market Estimates and Forecasts, By End User (2020-2032) (USD Billion)
10.4.10 Vietnam
10.4.10.1 Vietnam Electronic Display Market Estimates and Forecasts, By Technology (2020-2032) (USD Billion)
10.4.10.2 Vietnam Electronic Display Market Estimates and Forecasts, By Application (2020-2032) (USD Billion)
10.4.10.3 Vietnam Electronic Display Market Estimates and Forecasts, By End User (2020-2032) (USD Billion)
10.4.11 Singapore
10.4.11.1 Singapore Electronic Display Market Estimates and Forecasts, By Technology (2020-2032) (USD Billion)
10.4.11.2 Singapore Electronic Display Market Estimates and Forecasts, By Application (2020-2032) (USD Billion)
10.4.11.3 Singapore Electronic Display Market Estimates and Forecasts, By End User (2020-2032) (USD Billion)
10.4.12 Australia
10.4.12.1 Australia Electronic Display Market Estimates and Forecasts, By Technology (2020-2032) (USD Billion)
10.4.12.2 Australia Electronic Display Market Estimates and Forecasts, By Application (2020-2032) (USD Billion)
10.4.12.3 Australia Electronic Display Market Estimates and Forecasts, By End User (2020-2032) (USD Billion)
10.4.13 Rest of Asia-Pacific
10.4.13.1 Rest of Asia-Pacific Electronic Display Market Estimates and Forecasts, By Technology (2020-2032) (USD Billion)
10.4.13.2 Rest of Asia-Pacific Electronic Display Market Estimates and Forecasts, By Application (2020-2032) (USD Billion)
10.4.13.3 Rest of Asia-Pacific Electronic Display Market Estimates and Forecasts, By End User (2020-2032) (USD Billion)
10.5 Middle East and Africa
10.5.1 Middle East
10.5.1.1 Trends Analysis
10.5.1.2 Middle East Electronic Display Market Estimates and Forecasts, by Country (2020-2032) (USD Billion)
10.5.1.3 Middle East Electronic Display Market Estimates and Forecasts, By Technology (2020-2032) (USD Billion)
10.5.1.4 Middle East Electronic Display Market Estimates and Forecasts, By Application (2020-2032) (USD Billion)
10.5.1.5 Middle East Electronic Display Market Estimates and Forecasts, By End User (2020-2032) (USD Billion)
10.5.1.6 UAE
10.5.1.6.1 UAE Electronic Display Market Estimates and Forecasts, By Technology (2020-2032) (USD Billion)
10.5.1.6.2 UAE Electronic Display Market Estimates and Forecasts, By Application (2020-2032) (USD Billion)
10.5.1.6.3 UAE Electronic Display Market Estimates and Forecasts, By End User (2020-2032) (USD Billion)
10.5.1.7 Egypt
10.5.1.7.1 Egypt Electronic Display Market Estimates and Forecasts, By Technology (2020-2032) (USD Billion)
10.5.1.7.2 Egypt Electronic Display Market Estimates and Forecasts, By Application (2020-2032) (USD Billion)
10.5.1.7.3 Egypt Electronic Display Market Estimates and Forecasts, By End User (2020-2032) (USD Billion)
10.5.1.8 Saudi Arabia
10.5.1.8.1 Saudi Arabia Electronic Display Market Estimates and Forecasts, By Technology (2020-2032) (USD Billion)
10.5.1.8.2 Saudi Arabia Electronic Display Market Estimates and Forecasts, By Application (2020-2032) (USD Billion)
10.5.1.8.3 Saudi Arabia Electronic Display Market Estimates and Forecasts, By End User (2020-2032) (USD Billion)
10.5.1.9 Qatar
10.5.1.9.1 Qatar Electronic Display Market Estimates and Forecasts, By Technology (2020-2032) (USD Billion)
10.5.1.9.2 Qatar Electronic Display Market Estimates and Forecasts, By Application (2020-2032) (USD Billion)
10.5.1.9.3 Qatar Electronic Display Market Estimates and Forecasts, By End User (2020-2032) (USD Billion)
10.5.1.10 Rest of Middle East
10.5.1.10.1 Rest of Middle East Electronic Display Market Estimates and Forecasts, By Technology (2020-2032) (USD Billion)
10.5.1.10.2 Rest of Middle East Electronic Display Market Estimates and Forecasts, By Application (2020-2032) (USD Billion)
10.5.1.10.3 Rest of Middle East Electronic Display Market Estimates and Forecasts, By End User (2020-2032) (USD Billion)
10.5.2 Africa
10.5.2.1 Trends Analysis
10.5.2.2 Africa Electronic Display Market Estimates and Forecasts, by Country (2020-2032) (USD Billion)
10.5.2.3 Africa Electronic Display Market Estimates and Forecasts, By Technology (2020-2032) (USD Billion)
10.5.2.4 Africa Electronic Display Market Estimates and Forecasts, By Application (2020-2032) (USD Billion)
10.5.2.5 Africa Electronic Display Market Estimates and Forecasts, By End User (2020-2032) (USD Billion)
10.5.2.6 South Africa
10.5.2.6.1 South Africa Electronic Display Market Estimates and Forecasts, By Technology (2020-2032) (USD Billion)
10.5.2.6.2 South Africa Electronic Display Market Estimates and Forecasts, By Application (2020-2032) (USD Billion)
10.5.2.6.3 South Africa Electronic Display Market Estimates and Forecasts, By End User (2020-2032) (USD Billion)
10.5.2.7 Nigeria
10.5.2.7.1 Nigeria Electronic Display Market Estimates and Forecasts, By Technology (2020-2032) (USD Billion)
10.5.2.7.2 Nigeria Electronic Display Market Estimates and Forecasts, By Application (2020-2032) (USD Billion)
10.5.2.7.3 Nigeria Electronic Display Market Estimates and Forecasts, By End User (2020-2032) (USD Billion)
10.5.2.8 Rest of Africa
10.5.2.8.1 Rest of Africa Electronic Display Market Estimates and Forecasts, By Technology (2020-2032) (USD Billion)
10.5.2.8.2 Rest of Africa Electronic Display Market Estimates and Forecasts, By Application (2020-2032) (USD Billion)
10.5.2.8.3 Rest of Africa Electronic Display Market Estimates and Forecasts, By End User (2020-2032) (USD Billion)
10.6 Latin America
10.6.1 Trends Analysis
10.6.2 Latin America Electronic Display Market Estimates and Forecasts, by Country (2020-2032) (USD Billion)
10.6.3 Latin America Electronic Display Market Estimates and Forecasts, By Technology (2020-2032) (USD Billion)
10.6.4 Latin America Electronic Display Market Estimates and Forecasts, By Application (2020-2032) (USD Billion)
10.6.5 Latin America Electronic Display Market Estimates and Forecasts, By End User (2020-2032) (USD Billion)
10.6.6 Brazil
10.6.6.1 Brazil Electronic Display Market Estimates and Forecasts, By Technology (2020-2032) (USD Billion)
10.6.6.2 Brazil Electronic Display Market Estimates and Forecasts, By Application (2020-2032) (USD Billion)
10.6.6.3 Brazil Electronic Display Market Estimates and Forecasts, By End User (2020-2032) (USD Billion)
10.6.7 Argentina
10.6.7.1 Argentina Electronic Display Market Estimates and Forecasts, By Technology (2020-2032) (USD Billion)
10.6.7.2 Argentina Electronic Display Market Estimates and Forecasts, By Application (2020-2032) (USD Billion)
10.6.7.3 Argentina Electronic Display Market Estimates and Forecasts, By End User (2020-2032) (USD Billion)
10.6.8 Colombia
10.6.8.1 Colombia Electronic Display Market Estimates and Forecasts, By Technology (2020-2032) (USD Billion)
10.6.8.2 Colombia Electronic Display Market Estimates and Forecasts, By Application (2020-2032) (USD Billion)
10.6.8.3 Colombia Electronic Display Market Estimates and Forecasts, By End User (2020-2032) (USD Billion)
10.6.9 Rest of Latin America
10.6.9.1 Rest of Latin America Electronic Display Market Estimates and Forecasts, By Technology (2020-2032) (USD Billion)
10.6.9.2 Rest of Latin America Electronic Display Market Estimates and Forecasts, By Application (2020-2032) (USD Billion)
10.6.9.3 Rest of Latin America Electronic Display Market Estimates and Forecasts, By End User (2020-2032) (USD Billion)
11. Company Profiles
11.1 Samsung Electronics
11.1.1 Company Overview
11.1.2 Financial
11.1.3 Products/ Services Offered
11.1.4 SWOT Analysis
11.2 LG Display
11.2.1 Company Overview
11.2.2 Financial
11.2.3 Products/ Services Offered
11.2.4 SWOT Analysis
11.3 Sony Corporation
11.3.1 Company Overview
11.3.2 Financial
11.3.3 Products/ Services Offered
11.3.4 SWOT Analysis
11.4 BOE Technology Group
11.4.1 Company Overview
11.4.2 Financial
11.4.3 Products/ Services Offered
11.4.4 SWOT Analysis
11.5 Panasonic Corporation
11.5.1 Company Overview
11.5.2 Financial
11.5.3 Products/ Services Offered
11.5.4 SWOT Analysis
11.6 AU Optronics
11.6.1 Company Overview
11.6.2 Financial
11.6.3 Products/ Services Offered
11.6.4 SWOT Analysis
11.7 Sharp Corporation
11.7.1 Company Overview
11.7.2 Financial
11.7.3 Products/ Services Offered
11.7.4 SWOT Analysis
11.8 TCL Technology
11.8.1 Company Overview
11.8.2 Financial
11.8.3 Products/ Services Offered
11.8.4 SWOT Analysis
11.9 Innolux Corporation
11.9.1 Company Overview
11.9.2 Financial
11.9.3 Products/ Services Offered
11.9.4 SWOT Analysis
11.10 Kyocera Corporation,
11.10.1 Company Overview
11.10.2 Financial
11.10.3 Products/ Services Offered
11.10.4 SWOT Analysis
12. Use Cases and Best Practices
13. Conclusion
An accurate research report requires proper strategizing as well as implementation. There are multiple factors involved in the completion of good and accurate research report and selecting the best methodology to compete the research is the toughest part. Since the research reports we provide play a crucial role in any company’s decision-making process, therefore we at SNS Insider always believe that we should choose the best method which gives us results closer to reality. This allows us to reach at a stage wherein we can provide our clients best and accurate investment to output ratio.
Each report that we prepare takes a timeframe of 350-400 business hours for production. Starting from the selection of titles through a couple of in-depth brain storming session to the final QC process before uploading our titles on our website we dedicate around 350 working hours. The titles are selected based on their current market cap and the foreseen CAGR and growth.
The 5 steps process:
Step 1: Secondary Research:
Secondary Research or Desk Research is as the name suggests is a research process wherein, we collect data through the readily available information. In this process we use various paid and unpaid databases which our team has access to and gather data through the same. This includes examining of listed companies’ annual reports, Journals, SEC filling etc. Apart from this our team has access to various associations across the globe across different industries. Lastly, we have exchange relationships with various university as well as individual libraries.

Step 2: Primary Research
When we talk about primary research, it is a type of study in which the researchers collect relevant data samples directly, rather than relying on previously collected data. This type of research is focused on gaining content specific facts that can be sued to solve specific problems. Since the collected data is fresh and first hand therefore it makes the study more accurate and genuine.
We at SNS Insider have divided Primary Research into 2 parts.
Part 1 wherein we interview the KOLs of major players as well as the upcoming ones across various geographic regions. This allows us to have their view over the market scenario and acts as an important tool to come closer to the accurate market numbers. As many as 45 paid and unpaid primary interviews are taken from both the demand and supply side of the industry to make sure we land at an accurate judgement and analysis of the market.
This step involves the triangulation of data wherein our team analyses the interview transcripts, online survey responses and observation of on filed participants. The below mentioned chart should give a better understanding of the part 1 of the primary interview.

Part 2: In this part of primary research the data collected via secondary research and the part 1 of the primary research is validated with the interviews from individual consultants and subject matter experts.
Consultants are those set of people who have at least 12 years of experience and expertise within the industry whereas Subject Matter Experts are those with at least 15 years of experience behind their back within the same space. The data with the help of two main processes i.e., FGDs (Focused Group Discussions) and IDs (Individual Discussions). This gives us a 3rd party nonbiased primary view of the market scenario making it a more dependable one while collation of the data pointers.
Step 3: Data Bank Validation
Once all the information is collected via primary and secondary sources, we run that information for data validation. At our intelligence centre our research heads track a lot of information related to the market which includes the quarterly reports, the daily stock prices, and other relevant information. Our data bank server gets updated every fortnight and that is how the information which we collected using our primary and secondary information is revalidated in real time.

Step 4: QA/QC Process
After all the data collection and validation our team does a final level of quality check and quality assurance to get rid of any unwanted or undesired mistakes. This might include but not limited to getting rid of the any typos, duplication of numbers or missing of any important information. The people involved in this process include technical content writers, research heads and graphics people. Once this process is completed the title gets uploader on our platform for our clients to read it.
Step 5: Final QC/QA Process:
This is the last process and comes when the client has ordered the study. In this process a final QA/QC is done before the study is emailed to the client. Since we believe in giving our clients a good experience of our research studies, therefore, to make sure that we do not lack at our end in any way humanly possible we do a final round of quality check and then dispatch the study to the client.
Key Segments:
By Technology
LCD
LED
OLED
Others
By Application
Consumer Electronics
Digital Signage
Automotive Display
Others
By End User
Retail
Entertainment
Corporate
Healthcare
Government
Request for Segment Customization as per your Business Requirement: Segment Customization Request
REGIONAL COVERAGE:
North America
US
Canada
Mexico
Europe
Eastern Europe
Poland
Romania
Hungary
Turkey
Rest of Eastern Europe
Western Europe
Germany
France
UK
Italy
Spain
Netherlands
Switzerland
Austria
Rest of Western Europe
Asia Pacific
China
India
Japan
South Korea
Vietnam
Singapore
Australia
Rest of Asia Pacific
Middle East & Africa
Middle East
UAE
Egypt
Saudi Arabia
Qatar
Rest of the Middle East
Africa
Nigeria
South Africa
Rest of Africa
Latin America
Brazil
Argentina
Colombia
Rest of Latin America
Request for Country Level Research Report: Country Level Customization Request
Available Customization
With the given market data, SNS Insider offers customization as per the company’s specific needs. The following customization options are available for the report:
Product Analysis
Criss-Cross segment analysis (e.g. Product X Application)
Product Matrix which gives a detailed comparison of the product portfolio of each company
Geographic Analysis
Additional countries in any of the regions
Company Information
Detailed analysis and profiling of additional market players (Up to five)
The Display Technology Market size was valued at USD 159.2 Billion in 2023 and is expected to grow to USD 215.09 Billion by 2032 and grow at a CAGR of 3.4 % over the forecast period of 2024-2032.
The Application Processor Market was valued at USD 37.43 billion in 2023 and is expected to reach USD 55.34 billion by 2032, growing at a CAGR of 4.47% over the forecast period 2024-2032.
The Routing Market Size was valued at USD 15.4 billion in 2023, and is expected to reach USD 33.44 billion by 2032, and grow at a CAGR of 9 % by 2024-2032.
The Fiber Optics Market Size was valued at USD 8.73 billion in 2023 and is expected to grow at a CAGR of 7.02% to reach USD 16.02 billion by 2032.
The Industrial IoT Display Market Size was valued at USD 1.0 Billion in 2023 and is expected to grow at a CAGR Of 12.47% to reach USD 2.88 Billion by 2032.
The Baggage Scanners Market Size was valued at USD 2.14 Billion in 2023 and is expected to reach USD 3.15 Billion by 2032 and grow at a CAGR of 4.15% over the forecast period 2024-2032.

Hi! Click one of our member below to chat on Phone
© 2025 All Rights Reserved by SNS Insider Pvt Ltd


