Elastomers Market Report Scope & Overview:
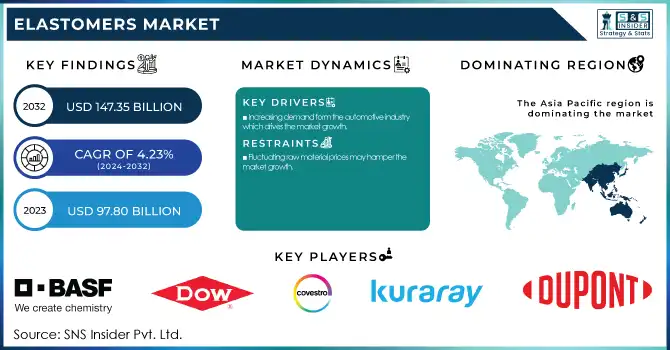
The Elastomers Market size was USD 97.80 Billion in 2023 and is expected to reach USD 147.35 Billion by 2032 and grow at a CAGR of 4.23% over the forecast period of 2024-2032. The report covers cost-efficient production and evolving pricing trends in raw materials like synthetic rubber and thermoplastic elastomers and provide the information related to the funding & investments in sustainable elastomers. It also provides the data related to the regulatory & policy impact in the elastomers market. Moreover, the report also focused on the merger and acquisition activity in the market and recent trends and upcoming trend related to the market.
To Get more information on Elastomers Market - Request Free Sample Report
Drivers
Increasing demand form the automotive industry which drives the market growth.
One of the most significant factors promoting market growth is the pace of demand from the automotive industry. Automotive elastomers (more specifically, thermoplastic elastomers (TPEs), styrene-butadiene rubbers (SBR), and nitrile butadiene rubbers (NBR) have emerged in automotive manufacturing over the decades as excellent durability, flexibility, heat, abrasion, and chemical resistant materials. These are utilized in a multitude of vehicle parts like seals, gaskets, hoses, tires, tray panels, and weatherstripping. The trend of lightweight materials that contribute to fuel efficiency (especially in the case of EVs) means that elastomers will also be increasingly in demand due to advancements in vehicle technology. These elastomers reduce device weight while maintaining strength and elasticity. The shift towards more sustainable solutions in the automotive industry has also fueled the growing demand for bio-based elastomers, which allow for higher sustainability without compromising performance.
Restraint
Fluctuating raw material prices may hamper the market growth.
The growth of the elastomers market is likely to be hindered by fluctuating raw material prices, which are one of the major factors impacting the elastomers market. The need for oil-based raw material is high for elastomers, especially synthetic rubbers such as styrene-butadiene rubber (SBR) and nitrile butadiene rubber (NBR). These material prices are subject to rapid up and down movement depending on many reasons including wars, disasters, supply chains and the world oil price changes. Higher prices for raw materials lead to higher production costs, which are ultimately translated into higher prices of elastomer products for manufacturers. In turn, this unemployability can make them non-competitive against alternative materials, especially in market segments with less price elasticity.
Opportunity
Rising demand for sustainable and bio-based elastomers which create the opportunity in the market.
The shift in consumer preference towards sustainability, as well as the increased use of bio-based materials resulting in the creation of elastomers, which can either decrease carbon emissions, or are obtained from renewable resources provide massive opportunities within the elastomers product. With the global focus on greener environments, sectors are becoming more on the lookout for substitutes for the traditional petroleum-based elastomers that have long been linked to carbon emissions, environmental degradation as well as high energy input-intensive processes. Based on renewable resources (natural rubber, soy-based oils and other bio-derived materials), bio-based elastomers provide a sustainable resource with a lower environmental impact. These elastomers help reduce dependence on fossil fuels and help manufacturers meet stricter environmental regulations and sustainability goals as well.
Challenges
Intense Competition may create the challenge for the market.
The intense competition is amongst the prominent challenges confronted by the market participants for elastomers, as they have to innovate and keep control over them for cost management. The global market is significantly competitive, with a large number of established players globally and an increasing number of new players entering the market, and competing for their fair share of the market. Big companies, however, have a lot of ways to benefit from economies of scale as well, so competitive prices and more efficient production can be expected from larger companies with a wealth of resources. This gives larger companies a competitive edge, ensconced in the stability that prevents smaller players from expanding, particularly through their niche or vertical offerings.
By Type
SBR (Styrene Block Copolymers) held the largest market share around 22% in 2023. SBR is one of the most cost-effective synthetic rubber grades and is suitable for many industries, including tires, automotive components, footwear, and industrial products. One of the most durable, flexible, and abrasion-resistant polymerized materials it is favored for most high demand applications. The automotive industry, where SBR finds its major applications in the production of tires, is a primary driver behind its market leadership. Moreover, the dominant share in other rubber products production such as gaskets, seals & hoses strengthens its position in the market.
By Application
Automotive segment held the largest market share around 42% in 2023. Increasing demand for durable, weather-resistant, and energy-efficient materials in construction projects. SBR, NBR, and TPU are elastomers that are important for the manufacture of high-performance parts including tires, seals, gaskets, hoses, weatherstripping, and vibration dampers. Such materials are preferred for their strength, flexibility, heat, and environmental resistance critical to automotive performance and safety. Continuous production of automotive vehicles, development of technologies in electric vehicle (EV) and changing demands of customers for comfort & safety features in vehicles are driving elastomers demand for automotive applications.
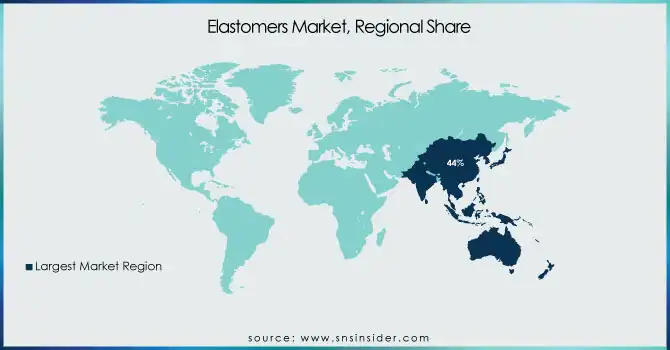
Asia Pacific held the largest market share around 44% in 2023. It is owing to rapid industrialization, growth of automotive sector, and developing manufacturing capabilities in the region. China, Japan, South Korea and India are the key countries in the elastomer market China is also a leading elastomer producer and a huge consumer globally. The expanding automotive industry in the region, especially China and India, is one of the leading contributors to the demand for elastomers, as they are essential for manufacturing tires, seals, gaskets, and such other automotive components.
North America held the significant market share in the elastomers market. The North America is majorly involved in innovation and technological advancement in elastomer materials and is very high in terms of R&D investment in it. Specialty elastomers, including thermoplastic elastomers (TPEs) and fluoroelastomers, used in high-demand applications in various sectors including aerospace, electronics, and healthcare, are also witnessing an upsurge in demand in the region.
In addition, North America is gaining traction for its increased focus on sustainability and regulatory pressures for sustainable development which is driving eco-friendly, bio-based elastomers in this region. Additionally, the strong supply chain coupled with the long history of manufacturing in the region continues to support growth of elastomers in North America.
Get Customized Report as per Your Business Requirement - Enquiry Now
Key Players
BASF SE (Elastollan, Styrolux)
Dow (ENGAGE™, NORDEL™)
Covestro AG (Desmopan, Baypren)
Kuraray Co., Ltd. (SEPTON™, HYBRAR™)
Huntsman International LLC (IROGRAN, VITROX)
DuPont de Nemours, Inc. (Vamac, Kalrez)
INEOS (Kraton, Keltan)
Asahi Kasei Corporation (Tufprene, Asaprene)
LANXESS AG (Therban, Levapren)
LG Chem (LUPOY, LUCENE)
ExxonMobil (Vistalon, Santoprene)
Arkema (Pebax, Kynar)
JSR Corporation (SBR, EPDM)
Zeon Corporation (Nipol, Zetpol)
Wacker Chemie AG (ELASTOSIL, SILPURAN)
Trinseo (CALIBRE, MAGNUM)
Evonik Industries (VESTAMID, VESTOPLAST)
Mitsui Chemicals, Inc. (TAFMER, MILASTOMER)
Kraton Corporation (Kraton G, Cariflex)
Teknor Apex Company (Monprene, Sarlink)
Recent Development:
In 2024, BASF launched Elastollan 1190A for applications requiring higher abrasion resistance and mechanical properties, specifically for the automotive sector.
In 2023, Huntsman unveiled IROGRAN 1130A, a new thermoplastic polyurethane elastomer designed for use in industrial applications, offering better chemical resistance and load-bearing capacity.
| Report Attributes | Details |
|---|---|
| Market Size in 2023 | USD 97.80 Billion |
| Market Size by 2032 | USD 147.35 Billion |
| CAGR | CAGR of 4.23% From 2024 to 2032 |
| Base Year | 2023 |
| Forecast Period | 2024-2032 |
| Historical Data | 2020-2022 |
| Report Scope & Coverage | Market Size, Segments Analysis, Competitive Landscape, Regional Analysis, DROC & SWOT Analysis, Forecast Outlook |
| Key Segments | • By Type (SBR (Styrene block copolymers), ACM (Acrylic Elastomer), EPM (Ethylene-propylene Elastomer), IIR (Butyl Elastomer), NBR (Nitrile Elastomer), TPU (Thermoplastic Polyurethanes), PEBA (Thermoplastic polyether block amides), SBC (Styrene block copolymers), TPO (Thermoplastic Polyolefin), TPV (Thermoplastic Vulcanizates) • By Application (Automotive, Consumer Goods, Medical, Industrial, Others) |
| Regional Analysis/Coverage | North America (US, Canada, Mexico), Europe (Eastern Europe [Poland, Romania, Hungary, Turkey, Rest of Eastern Europe] Western Europe] Germany, France, UK, Italy, Spain, Netherlands, Switzerland, Austria, Rest of Western Europe]), Asia Pacific (China, India, Japan, South Korea, Vietnam, Singapore, Australia, Rest of Asia Pacific), Middle East & Africa (Middle East [UAE, Egypt, Saudi Arabia, Qatar, Rest of Middle East], Africa [Nigeria, South Africa, Rest of Africa], Latin America (Brazil, Argentina, Colombia, Rest of Latin America) |
| Company Profiles | BASF SE, Dow, Covestro AG, Kuraray Co., Ltd., Huntsman International LLC, DuPont de Nemours, Inc., INEOS, Asahi Kasei Corporation, LANXESS AG, LG Chem, ExxonMobil, Arkema, JSR Corporation, Zeon Corporation, Wacker Chemie AG, Trinseo, Evonik Industries, Mitsui Chemicals, Inc., Kraton Corporation, Teknor Apex Company |
Ans: The Elastomers Market was valued at USD 97.80 Billion in 2023.
Ans: The expected CAGR of the global Elastomers Market during the forecast period is 4.23%.
Ans: The Automotive will grow rapidly in the Elastomers Market from 2024-2032.
Ans: Increasing demand form the automotive industry which drives the market growth.
Ans: Asia Pacific led the Elastomers Market in the region with the highest revenue share in 2023.
Table of Contents:
1. Introduction
1.1 Market Definition
1.2 Scope (Inclusion and Exclusions)
1.3 Research Assumptions
2. Executive Summary
2.1 Market Overview
2.2 Regional Synopsis
2.3 Competitive Summary
3. Research Methodology
3.1 Top-Down Approach
3.2 Bottom-up Approach
3.3. Data Validation
3.4 Primary Interviews
4. Market Dynamics Impact Analysis
3.1 Market Driving Factors Analysis
3.1.2 Drivers
3.1.2 Restraints
3.1.3 Opportunities
3.1.4 Challenges
3.2 PESTLE Analysis
3.3 Porter’s Five Forces Model
5. Statistical Insights and Trends Reporting
5.1 Production Capacity and Utilization, by Country, By Type, 2023
5.2 Feedstock Prices, by Country, By Type, 2023
5.3 Regulatory Impact, by Country, By Type 2023.
5.4 Environmental Metrics: Emissions Data, Waste Management Practices, and Sustainability Initiatives, by Region
5.5 Innovation and R&D, Type, 2023
6. Competitive Landscape
6.1 List of Major Companies, By Region
6.2 Market Share Analysis, By Region
6.3 Product Benchmarking
6.3.1 Product specifications and features
6.3.2 Pricing
6.4 Strategic Initiatives
6.4.1 Marketing and promotional activities
6.4.2 Distribution and Supply Chain Strategies
6.4.3 Expansion Plans and New Product Launches
6.4.4 Strategic partnerships and collaborations
6.5 Technological Advancements
6.6 Market Positioning and Branding
7. Elastomers Market Segmentation, By Type
7.1 Chapter Overview
7.2 SBR (Styrene block copolymers)
7.2.1 SBR (Styrene block copolymers) Trends Analysis (2020-2032)
7.2.2 SBR (Styrene block copolymers) Market Size Estimates and Forecasts to 2032 (USD Million)
7.3 ACM (Acrylic Elastomer)
7.3.1 ACM (Acrylic Elastomer) Market Trends Analysis (2020-2032)
7.3.2 ACM (Acrylic Elastomer) Market Size Estimates and Forecasts to 2032 (USD Million)
7.4 EPM (Ethylene-propylene Elastomer)
7.4.1 EPM (Ethylene-propylene Elastomer) Trends Analysis (2020-2032)
7.4.2 EPM (Ethylene-propylene Elastomer) Market Size Estimates and Forecasts to 2032 (USD Million)
7.5 IIR (Butyl Elastomer)
7.5.1 IIR (Butyl Elastomer) Market Trends Analysis (2020-2032)
7.5.2 IIR (Butyl Elastomer) Market Size Estimates and Forecasts to 2032 (USD Million)
7.6 NBR (Nitrile Elastomer)
7.6.1 NBR (Nitrile Elastomer) Trends Analysis (2020-2032)
7.6.2 NBR (Nitrile Elastomer) Market Size Estimates and Forecasts to 2032 (USD Million)
7.7 TPU (Thermoplastic Polyurethanes)
7.7.1 TPU (Thermoplastic Polyurethanes) Market Trends Analysis (2020-2032)
7.7.2 TPU (Thermoplastic Polyurethanes) Market Size Estimates and Forecasts to 2032 (USD Million)
7.8 PEBA (Thermoplastic polyether block amides)
7.8.1 PEBA (Thermoplastic polyether block amides) Market Trends Analysis (2020-2032)
7.8.2 PEBA (Thermoplastic polyether block amides) Market Size Estimates and Forecasts to 2032 (USD Million)
7.9 SBC (Styrene block copolymers)
7.9.1 SBC (Styrene block copolymers) Market Trends Analysis (2020-2032)
7.9.2 SBC (Styrene block copolymers) Market Size Estimates and Forecasts to 2032 (USD Million)
7.10 TPO (Thermoplastic Polyolefin)
7.10.1 TPO (Thermoplastic Polyolefin) Market Trends Analysis (2020-2032)
7.10.2 TPO (Thermoplastic Polyolefin) Market Size Estimates and Forecasts to 2032 (USD Million)
7.11 TPV (Thermoplastic Vulcanizates)
7.11.1 TPV (Thermoplastic Vulcanizates) Market Trends Analysis (2020-2032)
7.11.2 TPV (Thermoplastic Vulcanizates) Market Size Estimates and Forecasts to 2032 (USD Million)
8. Elastomers Market Segmentation, by Application
8.1 Chapter Overview
8.2 Automotive
8.2.1 Automotive Market Trends Analysis (2020-2032)
8.2.2 Automotive Market Size Estimates and Forecasts to 2032 (USD Million)
8.3 Consumer Goods
8.3.1 Consumer Goods Market Trends Analysis (2020-2032)
8.3.2 Consumer Goods Market Size Estimates and Forecasts to 2032 (USD Million)
8.4 Medical
8.4.1 Medical Market Trends Analysis (2020-2032)
8.4.2 Medical Market Size Estimates and Forecasts to 2032 (USD Million)
8.5 Industrial
8.5.1 Industrial Market Trends Analysis (2020-2032)
8.5.2 Industrial Market Size Estimates and Forecasts to 2032 (USD Million)
8.6 Others
8.6.1 Others Market Trends Analysis (2020-2032)
8.6.2 Others Market Size Estimates and Forecasts to 2032 (USD Million)
9. Regional Analysis
9.1 Chapter Overview
9.2 North America
9.2.1 Trends Analysis
9.2.2 North America Elastomers Market Estimates and Forecasts, by Country (2020-2032) (USD Million)
9.2.3 North America Elastomers Market Estimates and Forecasts, By Type (2020-2032) (USD Million)
9.2.4 North America Elastomers Market Estimates and Forecasts, by Application (2020-2032) (USD Million)
9.2.5 USA
9.2.5.1 USA Elastomers Market Estimates and Forecasts, By Type (2020-2032) (USD Million)
9.2.5.2 USA Elastomers Market Estimates and Forecasts, by Application (2020-2032) (USD Million)
9.2.6 Canada
9.2.6.1 Canada Elastomers Market Estimates and Forecasts, By Type (2020-2032) (USD Million)
9.2.6.2 Canada Elastomers Market Estimates and Forecasts, by Application (2020-2032) (USD Million)
9.2.7 Mexico
9.2.7.1 Mexico Elastomers Market Estimates and Forecasts, By Type (2020-2032) (USD Million)
9.2.7.2 Mexico Elastomers Market Estimates and Forecasts, by Application (2020-2032) (USD Million)
9.3 Europe
9.3.1 Eastern Europe
9.3.1.1 Trends Analysis
9.3.1.2 Eastern Europe Elastomers Market Estimates and Forecasts, by Country (2020-2032) (USD Million)
9.3.1.3 Eastern Europe Elastomers Market Estimates and Forecasts, By Type (2020-2032) (USD Million)
9.3.1.4 Eastern Europe Elastomers Market Estimates and Forecasts, by Application (2020-2032) (USD Million)
9.3.1.5 Poland
9.3.1.5.1 Poland Elastomers Market Estimates and Forecasts, By Type (2020-2032) (USD Million)
9.3.1.5.2 Poland Elastomers Market Estimates and Forecasts, by Application (2020-2032) (USD Million)
9.3.1.6 Romania
9.3.1.6.1 Romania Elastomers Market Estimates and Forecasts, By Type (2020-2032) (USD Million)
9.3.1.6.2 Romania Elastomers Market Estimates and Forecasts, by Application (2020-2032) (USD Million)
9.3.1.7 Hungary
9.3.1.7.1 Hungary Elastomers Market Estimates and Forecasts, By Type (2020-2032) (USD Million)
9.3.1.7.2 Hungary Elastomers Market Estimates and Forecasts, by Application (2020-2032) (USD Million)
9.3.1.8 Turkey
9.3.1.8.1 Turkey Elastomers Market Estimates and Forecasts, By Type (2020-2032) (USD Million)
9.3.1.8.2 Turkey Elastomers Market Estimates and Forecasts, by Application (2020-2032) (USD Million)
9.3.1.9 Rest of Eastern Europe
9.3.1.9.1 Rest of Eastern Europe Elastomers Market Estimates and Forecasts, By Type (2020-2032) (USD Million)
9.3.1.9.2 Rest of Eastern Europe Elastomers Market Estimates and Forecasts, by Application (2020-2032) (USD Million)
9.3.2 Western Europe
9.3.2.1 Trends Analysis
9.3.2.2 Western Europe Elastomers Market Estimates and Forecasts, by Country (2020-2032) (USD Million)
9.3.2.3 Western Europe Elastomers Market Estimates and Forecasts, By Type (2020-2032) (USD Million)
9.3.2.4 Western Europe Elastomers Market Estimates and Forecasts, by Application (2020-2032) (USD Million)
9.3.2.5 Germany
9.3.2.5.1 Germany Elastomers Market Estimates and Forecasts, By Type (2020-2032) (USD Million)
9.3.2.5.2 Germany Elastomers Market Estimates and Forecasts, by Application (2020-2032) (USD Million)
9.3.2.6 France
9.3.2.6.1 France Elastomers Market Estimates and Forecasts, By Type (2020-2032) (USD Million)
9.3.2.6.2 France Elastomers Market Estimates and Forecasts, by Application (2020-2032) (USD Million)
9.3.2.7 UK
9.3.2.7.1 UK Elastomers Market Estimates and Forecasts, By Type (2020-2032) (USD Million)
9.3.2.7.2 UK Elastomers Market Estimates and Forecasts, by Application (2020-2032) (USD Million)
9.3.2.8 Italy
9.3.2.8.1 Italy Elastomers Market Estimates and Forecasts, By Type (2020-2032) (USD Million)
9.3.2.8.2 Italy Elastomers Market Estimates and Forecasts, by Application (2020-2032) (USD Million)
9.3.2.9 Spain
9.3.2.9.1 Spain Elastomers Market Estimates and Forecasts, By Type (2020-2032) (USD Million)
9.3.2.9.2 Spain Elastomers Market Estimates and Forecasts, by Application (2020-2032) (USD Million)
9.3.2.10 Netherlands
9.3.2.10.1 Netherlands Elastomers Market Estimates and Forecasts, By Type (2020-2032) (USD Million)
9.3.2.10.2 Netherlands Elastomers Market Estimates and Forecasts, by Application (2020-2032) (USD Million)
9.3.2.11 Switzerland
9.3.2.11.1 Switzerland Elastomers Market Estimates and Forecasts, By Type (2020-2032) (USD Million)
9.3.2.11.2 Switzerland Elastomers Market Estimates and Forecasts, by Application (2020-2032) (USD Million)
9.3.2.12 Austria
9.3.2.12.1 Austria Elastomers Market Estimates and Forecasts, By Type (2020-2032) (USD Million)
9.3.2.12.2 Austria Elastomers Market Estimates and Forecasts, by Application (2020-2032) (USD Million)
9.3.2.13 Rest of Western Europe
9.3.2.13.1 Rest of Western Europe Elastomers Market Estimates and Forecasts, By Type (2020-2032) (USD Million)
9.3.2.13.2 Rest of Western Europe Elastomers Market Estimates and Forecasts, by Application (2020-2032) (USD Million)
9.4 Asia Pacific
9.4.1 Trends Analysis
9.4.2 Asia Pacific Elastomers Market Estimates and Forecasts, by Country (2020-2032) (USD Million)
9.4.3 Asia Pacific Elastomers Market Estimates and Forecasts, By Type (2020-2032) (USD Million)
9.4.4 Asia Pacific Elastomers Market Estimates and Forecasts, by Application (2020-2032) (USD Million)
9.4.5 China
9.4.5.1 China Elastomers Market Estimates and Forecasts, By Type (2020-2032) (USD Million)
9.4.5.2 China Elastomers Market Estimates and Forecasts, by Application (2020-2032) (USD Million)
9.4.6 India
9.4.5.1 India Elastomers Market Estimates and Forecasts, By Type (2020-2032) (USD Million)
9.4.5.2 India Elastomers Market Estimates and Forecasts, by Application (2020-2032) (USD Million)
9.4.5 Japan
9.4.5.1 Japan Elastomers Market Estimates and Forecasts, By Type (2020-2032) (USD Million)
9.4.5.2 Japan Elastomers Market Estimates and Forecasts, by Application (2020-2032) (USD Million)
9.4.6 South Korea
9.4.6.1 South Korea Elastomers Market Estimates and Forecasts, By Type (2020-2032) (USD Million)
9.4.6.2 South Korea Elastomers Market Estimates and Forecasts, by Application (2020-2032) (USD Million)
9.4.7 Vietnam
9.4.7.1 Vietnam Elastomers Market Estimates and Forecasts, By Type (2020-2032) (USD Million)
9.2.7.2 Vietnam Elastomers Market Estimates and Forecasts, by Application (2020-2032) (USD Million)
9.4.8 Singapore
9.4.8.1 Singapore Elastomers Market Estimates and Forecasts, By Type (2020-2032) (USD Million)
9.4.8.2 Singapore Elastomers Market Estimates and Forecasts, by Application (2020-2032) (USD Million)
9.4.9 Australia
9.4.9.1 Australia Elastomers Market Estimates and Forecasts, By Type (2020-2032) (USD Million)
9.4.9.2 Australia Elastomers Market Estimates and Forecasts, by Application (2020-2032) (USD Million)
9.4.10 Rest of Asia Pacific
9.4.10.1 Rest of Asia Pacific Elastomers Market Estimates and Forecasts, By Type (2020-2032) (USD Million)
9.4.10.2 Rest of Asia Pacific Elastomers Market Estimates and Forecasts, by Application (2020-2032) (USD Million)
9.5 Middle East and Africa
9.5.1 Middle East
9.5.1.1 Trends Analysis
9.5.1.2 Middle East Elastomers Market Estimates and Forecasts, by Country (2020-2032) (USD Million)
9.5.1.3 Middle East Elastomers Market Estimates and Forecasts, By Type (2020-2032) (USD Million)
9.5.1.4 Middle East Elastomers Market Estimates and Forecasts, by Application (2020-2032) (USD Million)
9.5.1.5 UAE
9.5.1.5.1 UAE Elastomers Market Estimates and Forecasts, By Type (2020-2032) (USD Million)
9.5.1.5.2 UAE Elastomers Market Estimates and Forecasts, by Application (2020-2032) (USD Million)
9.5.1.6 Egypt
9.5.1.6.1 Egypt Elastomers Market Estimates and Forecasts, By Type (2020-2032) (USD Million)
9.5.1.6.2 Egypt Elastomers Market Estimates and Forecasts, by Application (2020-2032) (USD Million)
9.5.1.7 Saudi Arabia
9.5.1.7.1 Saudi Arabia Elastomers Market Estimates and Forecasts, By Type (2020-2032) (USD Million)
9.5.1.7.2 Saudi Arabia Elastomers Market Estimates and Forecasts, by Application (2020-2032) (USD Million)
9.5.1.8 Qatar
9.5.1.8.1 Qatar Elastomers Market Estimates and Forecasts, By Type (2020-2032) (USD Million)
9.5.1.8.2 Qatar Elastomers Market Estimates and Forecasts, by Application (2020-2032) (USD Million)
9.5.1.9 Rest of Middle East
9.5.1.9.1 Rest of Middle East Elastomers Market Estimates and Forecasts, By Type (2020-2032) (USD Million)
9.5.1.9.2 Rest of Middle East Elastomers Market Estimates and Forecasts, by Application (2020-2032) (USD Million)
9.5.2 Africa
9.5.2.1 Trends Analysis
9.5.2.2 Africa Elastomers Market Estimates and Forecasts, by Country (2020-2032) (USD Million)
9.5.2.3 Africa Elastomers Market Estimates and Forecasts, By Type (2020-2032) (USD Million)
9.5.2.4 Africa Elastomers Market Estimates and Forecasts, by Application (2020-2032) (USD Million)
9.5.2.5 South Africa
9.5.2.5.1 South Africa Elastomers Market Estimates and Forecasts, By Type (2020-2032) (USD Million)
9.5.2.5.2 South Africa Elastomers Market Estimates and Forecasts, by Application (2020-2032) (USD Million)
9.5.2.6 Nigeria
9.5.2.6.1 Nigeria Elastomers Market Estimates and Forecasts, By Type (2020-2032) (USD Million)
9.5.2.6.2 Nigeria Elastomers Market Estimates and Forecasts, by Application (2020-2032) (USD Million)
9.6 Latin America
9.6.1 Trends Analysis
9.6.2 Latin America Elastomers Market Estimates and Forecasts, by Country (2020-2032) (USD Million)
9.6.3 Latin America Elastomers Market Estimates and Forecasts, By Type (2020-2032) (USD Million)
9.6.4 Latin America Elastomers Market Estimates and Forecasts, by Application (2020-2032) (USD Million)
9.6.5 Brazil
9.6.5.1 Brazil Elastomers Market Estimates and Forecasts, By Type (2020-2032) (USD Million)
9.6.5.2 Brazil Elastomers Market Estimates and Forecasts, by Application (2020-2032) (USD Million)
9.6.6 Argentina
9.6.6.1 Argentina Elastomers Market Estimates and Forecasts, By Type (2020-2032) (USD Million)
9.6.6.2 Argentina Elastomers Market Estimates and Forecasts, by Application (2020-2032) (USD Million)
9.6.7 Colombia
9.6.7.1 Colombia Elastomers Market Estimates and Forecasts, By Type (2020-2032) (USD Million)
9.6.7.2 Colombia Elastomers Market Estimates and Forecasts, by Application (2020-2032) (USD Million)
9.6.8 Rest of Latin America
9.6.8.1 Rest of Latin America Elastomers Market Estimates and Forecasts, By Type (2020-2032) (USD Million)
9.6.8.2 Rest of Latin America Elastomers Market Estimates and Forecasts, by Application (2020-2032) (USD Million)
10. Company Profiles
10.1 BASF SE
10.1.1 Company Overview
10.1.2 Financial
10.1.3 Product / Services Offered
10.1.4 SWOT Analysis
10.2 Dow
10.2.1 Company Overview
10.2.2 Financial
10.2.3 Product/ Services Offered
10.2.4 SWOT Analysis
10.3 Covestro AG
10.3.1 Company Overview
10.3.2 Financial
10.3.3 Product/ Services Offered
10.3.4 SWOT Analysis
10.4 Kuraray Co., Ltd.
10.4.1 Company Overview
10.4.2 Financial
10.4.3 Product/ Services Offered
10.4.4 SWOT Analysis
10.5 Huntsman International LLC
10.5.1 Company Overview
10.5.2 Financial
10.5.3 Product/ Services Offered
10.5.4 SWOT Analysis
10.6 DuPont de Nemours, Inc.
10.6.1 Company Overview
10.6.2 Financial
10.6.3 Product/ Services Offered
10.6.4 SWOT Analysis
10.7 INEOS
10.7.1 Company Overview
10.7.2 Financial
10.7.3 Product/ Services Offered
10.7.4 SWOT Analysis
10.8 Asahi Kasei Corporation
10.8.1 Company Overview
10.8.2 Financial
10.8.3 Product/ Services Offered
10.8.4 SWOT Analysis
10.9 LANXESS AG
10.9.1 Company Overview
10.9.2 Financial
10.9.3 Product/ Services Offered
10.9.4 SWOT Analysis
10.10 LG Chem
10.10.1 Company Overview
10.10.2 Financial
10.10.3 Product/ Services Offered
10.10.4 SWOT Analysis
11. Use Cases and Best Practices
12. Conclusion
An accurate research report requires proper strategizing as well as implementation. There are multiple factors involved in the completion of good and accurate research report and selecting the best methodology to compete the research is the toughest part. Since the research reports we provide play a crucial role in any company’s decision-making process, therefore we at SNS Insider always believe that we should choose the best method which gives us results closer to reality. This allows us to reach at a stage wherein we can provide our clients best and accurate investment to output ratio.
Each report that we prepare takes a timeframe of 350-400 business hours for production. Starting from the selection of titles through a couple of in-depth brain storming session to the final QC process before uploading our titles on our website we dedicate around 350 working hours. The titles are selected based on their current market cap and the foreseen CAGR and growth.
The 5 steps process:
Step 1: Secondary Research:
Secondary Research or Desk Research is as the name suggests is a research process wherein, we collect data through the readily available information. In this process we use various paid and unpaid databases which our team has access to and gather data through the same. This includes examining of listed companies’ annual reports, Journals, SEC filling etc. Apart from this our team has access to various associations across the globe across different industries. Lastly, we have exchange relationships with various university as well as individual libraries.

Step 2: Primary Research
When we talk about primary research, it is a type of study in which the researchers collect relevant data samples directly, rather than relying on previously collected data. This type of research is focused on gaining content specific facts that can be sued to solve specific problems. Since the collected data is fresh and first hand therefore it makes the study more accurate and genuine.
We at SNS Insider have divided Primary Research into 2 parts.
Part 1 wherein we interview the KOLs of major players as well as the upcoming ones across various geographic regions. This allows us to have their view over the market scenario and acts as an important tool to come closer to the accurate market numbers. As many as 45 paid and unpaid primary interviews are taken from both the demand and supply side of the industry to make sure we land at an accurate judgement and analysis of the market.
This step involves the triangulation of data wherein our team analyses the interview transcripts, online survey responses and observation of on filed participants. The below mentioned chart should give a better understanding of the part 1 of the primary interview.

Part 2: In this part of primary research the data collected via secondary research and the part 1 of the primary research is validated with the interviews from individual consultants and subject matter experts.
Consultants are those set of people who have at least 12 years of experience and expertise within the industry whereas Subject Matter Experts are those with at least 15 years of experience behind their back within the same space. The data with the help of two main processes i.e., FGDs (Focused Group Discussions) and IDs (Individual Discussions). This gives us a 3rd party nonbiased primary view of the market scenario making it a more dependable one while collation of the data pointers.
Step 3: Data Bank Validation
Once all the information is collected via primary and secondary sources, we run that information for data validation. At our intelligence centre our research heads track a lot of information related to the market which includes the quarterly reports, the daily stock prices, and other relevant information. Our data bank server gets updated every fortnight and that is how the information which we collected using our primary and secondary information is revalidated in real time.

Step 4: QA/QC Process
After all the data collection and validation our team does a final level of quality check and quality assurance to get rid of any unwanted or undesired mistakes. This might include but not limited to getting rid of the any typos, duplication of numbers or missing of any important information. The people involved in this process include technical content writers, research heads and graphics people. Once this process is completed the title gets uploader on our platform for our clients to read it.
Step 5: Final QC/QA Process:
This is the last process and comes when the client has ordered the study. In this process a final QA/QC is done before the study is emailed to the client. Since we believe in giving our clients a good experience of our research studies, therefore, to make sure that we do not lack at our end in any way humanly possible we do a final round of quality check and then dispatch the study to the client.
Key Segments:
By Type
SBR (Styrene block copolymers)
ACM (Acrylic Elastomer)
EPM (Ethylene-propylene Elastomer)
IIR (Butyl Elastomer)
NBR (Nitrile Elastomer)
TPU (Thermoplastic Polyurethanes)
PEBA (Thermoplastic polyether block amides)
SBC (Styrene block copolymers)
TPO (Thermoplastic Polyolefin)
TPV (Thermoplastic Vulcanizates)
By Application
Automotive
Consumer Goods
Medical
Industrial
Others
Request for Segment Customization as per your Business Requirement: Segment Customization Request
Regional Coverage:
North America
US
Canada
Mexico
Europe
Eastern Europe
Poland
Romania
Hungary
Turkey
Rest of Eastern Europe
Western Europe
Germany
France
UK
Italy
Spain
Netherlands
Switzerland
Austria
Rest of Western Europe
Asia Pacific
China
India
Japan
South Korea
Vietnam
Singapore
Australia
Rest of Asia Pacific
Middle East & Africa
Middle East
UAE
Egypt
Saudi Arabia
Qatar
Rest of Middle East
Africa
Nigeria
South Africa
Rest of Africa
Latin America
Brazil
Argentina
Colombia
Rest of Latin America
Request for Country Level Research Report: Country Level Customization Request
Available Customization
With the given market data, SNS Insider offers customization as per the company’s specific needs. The following customization options are available for the report:
Detailed Volume Analysis
Criss-Cross segment analysis (e.g. Product X Application)
Competitive Product Benchmarking
Geographic Analysis
Additional countries in any of the regions
Customized Data Representation
Detailed analysis and profiling of additional market players
UV Curable Coatings Market size was USD 8.21 Billion in 2023 and is expected to reach USD 20.94 Billion by 2032, growing at a CAGR of 10.97% from 2024-2032.
The Cyanoacrylate Adhesives market size was USD 2.35 Billion in 2023 and is expected to touch USD 3.88 Billion by 2032, at a CAGR of 5.73 % from 2024 to 2032.
The Thermal conductive polymer material Market size was USD 155.7 million in 2023 and is expected to Reach USD 456.9 million by 2032 and grow at a CAGR of 12.7% over the forecast period of 2024-2032.
The Cashew Nutshell Liquid Market size was valued at USD 431.33 million in 2023 and is expected to reach USD 821.26 million by 2032, growing at a CAGR of 7.42% over the forecast period of 2024-2032.
The Acetonitrile Market size was USD 414.94 Million in 2023 and is expected to reach USD 692.74 Million by 2032, growing at a CAGR of 5.86 % from 2024-2032.
Hydrodesulfurization Catalysts Market was valued at USD 2.91 billion in 2023 and is expected to reach USD 4.20 billion by 2032, at a CAGR of 4.20% by 2024-2032.

Hi! Click one of our member below to chat on Phone
© 2025 All Rights Reserved by SNS Insider Pvt Ltd


