Get More Information on Edutainment Market - Request Sample Report
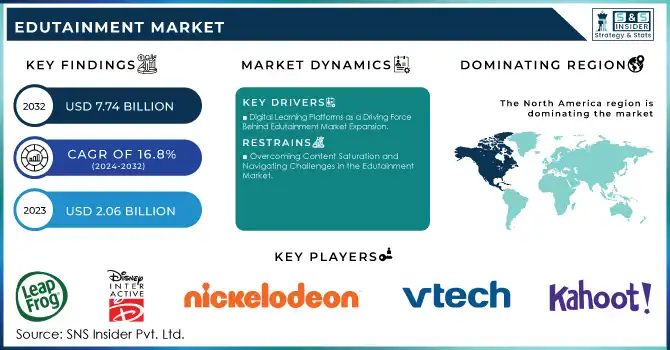
The Edutainment Market Size was valued at USD 2.06 billion in 2023 and is projected to reach USD 7.74 billion in 2032 with a growing CAGR of 16.8% Over the Forecast Period of 2024-2032.
The edutainment market has experienced significant growth recently, driven by the increasing demand for interactive and immersive learning experiences. Traditional educational methods, which focused on passive learning, have evolved due to technological innovations and changing expectations from educators and learners alike. The introduction of technologies such as gamification, virtual reality (VR), and augmented reality (AR) has accelerated the popularity of edutainment, blending education with entertainment to create engaging and dynamic learning environments. This shift is particularly evident across digital platforms like apps, games, and educational videos, which offer active participation and improved knowledge retention. For instance, VR allows learners to immerse themselves in historical events or conduct virtual science experiments, transforming education into an engaging experience. Additionally, gamification motivates learners by incorporating game-like elements such as points, rewards, and challenges, encouraging continuous progress.
This demand for edutainment has also impacted social media strategies, with brands increasingly adopting these methods to engage audiences. A remarkable 66% of social media users consider edutainment to be the most engaging form of brand content, surpassing skits, memes, or serialized content. Platforms like Instagram, YouTube, and TikTok provide ideal environments for these interactive educational experiences. 84% of social media users are on Instagram, the leading network, while 78% of social users have a YouTube profile, indicating a large audience for brands to target. 51% of YouTube users are more likely to engage with long-form videos from brands, and 31-60 second videos on the platform are the second most preferred content type. Furthermore, 54% of TikTok users engage with branded content at least once a day, underscoring the potential for brands to leverage these platforms. Additionally, 15% of survey respondents report having a Threads profile, suggesting a growing interest in emerging platforms for edutainment content. These statistics reflect the increasing integration of edutainment strategies across various social media channels, amplifying its relevance in today’s digital and learning landscapes.
Drivers
Digital Learning Platforms as a Driving Force Behind Edutainment Market Expansion
The surge in the popularity of digital learning platforms has greatly contributed to the rise of interactive, gamified, and engaging educational tools, especially among young learners. This transformation has made learning more enjoyable and effective, utilizing technologies such as gamification, virtual reality (VR), and augmented reality (AR). These immersive methods not only captivate students but also improve knowledge retention, reshaping the traditional educational landscape. Online learning, which has seen a staggering 900% growth since its inception in 2000, is now the fastest-growing segment in the education sector. Research indicates that 49% of students have participated in online learning, and 70% of them believe it’s superior to traditional classroom learning., with businesses also increasingly adopting online training solutions-80% of companies now offer such programs. Furthermore, online learning can significantly enhance retention rates, boosting them by up to 50%, and reduce the time required to learn a subject by 40% to 60. China, the second-largest market, is expected to grow to USD 171 billion by the same year. This rapid growth, accelerated by the COVID-19 pandemic, is expected to continue, with online learning projected to expand by more than 200% from 2020 to 2025. The continued rise of online education platforms and tools indicates a strong shift toward digital, interactive learning environments.
Restraints
Overcoming Content Saturation and Navigating Challenges in the Edutainment Market
Content saturation is a significant restraint in the edutainment market, particularly as the number of digital learning platforms and educational content continues to grow exponentially. With more content creators and platforms emerging, distinguishing high-quality educational experiences from the sheer volume of offerings becomes increasingly difficult for both learners and educators. This oversaturation risks diluting the effectiveness of digital learning tools, as users may struggle to find engaging, credible, and valuable educational resources. 62% of consumers feel overwhelmed by the amount of content they encounter daily, which highlights the challenge of standing out in an overcrowded digital space. Furthermore, interactive content, which is central to edutainment, now represents a growing portion of digital marketing efforts, with 93% of marketers noting its effectiveness, as highlighted by Rock Content. This intensifies competition among platforms that use similar tools, making it harder for newcomers to capture attention and establish a solid user base. The need for personalized, high-quality educational material is pressing, but the constant influx of content may decrease overall engagement and learner retention. These factors contribute to the difficulty in maintaining market differentiation in the ever-expanding digital education landscape. As the industry grapples with content saturation, focusing on authenticity, interactivity, and delivering value is critical for success. With 73% of marketers acknowledging that creating standout content is their biggest challenge, the edutainment market must navigate these obstacles while continuing to innovate and offer engaging, unique learning experiences.
Edutainment Market Segment Analysis
By Gaming Type
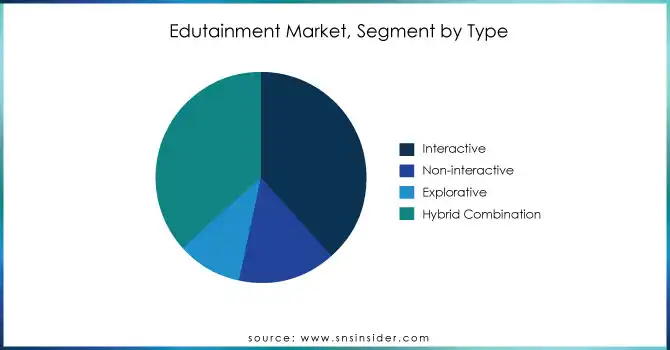
The interactive gaming segment of the edutainment market is the largest, capturing around 39% of revenue in 2023. This dominance reflects the growing appeal of immersive learning experiences that blend education with entertainment. Interactive games, driven by gamification, augmented reality (AR), and virtual reality (VR), engage learners in a hands-on, enjoyable way, promoting deeper knowledge retention and skill development. These games offer personalized learning paths, allowing users to explore subjects actively and at their own pace. As a result, the interactive gaming segment is particularly popular among younger audiences, schools, and educational institutions, fostering both engagement and cognitive development in an increasingly digital learning environment.
By Facility Size
In 2023, the facility size segment of 5,001 to 10,000 square feet dominated the edutainment market, accounting for approximately 40% of the revenue share. This range is ideal for balancing space efficiency with the ability to accommodate interactive learning experiences and engaging activities, making it particularly suitable for edutainment centers, gaming zones, and educational venues. Such spaces provide enough room for diverse activities, including VR/AR simulations, interactive exhibits, and games, all while maintaining an optimal customer experience. The popularity of mid-sized facilities reflects the increasing demand for versatile environments that can support both educational and entertainment content in a dynamic and engaging way.
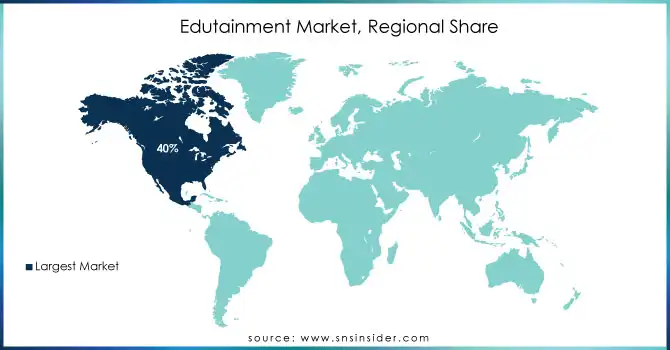
North America holds a dominant share of around 40% of the global edutainment market in 2023 due to a combination of factors such as technological advancements, high digital penetration, and innovation in educational content delivery. The United States, in particular, is a leader in integrating technologies like gamification, augmented reality (AR), and virtual reality (VR) into learning platforms, making education more interactive and engaging. The region benefits from substantial investments in edutainment startups, a favorable regulatory environment, and extensive infrastructure for digital education. Additionally, the rise of online learning platforms, such as Coursera, Duolingo, and Khan Academy, further propels this market growth. These platforms offer not just educational content but immersive and gamified experiences, which appeal to both young learners and adults. The widespread use of mobile devices and access to high-speed internet also ensures that interactive learning experiences are easily accessible, making North America a key region for the edutainment market’s success.
Asia-Pacific emerged as the fastest-growing region in the edutainment market in 2023, driven by rising technological adoption, increasing disposable incomes, and a growing focus on digital education. Countries like China, India, and Japan are spearheading this growth due to significant investments in digital infrastructure and educational reforms. China is leading with advancements in AR/VR-based learning and government-backed online education initiatives. India is witnessing a surge in edtech startups offering gamified learning experiences to its massive student population. Japan emphasizes robotics and AI integration in educational systems, promoting interactive and immersive learning environments. This rapid development is fueled by increasing internet penetration, the widespread use of smartphones, and government initiatives aimed at enhancing digital literacy and education access. Combined, these factors position Asia-Pacific as a dynamic and evolving market for edutainment, with immense potential for further growth.
Do You Need any Customization Research on Edutainment Market - Enquire Now
Some of the major key players in Edutainment Market with their product:
LeapFrog Enterprises, Inc. (LeapPad Academy, LeapStart)
Disney Interactive (Disney Infinity, Club Penguin)
Nickelodeon (ViacomCBS) (Nick Jr. App, Moose A. Moose)
VTech Communications, Inc. (VTech Learning Tablet, VTech Kidizoom Camera)
Osmo (By Tangible Play, Inc.) (Osmo Genius Kit, Osmo Monster)
Samsung Electronics (Samsung Smart School, Samsung Gear VR)
Mattel, Inc. (Fisher-Price Smart Toy, Barbie Learn & Play)
Kahoot! (Kahoot! Game-based Learning Platform, Kahoot! Academy)
Pixar Animation Studios (Pixar in a Box)
Razor USA LLC (Razor A Kick Scooter)
CuriosityStream (CuriosityStream Subscription Service)
Duolingo (Duolingo Language Learning App)
Code.org (Hour of Code, CS Fundamentals)
Wondershare Technology (FamiSafe)
Houghton Mifflin Harcourt (EdTech Solutions, K-12 Learning Platforms)
National Geographic Kids (National Geographic Kids App)
TinkerPlay (by TinkRworks) (TinkerPlay App)
Minecraft (by Mojang Studios) (Minecraft Education Edition)
Funbrain (Funbrain Interactive Games)
Skillshare (Skillshare Online Learning Platform)
Kidzania (Kidzania Interactive Learning Centers)
Legoland Discovery Center (LEGO-based Interactive Learning Centers)
Kindercity (Kindercity Play and Learn Centers)
Plabo (Plabo Interactive Learning Playgrounds)
Pororo Park (Pororo Park Interactive Entertainment Centers)
Curiocity (Curiocity Interactive Science Centers)
Totter’s Otterville (Totter’s Otterville Interactive Play Zones)
Mattel Play Town (Mattel Play Town Interactive Learning Centers)
Little Explorers (Little Explorers Play Zones)
Kidz Holding S.A.L (Kidz Holding Interactive Learning Experiences)
List of potential customer companies for the edutainment market, including organizations that could use edutainment products or services in various sectors such as education, technology, entertainment:
Schools and Educational Institutions
K-12 Schools
Universities and Colleges
International Schools
Online Education Platforms
Children’s Museums
The Children's Museum of Indianapolis
Boston Children's Museum
The National Children's Museum (Washington D.C.)
Entertainment and Leisure Companies
The Walt Disney Company
Universal Studios
SeaWorld Entertainment
Merlin Entertainments Group (Operators of LEGOLAND)
Technology Companies
Apple Inc.
Google (especially for educational platforms like Google Classroom)
Microsoft (Minecraft Education Edition)
Samsung Electronics
Sony Interactive Entertainment
Gaming Companies
Nintendo
Activision Blizzard
Epic Games
Ubisoft
Learning and Development Providers
Pearson Education
Kaplan, Inc.
Scholastic Corporation
Houghton Mifflin Harcourt
EdTech Startups
Duolingo
Kahoot!
Quizlet
Tinkercad (by Autodesk)
Codeacademy
Non-profit Organizations and Foundations
Bill & Melinda Gates Foundation (funding educational initiatives)
Khan Academy
UNESCO (United Nations Educational, Scientific and Cultural Organization)
Government Agencies
U.S. Department of Education
Department of Culture, Media and Sport (UK)
Ministry of Education (Various countries)
Healthcare and Medical Institutions
Children's hospitals using therapeutic games for recovery
Health-focused educational programs for children
June 5, 2024 Samsung Electronics America has expanded its MICRO LED portfolio with the introduction of the MS1B (89” and 101” class) and MS1C (114” class) display options. These new screens offer cutting-edge display technology with enhanced depth, color, and brightness, providing a luxury home theater experience.
April 2, 2024 Disney continues to lead in edutainment with its integration of valuable life lessons in animated films, such as "The Lion King" and "Moana." The company seamlessly blends education and entertainment, offering both entertaining content and meaningful moral teachings for audiences of all ages.
Report Attributes | Details |
---|---|
Market Size in 2023 | USD2.06 Billion |
Market Size by 2032 | USD 7.74 Billion |
CAGR | CAGR of 16.8% From 2024 to 2032 |
Base Year | 2023 |
Forecast Period | 2024-2032 |
Historical Data | 2020-2022 |
Report Scope & Coverage | Market Size, Segments Analysis, Competitive Landscape, Regional Analysis, DROC & SWOT Analysis, Forecast Outlook |
Key Segments | • By Gaming Type(Interactive, Non-interactive, Explorative, Hybrid Combination) • By Facility Size(5,001 to 10,000 Sq. Ft., 10,001 to 20,000 Sq. Ft., 20,001 to 40,000 Sq. Ft., >40,000 Sq. Ft.) • By Revenue Source(Entry fees & tickets, Food & Beverages, Merchandising, Advertising, Others) • By Visitor Demographics( Children (0 to 12), Teenager (13 to 18), Young Adult (19 to 25), Adult (25+)) |
Regional Analysis/Coverage | North America (US, Canada, Mexico), Europe (Eastern Europe [Poland, Romania, Hungary, Turkey, Rest of Eastern Europe] Western Europe [Germany, France, UK, Italy, Spain, Netherlands, Switzerland, Austria, Rest of Western Europe]), Asia Pacific (China, India, Japan, South Korea, Vietnam, Singapore, Australia, Rest of Asia Pacific), Middle East & Africa (Middle East [UAE, Egypt, Saudi Arabia, Qatar, Rest of Middle East], Africa [Nigeria, South Africa, Rest of Africa], Latin America (Brazil, Argentina, Colombia, Rest of Latin America) |
Company Profiles | LeapFrog Enterprises, Inc., Disney Interactive, Nickelodeon (ViacomCBS), VTech Communications, Inc., Osmo (By Tangible Play, Inc.), Samsung Electronics, Mattel, Inc., Kahoot!, Pixar Animation Studios, Razor USA LLC, CuriosityStream, Duolingo, Code.org, Wondershare Technology, Houghton Mifflin Harcourt, National Geographic Kids, TinkerPlay (by TinkRworks), Minecraft (by Mojang Studios), Funbrain, Skillshare, Kidzania, Legoland Discovery Center, Kindercity, Plabo, Pororo Park, Curiocity, Totter’s Otterville, Mattel Play Town, Little Explorers, and Kidz Holding S.A.L. are key players in the edutainment market. |
Key Drivers | • Digital Learning Platforms as a Driving Force Behind Edutainment Market Expansion |
Restraints | • Overcoming Content Saturation and Navigating Challenges in the Edutainment Market |
Ans: The market is expected to grow to USD 7.74 billion by the forecast period of 2032.
The major players are ConveGenius, Meraasm, KidZania, Kaltura Inc., Legoland Discovery Center, Pororo Park, The Plabo, CurioCity Group, Totter’s Otterville, Mattel Play Town, Brightcove Inc., Time4Learning, and others in the final report.
Ans. The CAGR of the Edutainment Market for the forecast period 2024-2032 is 15.84%.
Ans: Yes, you can buy reports in bulk quantity as per your requirements. Check Here for more details.
Ans:
1. Introduction
1.1 Market Definition
1.2 Scope (Inclusion and Exclusions)
1.3 Research Assumptions
2. Executive Summary
2.1 Market Overview
2.2 Regional Synopsis
2.3 Competitive Summary
3. Research Methodology
3.1 Top-Down Approach
3.2 Bottom-up Approach
3.3. Data Validation
3.4 Primary Interviews
4. Market Dynamics Impact Analysis
4.1 Market Driving Factors Analysis
4.1.1 Drivers
4.1.2 Restraints
4.1.3 Opportunities
4.1.4 Challenges
4.2 PESTLE Analysis
4.3 Porter’s Five Forces Model
5. Statistical Insights and Trends Reporting
5.1 Technology Adoption Rates
5.2 Subscription and Retention Rates
5.3 Educational Impact Metrics
5.4 Regulatory and Policy Changes
5.5 Product Launch and Innovation Rates
6. Competitive Landscape
6.1 List of Major Companies, By Region
6.2 Market Share Analysis, By Region
6.3 Product Benchmarking
6.3.1 Product specifications and features
6.3.2 Pricing
6.4 Strategic Initiatives
6.4.1 Marketing and promotional activities
6.4.2 Distribution and supply chain strategies
6.4.3 Expansion plans and new product launches
6.4.4 Strategic partnerships and collaborations
6.5 Technological Advancements
6.6 Market Positioning and Branding
7. Edutainment Market Segmentation, by Gaming Type
7.1 Chapter Overview
7.2 Interactive
7.2.1 Interactive Market Trends Analysis (2020-2032)
7.2.2 Interactive Market Size Estimates and Forecasts to 2032 (USD Billion)
7.3 Non-interactive
7.3.1 Non-interactive Market Trends Analysis (2020-2032)
7.3.2 Non-interactive Market Size Estimates and Forecasts to 2032 (USD Billion)
7.4 Explorative
7.4.1 Explorative Market Trends Analysis (2020-2032)
7.4.2 Explorative Market Size Estimates and Forecasts to 2032 (USD Billion)
7.5 Hybrid Combination
7.5.1 Hybrid Combination Market Trends Analysis (2020-2032)
7.5.2 Hybrid Combination Market Size Estimates and Forecasts to 2032 (USD Billion)
8. Edutainment Market Segmentation, by Facility Size
8.1 Chapter Overview
8.2 5,001 to 10,000 Sq. Ft.
8.2.1 5,001 to 10,000 Sq. Ft. Market Trends Analysis (2020-2032)
8.2.2 5,001 to 10,000 Sq. Ft. Market Size Estimates and Forecasts to 2032 (USD Billion)
8.3 10,001 to 20,000 Sq. Ft.
8.3.1 10,001 to 20,000 Sq. Ft. Market Trends Analysis (2020-2032)
8.3.2 10,001 to 20,000 Sq. Ft. Market Size Estimates and Forecasts to 2032 (USD Billion)
8.4 20,001 to 40,000 Sq. Ft.
8.4.1 20,001 to 40,000 Sq. Ft. Market Trends Analysis (2020-2032)
8.4.2 20,001 to 40,000 Sq. Ft. Market Size Estimates and Forecasts to 2032 (USD Billion)
8.5 >40,000 Sq. Ft.
8.5.1 >40,000 Sq. Ft. Market Trends Analysis (2020-2032)
8.5.2 >40,000 Sq. Ft. Market Size Estimates and Forecasts to 2032 (USD Billion)
9. Edutainment Market Segmentation, by Revenue Source
9.1 Chapter Overview
9.2 Entry fees & tickets
9.2.1 Entry fees & tickets Market Trends Analysis (2020-2032)
9.2.2 Entry fees & tickets Market Size Estimates and Forecasts to 2032 (USD Billion)
9.3 Food & Beverages
9.3.1 Food & Beverages Market Trends Analysis (2020-2032)
9.3.2 Food & Beverages Market Size Estimates and Forecasts to 2032 (USD Billion)
9.4 Merchandising
9.4.1 Merchandising Market Trends Analysis (2020-2032)
9.4.2 Merchandising Market Size Estimates and Forecasts to 2032 (USD Billion)
9.5 Advertising
9.5.1 Advertising Market Trends Analysis (2020-2032)
9.5.2 Advertising Market Size Estimates and Forecasts to 2032 (USD Billion)
9.6 Others
9.6.1 Others Market Trends Analysis (2020-2032)
9.6.2 Others Market Size Estimates and Forecasts to 2032 (USD Billion)
10. Edutainment Market Segmentation, by Visitor Demographics
10.1 Chapter Overview
10.2 Children (0 to 12)
10.2.1 Children (0 to 12) Market Trends Analysis (2020-2032)
10.2.2 Children (0 to 12) Market Size Estimates and Forecasts to 2032 (USD Billion)
10.3 Teenager (13 to 18)
10.3.1 Teenager (13 to 18) Market Trends Analysis (2020-2032)
10.3.2 Teenager (13 to 18) Market Size Estimates and Forecasts to 2032 (USD Billion)
10.4 Teenager (13 to 18)
10.4.1 Teenager (13 to 18) Market Trends Analysis (2020-2032)
10.4.2 Teenager (13 to 18) Market Size Estimates and Forecasts to 2032 (USD Billion)
10.5 Young Adult (19 to 25)
10.5.1 Young Adult (19 to 25) Market Trends Analysis (2020-2032)
10.5.2 Young Adult (19 to 25) Market Size Estimates and Forecasts to 2032 (USD Billion)
10.6 Adult (25+)
10.6.1 Adult (25+) Market Trends Analysis (2020-2032)
10.6.2 Adult (25+) Market Size Estimates and Forecasts to 2032 (USD Billion)
11. Regional Analysis
11.1 Chapter Overview
11.2 North America
11.2.1 Trends Analysis
11.2.2 North America Edutainment Market Estimates and Forecasts, by Country (2020-2032) (USD Billion)
11.2.3 North America Edutainment Market Estimates and Forecasts, by Gaming Type (2020-2032) (USD Billion)
11.2.4 North America Edutainment Market Estimates and Forecasts, by Facility Size (2020-2032) (USD Billion)
11.2.5 North America Edutainment Market Estimates and Forecasts, by Revenue Source (2020-2032) (USD Billion)
11.2.6 North America Edutainment Market Estimates and Forecasts, by Visitor Demographics (2020-2032) (USD Billion)
11.2.7 USA
11.2.7.1 USA Edutainment Market Estimates and Forecasts, by Gaming Type (2020-2032) (USD Billion)
11.2.7.2 USA Edutainment Market Estimates and Forecasts, by Facility Size (2020-2032) (USD Billion)
11.2.7.3 USA Edutainment Market Estimates and Forecasts, by Revenue Source (2020-2032) (USD Billion)
11.2.7.4 USA Edutainment Market Estimates and Forecasts, by Visitor Demographics (2020-2032) (USD Billion)
11.2.8 Canada
11.2.8.1 Canada Edutainment Market Estimates and Forecasts, by Gaming Type (2020-2032) (USD Billion)
11.2.8.2 Canada Edutainment Market Estimates and Forecasts, by Facility Size (2020-2032) (USD Billion)
11.2.8.3 Canada Edutainment Market Estimates and Forecasts, by Revenue Source (2020-2032) (USD Billion)
11.2.8.4 Canada Edutainment Market Estimates and Forecasts, by Visitor Demographics (2020-2032) (USD Billion)
11.2.9 Mexico
11.2.9.1 Mexico Edutainment Market Estimates and Forecasts, by Gaming Type (2020-2032) (USD Billion)
11.2.9.2 Mexico Edutainment Market Estimates and Forecasts, by Facility Size (2020-2032) (USD Billion)
11.2.9.3 Mexico Edutainment Market Estimates and Forecasts, by Revenue Source (2020-2032) (USD Billion)
11.2.9.4 Mexico Edutainment Market Estimates and Forecasts, by Visitor Demographics (2020-2032) (USD Billion)
11.3 Europe
11.3.1 Eastern Europe
11.3.1.1 Trends Analysis
11.3.1.2 Eastern Europe Edutainment Market Estimates and Forecasts, by Country (2020-2032) (USD Billion)
11.3.1.3 Eastern Europe Edutainment Market Estimates and Forecasts, by Gaming Type (2020-2032) (USD Billion)
11.3.1.4 Eastern Europe Edutainment Market Estimates and Forecasts, by Facility Size (2020-2032) (USD Billion)
11.3.1.5 Eastern Europe Edutainment Market Estimates and Forecasts, by Revenue Source (2020-2032) (USD Billion)
11.3.1.6 Eastern Europe Edutainment Market Estimates and Forecasts, by Visitor Demographics (2020-2032) (USD Billion)
11.3.1.7 Poland
11.3.1.7.1 Poland Edutainment Market Estimates and Forecasts, by Gaming Type (2020-2032) (USD Billion)
11.3.1.7.2 Poland Edutainment Market Estimates and Forecasts, by Facility Size (2020-2032) (USD Billion)
11.3.1.7.3 Poland Edutainment Market Estimates and Forecasts, by Revenue Source (2020-2032) (USD Billion)
11.3.1.7.4 Poland Edutainment Market Estimates and Forecasts, by Visitor Demographics (2020-2032) (USD Billion)
11.3.1.8 Romania
11.3.1.8.1 Romania Edutainment Market Estimates and Forecasts, by Gaming Type (2020-2032) (USD Billion)
11.3.1.8.2 Romania Edutainment Market Estimates and Forecasts, by Facility Size (2020-2032) (USD Billion)
11.3.1.8.3 Romania Edutainment Market Estimates and Forecasts, by Revenue Source (2020-2032) (USD Billion)
11.3.1.8.4 Romania Edutainment Market Estimates and Forecasts, by Visitor Demographics (2020-2032) (USD Billion)
11.3.1.9 Hungary
11.3.1.9.1 Hungary Edutainment Market Estimates and Forecasts, by Gaming Type (2020-2032) (USD Billion)
11.3.1.9.2 Hungary Edutainment Market Estimates and Forecasts, by Facility Size (2020-2032) (USD Billion)
11.3.1.9.3 Hungary Edutainment Market Estimates and Forecasts, by Revenue Source (2020-2032) (USD Billion)
11.3.1.9.4 Hungary Edutainment Market Estimates and Forecasts, by Visitor Demographics (2020-2032) (USD Billion)
11.3.1.10 Turkey
11.3.1.10.1 Turkey Edutainment Market Estimates and Forecasts, by Gaming Type (2020-2032) (USD Billion)
11.3.1.10.2 Turkey Edutainment Market Estimates and Forecasts, by Facility Size (2020-2032) (USD Billion)
11.3.1.10.3 Turkey Edutainment Market Estimates and Forecasts, by Revenue Source (2020-2032) (USD Billion)
11.3.1.10.4 Turkey Edutainment Market Estimates and Forecasts, by Visitor Demographics (2020-2032) (USD Billion)
11.3.1.11 Rest of Eastern Europe
11.3.1.11.1 Rest of Eastern Europe Edutainment Market Estimates and Forecasts, by Gaming Type (2020-2032) (USD Billion)
11.3.1.11.2 Rest of Eastern Europe Edutainment Market Estimates and Forecasts, by Facility Size (2020-2032) (USD Billion)
11.3.1.11.3 Rest of Eastern Europe Edutainment Market Estimates and Forecasts, by Revenue Source (2020-2032) (USD Billion)
11.3.1.11.4 Rest of Eastern Europe Edutainment Market Estimates and Forecasts, by Visitor Demographics (2020-2032) (USD Billion)
11.3.2 Western Europe
11.3.2.1 Trends Analysis
11.3.2.2 Western Europe Edutainment Market Estimates and Forecasts, by Country (2020-2032) (USD Billion)
11.3.2.3 Western Europe Edutainment Market Estimates and Forecasts, by Gaming Type (2020-2032) (USD Billion)
11.3.2.4 Western Europe Edutainment Market Estimates and Forecasts, by Facility Size (2020-2032) (USD Billion)
11.3.2.5 Western Europe Edutainment Market Estimates and Forecasts, by Revenue Source (2020-2032) (USD Billion)
11.3.2.6 Western Europe Edutainment Market Estimates and Forecasts, by Visitor Demographics (2020-2032) (USD Billion)
11.3.2.7 Germany
11.3.2.7.1 Germany Edutainment Market Estimates and Forecasts, by Gaming Type (2020-2032) (USD Billion)
11.3.2.7.2 Germany Edutainment Market Estimates and Forecasts, by Facility Size (2020-2032) (USD Billion)
11.3.2.7.3 Germany Edutainment Market Estimates and Forecasts, by Revenue Source (2020-2032) (USD Billion)
11.3.2.7.4 Germany Edutainment Market Estimates and Forecasts, by Visitor Demographics (2020-2032) (USD Billion)
11.3.2.8 France
11.3.2.8.1 France Edutainment Market Estimates and Forecasts, by Gaming Type (2020-2032) (USD Billion)
11.3.2.8.2 France Edutainment Market Estimates and Forecasts, by Facility Size (2020-2032) (USD Billion)
11.3.2.8.3 France Edutainment Market Estimates and Forecasts, by Revenue Source (2020-2032) (USD Billion)
11.3.2.8.4 France Edutainment Market Estimates and Forecasts, by Visitor Demographics (2020-2032) (USD Billion)
11.3.2.9 UK
11.3.2.9.1 UK Edutainment Market Estimates and Forecasts, by Gaming Type (2020-2032) (USD Billion)
11.3.2.9.2 UK Edutainment Market Estimates and Forecasts, by Facility Size (2020-2032) (USD Billion)
11.3.2.9.3 UK Edutainment Market Estimates and Forecasts, by Revenue Source (2020-2032) (USD Billion)
11.3.2.9.4 UK Edutainment Market Estimates and Forecasts, by Visitor Demographics (2020-2032) (USD Billion)
11.3.2.10 Italy
11.3.2.10.1 Italy Edutainment Market Estimates and Forecasts, by Gaming Type (2020-2032) (USD Billion)
11.3.2.10.2 Italy Edutainment Market Estimates and Forecasts, by Facility Size (2020-2032) (USD Billion)
11.3.2.10.3 Italy Edutainment Market Estimates and Forecasts, by Revenue Source (2020-2032) (USD Billion)
11.3.2.10.4 Italy Edutainment Market Estimates and Forecasts, by Visitor Demographics (2020-2032) (USD Billion)
11.3.2.11 Spain
11.3.2.11.1 Spain Edutainment Market Estimates and Forecasts, by Gaming Type (2020-2032) (USD Billion)
11.3.2.11.2 Spain Edutainment Market Estimates and Forecasts, by Facility Size (2020-2032) (USD Billion)
11.3.2.11.3 Spain Edutainment Market Estimates and Forecasts, by Revenue Source (2020-2032) (USD Billion)
11.3.2.11.4 Spain Edutainment Market Estimates and Forecasts, by Visitor Demographics (2020-2032) (USD Billion)
11.3.2.12 Netherlands
11.3.2.12.1 Netherlands Edutainment Market Estimates and Forecasts, by Gaming Type (2020-2032) (USD Billion)
11.3.2.12.2 Netherlands Edutainment Market Estimates and Forecasts, by Facility Size (2020-2032) (USD Billion)
11.3.2.12.3 Netherlands Edutainment Market Estimates and Forecasts, by Revenue Source (2020-2032) (USD Billion)
11.3.2.12.4 Netherlands Edutainment Market Estimates and Forecasts, by Visitor Demographics (2020-2032) (USD Billion)
11.3.2.13 Switzerland
11.3.2.13.1 Switzerland Edutainment Market Estimates and Forecasts, by Gaming Type (2020-2032) (USD Billion)
11.3.2.13.2 Switzerland Edutainment Market Estimates and Forecasts, by Facility Size (2020-2032) (USD Billion)
11.3.2.13.3 Switzerland Edutainment Market Estimates and Forecasts, by Revenue Source (2020-2032) (USD Billion)
11.3.2.13.4 Switzerland Edutainment Market Estimates and Forecasts, by Visitor Demographics (2020-2032) (USD Billion)
11.3.2.14 Austria
11.3.2.14.1 Austria Edutainment Market Estimates and Forecasts, by Gaming Type (2020-2032) (USD Billion)
11.3.2.14.2 Austria Edutainment Market Estimates and Forecasts, by Facility Size (2020-2032) (USD Billion)
11.3.2.14.3 Austria Edutainment Market Estimates and Forecasts, by Revenue Source (2020-2032) (USD Billion)
11.3.2.14.4 Austria Edutainment Market Estimates and Forecasts, by Visitor Demographics (2020-2032) (USD Billion)
11.3.2.15 Rest of Western Europe
11.3.2.15.1 Rest of Western Europe Edutainment Market Estimates and Forecasts, by Gaming Type (2020-2032) (USD Billion)
11.3.2.15.2 Rest of Western Europe Edutainment Market Estimates and Forecasts, by Facility Size (2020-2032) (USD Billion)
11.3.2.15.3 Rest of Western Europe Edutainment Market Estimates and Forecasts, by Revenue Source (2020-2032) (USD Billion)
11.3.2.15.4 Rest of Western Europe Edutainment Market Estimates and Forecasts, by Visitor Demographics (2020-2032) (USD Billion)
11.4 Asia Pacific
11.4.1 Trends Analysis
11.4.2 Asia Pacific Edutainment Market Estimates and Forecasts, by Country (2020-2032) (USD Billion)
11.4.3 Asia Pacific Edutainment Market Estimates and Forecasts, by Gaming Type (2020-2032) (USD Billion)
11.4.4 Asia Pacific Edutainment Market Estimates and Forecasts, by Facility Size (2020-2032) (USD Billion)
11.4.5 Asia Pacific Edutainment Market Estimates and Forecasts, by Revenue Source (2020-2032) (USD Billion)
11.4.6 Asia Pacific Edutainment Market Estimates and Forecasts, by Visitor Demographics (2020-2032) (USD Billion)
11.4.7 China
11.4.7.1 China Edutainment Market Estimates and Forecasts, by Gaming Type (2020-2032) (USD Billion)
11.4.7.2 China Edutainment Market Estimates and Forecasts, by Facility Size (2020-2032) (USD Billion)
11.4.7.3 China Edutainment Market Estimates and Forecasts, by Revenue Source (2020-2032) (USD Billion)
11.4.7.4 China Edutainment Market Estimates and Forecasts, by Visitor Demographics (2020-2032) (USD Billion)
11.4.8 India
11.4.8.1 India Edutainment Market Estimates and Forecasts, by Gaming Type (2020-2032) (USD Billion)
11.4.8.2 India Edutainment Market Estimates and Forecasts, by Facility Size (2020-2032) (USD Billion)
11.4.8.3 India Edutainment Market Estimates and Forecasts, by Revenue Source (2020-2032) (USD Billion)
11.4.8.4 India Edutainment Market Estimates and Forecasts, by Visitor Demographics (2020-2032) (USD Billion)
11.4.9 Japan
11.4.9.1 Japan Edutainment Market Estimates and Forecasts, by Gaming Type (2020-2032) (USD Billion)
11.4.9.2 Japan Edutainment Market Estimates and Forecasts, by Facility Size (2020-2032) (USD Billion)
11.4.9.3 Japan Edutainment Market Estimates and Forecasts, by Revenue Source (2020-2032) (USD Billion)
11.4.9.4 Japan Edutainment Market Estimates and Forecasts, by Visitor Demographics (2020-2032) (USD Billion)
11.4.10 South Korea
11.4.10.1 South Korea Edutainment Market Estimates and Forecasts, by Gaming Type (2020-2032) (USD Billion)
11.4.10.2 South Korea Edutainment Market Estimates and Forecasts, by Facility Size (2020-2032) (USD Billion)
11.4.10.3 South Korea Edutainment Market Estimates and Forecasts, by Revenue Source (2020-2032) (USD Billion)
11.4.10.4 South Korea Edutainment Market Estimates and Forecasts, by Visitor Demographics (2020-2032) (USD Billion)
11.4.11 Vietnam
11.4.11.1 Vietnam Edutainment Market Estimates and Forecasts, by Gaming Type (2020-2032) (USD Billion)
11.4.11.2 Vietnam Edutainment Market Estimates and Forecasts, by Facility Size (2020-2032) (USD Billion)
11.4.11.3 Vietnam Edutainment Market Estimates and Forecasts, by Revenue Source (2020-2032) (USD Billion)
11.4.11.4 Vietnam Edutainment Market Estimates and Forecasts, by Visitor Demographics (2020-2032) (USD Billion)
11.4.12 Singapore
11.4.12.1 Singapore Edutainment Market Estimates and Forecasts, by Gaming Type (2020-2032) (USD Billion)
11.4.12.2 Singapore Edutainment Market Estimates and Forecasts, by Facility Size (2020-2032) (USD Billion)
11.4.12.3 Singapore Edutainment Market Estimates and Forecasts, by Revenue Source (2020-2032) (USD Billion)
11.4.12.4 Singapore Edutainment Market Estimates and Forecasts, by Visitor Demographics (2020-2032) (USD Billion)
11.4.13 Australia
11.4.13.1 Australia Edutainment Market Estimates and Forecasts, by Gaming Type (2020-2032) (USD Billion)
11.4.13.2 Australia Edutainment Market Estimates and Forecasts, by Facility Size (2020-2032) (USD Billion)
11.4.13.3 Australia Edutainment Market Estimates and Forecasts, by Revenue Source (2020-2032) (USD Billion)
11.4.13.4 Australia Edutainment Market Estimates and Forecasts, by Visitor Demographics (2020-2032) (USD Billion)
11.4.14 Rest of Asia Pacific
11.4.14.1 Rest of Asia Pacific Edutainment Market Estimates and Forecasts, by Gaming Type (2020-2032) (USD Billion)
11.4.14.2 Rest of Asia Pacific Edutainment Market Estimates and Forecasts, by Facility Size (2020-2032) (USD Billion)
11.4.14.3 Rest of Asia Pacific Edutainment Market Estimates and Forecasts, by Revenue Source (2020-2032) (USD Billion)
11.4.14.4 Rest of Asia Pacific Edutainment Market Estimates and Forecasts, by Visitor Demographics (2020-2032) (USD Billion)
11.5 Middle East and Africa
11.5.1 Middle East
11.5.1.1 Trends Analysis
11.5.1.2 Middle East Edutainment Market Estimates and Forecasts, by Country (2020-2032) (USD Billion)
11.5.1.3 Middle East Edutainment Market Estimates and Forecasts, by Gaming Type (2020-2032) (USD Billion)
11.5.1.4 Middle East Edutainment Market Estimates and Forecasts, by Facility Size (2020-2032) (USD Billion)
11.5.1.5 Middle East Edutainment Market Estimates and Forecasts, by Revenue Source (2020-2032) (USD Billion)
11.5.1.6 Middle East Edutainment Market Estimates and Forecasts, by Visitor Demographics (2020-2032) (USD Billion)
11.5.1.7 UAE
11.5.1.7.1 UAE Edutainment Market Estimates and Forecasts, by Gaming Type (2020-2032) (USD Billion)
11.5.1.7.2 UAE Edutainment Market Estimates and Forecasts, by Facility Size (2020-2032) (USD Billion)
11.5.1.7.3 UAE Edutainment Market Estimates and Forecasts, by Revenue Source (2020-2032) (USD Billion)
11.5.1.7.4 UAE Edutainment Market Estimates and Forecasts, by Visitor Demographics (2020-2032) (USD Billion)
11.5.1.8 Egypt
11.5.1.8.1 Egypt Edutainment Market Estimates and Forecasts, by Gaming Type (2020-2032) (USD Billion)
11.5.1.8.2 Egypt Edutainment Market Estimates and Forecasts, by Facility Size (2020-2032) (USD Billion)
11.5.1.8.3 Egypt Edutainment Market Estimates and Forecasts, by Revenue Source (2020-2032) (USD Billion)
11.5.1.8.4 Egypt Edutainment Market Estimates and Forecasts, by Visitor Demographics (2020-2032) (USD Billion)
11.5.1.9 Saudi Arabia
11.5.1.9.1 Saudi Arabia Edutainment Market Estimates and Forecasts, by Gaming Type (2020-2032) (USD Billion)
11.5.1.9.2 Saudi Arabia Edutainment Market Estimates and Forecasts, by Facility Size (2020-2032) (USD Billion)
11.5.1.9.3 Saudi Arabia Edutainment Market Estimates and Forecasts, by Revenue Source (2020-2032) (USD Billion)
11.5.1.9.4 Saudi Arabia Edutainment Market Estimates and Forecasts, by Visitor Demographics (2020-2032) (USD Billion)
11.5.1.10 Qatar
11.5.1.10.1 Qatar Edutainment Market Estimates and Forecasts, by Gaming Type (2020-2032) (USD Billion)
11.5.1.10.2 Qatar Edutainment Market Estimates and Forecasts, by Facility Size (2020-2032) (USD Billion)
11.5.1.10.3 Qatar Edutainment Market Estimates and Forecasts, by Revenue Source (2020-2032) (USD Billion)
11.5.1.10.4 Qatar Edutainment Market Estimates and Forecasts, by Visitor Demographics (2020-2032) (USD Billion)
11.5.1.11 Rest of Middle East
11.5.1.11.1 Rest of Middle East Edutainment Market Estimates and Forecasts, by Gaming Type (2020-2032) (USD Billion)
11.5.1.11.2 Rest of Middle East Edutainment Market Estimates and Forecasts, by Facility Size (2020-2032) (USD Billion)
11.5.1.11.3 Rest of Middle East Edutainment Market Estimates and Forecasts, by Revenue Source (2020-2032) (USD Billion)
11.5.1.11.4 Rest of Middle East Edutainment Market Estimates and Forecasts, by Visitor Demographics (2020-2032) (USD Billion)
11.5.2 Africa
11.5.2.1 Trends Analysis
11.5.2.2 Africa Edutainment Market Estimates and Forecasts, by Country (2020-2032) (USD Billion)
11.5.2.3 Africa Edutainment Market Estimates and Forecasts, by Gaming Type (2020-2032) (USD Billion)
11.5.2.4 Africa Edutainment Market Estimates and Forecasts, by Facility Size (2020-2032) (USD Billion)
11.5.2.5 Africa Edutainment Market Estimates and Forecasts, by Revenue Source (2020-2032) (USD Billion)
11.5.2.6 Africa Edutainment Market Estimates and Forecasts, by Visitor Demographics (2020-2032) (USD Billion)
11.5.2.7 South Africa
11.5.2.7.1 South Africa Edutainment Market Estimates and Forecasts, by Gaming Type (2020-2032) (USD Billion)
11.5.2.7.2 South Africa Edutainment Market Estimates and Forecasts, by Facility Size (2020-2032) (USD Billion)
11.5.2.7.3 South Africa Edutainment Market Estimates and Forecasts, by Revenue Source (2020-2032) (USD Billion)
11.5.2.7.4 South Africa Edutainment Market Estimates and Forecasts, by Visitor Demographics (2020-2032) (USD Billion)
11.5.2.8 Nigeria
11.5.2.8.1 Nigeria Edutainment Market Estimates and Forecasts, by Gaming Type (2020-2032) (USD Billion)
11.5.2.8.2 Nigeria Edutainment Market Estimates and Forecasts, by Facility Size (2020-2032) (USD Billion)
11.5.2.8.3 Nigeria Edutainment Market Estimates and Forecasts, by Revenue Source (2020-2032) (USD Billion)
11.5.2.8.4 Nigeria Edutainment Market Estimates and Forecasts, by Visitor Demographics (2020-2032) (USD Billion)
11.5.2.9 Rest of Africa
11.5.2.9.1 Rest of Africa Edutainment Market Estimates and Forecasts, by Gaming Type (2020-2032) (USD Billion)
11.5.2.9.2 Rest of Africa Edutainment Market Estimates and Forecasts, by Facility Size (2020-2032) (USD Billion)
11.5.2.9.3 Rest of Africa Edutainment Market Estimates and Forecasts, by Revenue Source (2020-2032) (USD Billion)
11.5.2.9.4 Rest of Africa Edutainment Market Estimates and Forecasts, by Visitor Demographics (2020-2032) (USD Billion)
11.6 Latin America
11.6.1 Trends Analysis
11.6.2 Latin America Edutainment Market Estimates and Forecasts, by Country (2020-2032) (USD Billion)
11.6.3 Latin America Edutainment Market Estimates and Forecasts, by Gaming Type (2020-2032) (USD Billion)
11.6.4 Latin America Edutainment Market Estimates and Forecasts, by Facility Size (2020-2032) (USD Billion)
11.6.5 Latin America Edutainment Market Estimates and Forecasts, by Revenue Source (2020-2032) (USD Billion)
11.6.6 Latin America Edutainment Market Estimates and Forecasts, by Visitor Demographics (2020-2032) (USD Billion)
11.6.7 Brazil
11.6.7.1 Brazil Edutainment Market Estimates and Forecasts, by Gaming Type (2020-2032) (USD Billion)
11.6.7.2 Brazil Edutainment Market Estimates and Forecasts, by Facility Size (2020-2032) (USD Billion)
11.6.7.3 Brazil Edutainment Market Estimates and Forecasts, by Revenue Source (2020-2032) (USD Billion)
11.6.7.4 Brazil Edutainment Market Estimates and Forecasts, by Visitor Demographics (2020-2032) (USD Billion)
11.6.8 Argentina
11.6.8.1 Argentina Edutainment Market Estimates and Forecasts, by Gaming Type (2020-2032) (USD Billion)
11.6.8.2 Argentina Edutainment Market Estimates and Forecasts, by Facility Size (2020-2032) (USD Billion)
11.6.8.3 Argentina Edutainment Market Estimates and Forecasts, by Revenue Source (2020-2032) (USD Billion)
11.6.8.4 Argentina Edutainment Market Estimates and Forecasts, by Visitor Demographics (2020-2032) (USD Billion)
11.6.9 Colombia
11.6.9.1 Colombia Edutainment Market Estimates and Forecasts, by Gaming Type (2020-2032) (USD Billion)
11.6.9.2 Colombia Edutainment Market Estimates and Forecasts, by Facility Size (2020-2032) (USD Billion)
11.6.9.3 Colombia Edutainment Market Estimates and Forecasts, by Revenue Source (2020-2032) (USD Billion)
11.6.9.4 Colombia Edutainment Market Estimates and Forecasts, by Visitor Demographics (2020-2032) (USD Billion)
11.6.10 Rest of Latin America
11.6.10.1 Rest of Latin America Edutainment Market Estimates and Forecasts, by Gaming Type (2020-2032) (USD Billion)
11.6.10.2 Rest of Latin America Edutainment Market Estimates and Forecasts, by Facility Size (2020-2032) (USD Billion)
11.6.10.3 Rest of Latin America Edutainment Market Estimates and Forecasts, by Revenue Source (2020-2032) (USD Billion)
11.6.10.4 Rest of Latin America Edutainment Market Estimates and Forecasts, by Visitor Demographics (2020-2032) (USD Billion)
12. Company Profiles
12.1 LeapFrog Enterprises, Inc.
12.1.1 Company Overview
12.1.2 Financial
12.1.3 Products/ Services Offered
12.1.4 SWOT Analysis
12.2 Disney Interactive
12.2.1 Company Overview
12.2.2 Financial
12.2.3 Products/ Services Offered
12.2.4 SWOT Analysis
12.3 Nickelodeon (ViacomCBS)
12.3.1 Company Overview
12.3.2 Financial
12.3.3 Products/ Services Offered
12.3.4 SWOT Analysis
12.4 VTech Communications, Inc.
12.4.1 Company Overview
12.4.2 Financial
12.4.3 Products/ Services Offered
12.4.4 SWOT Analysis
12.5 Osmo (By Tangible Play, Inc.)
12.5.1 Company Overview
12.5.2 Financial
12.5.3 Products/ Services Offered
12.5.4 SWOT Analysis
12.6 Samsung Electronics
12.6.1 Company Overview
12.6.2 Financial
12.6.3 Products/ Services Offered
12.6.4 SWOT Analysis
12.7 Mattel, Inc.
12.7.1 Company Overview
12.7.2 Financial
12.7.3 Products/ Services Offered
12.7.4 SWOT Analysis
12.8 Kahoot!
12.8.1 Company Overview
12.8.2 Financial
12.8.3 Products/ Services Offered
12.8.4 SWOT Analysis
12.9 Pixar Animation Studios
12.9.1 Company Overview
12.9.2 Financial
12.9.3 Products/ Services Offered
12.9.4 SWOT Analysis
12.10 Razor USA LLC
12.10.1 Company Overview
12.10.2 Financial
12.10.3 Products/ Services Offered
12.10.4 SWOT Analysis
13. Use Cases and Best Practices
14. Conclusion
An accurate research report requires proper strategizing as well as implementation. There are multiple factors involved in the completion of good and accurate research report and selecting the best methodology to compete the research is the toughest part. Since the research reports we provide play a crucial role in any company’s decision-making process, therefore we at SNS Insider always believe that we should choose the best method which gives us results closer to reality. This allows us to reach at a stage wherein we can provide our clients best and accurate investment to output ratio.
Each report that we prepare takes a timeframe of 350-400 business hours for production. Starting from the selection of titles through a couple of in-depth brain storming session to the final QC process before uploading our titles on our website we dedicate around 350 working hours. The titles are selected based on their current market cap and the foreseen CAGR and growth.
The 5 steps process:
Step 1: Secondary Research:
Secondary Research or Desk Research is as the name suggests is a research process wherein, we collect data through the readily available information. In this process we use various paid and unpaid databases which our team has access to and gather data through the same. This includes examining of listed companies’ annual reports, Journals, SEC filling etc. Apart from this our team has access to various associations across the globe across different industries. Lastly, we have exchange relationships with various university as well as individual libraries.
Step 2: Primary Research
When we talk about primary research, it is a type of study in which the researchers collect relevant data samples directly, rather than relying on previously collected data. This type of research is focused on gaining content specific facts that can be sued to solve specific problems. Since the collected data is fresh and first hand therefore it makes the study more accurate and genuine.
We at SNS Insider have divided Primary Research into 2 parts.
Part 1 wherein we interview the KOLs of major players as well as the upcoming ones across various geographic regions. This allows us to have their view over the market scenario and acts as an important tool to come closer to the accurate market numbers. As many as 45 paid and unpaid primary interviews are taken from both the demand and supply side of the industry to make sure we land at an accurate judgement and analysis of the market.
This step involves the triangulation of data wherein our team analyses the interview transcripts, online survey responses and observation of on filed participants. The below mentioned chart should give a better understanding of the part 1 of the primary interview.
Part 2: In this part of primary research the data collected via secondary research and the part 1 of the primary research is validated with the interviews from individual consultants and subject matter experts.
Consultants are those set of people who have at least 12 years of experience and expertise within the industry whereas Subject Matter Experts are those with at least 15 years of experience behind their back within the same space. The data with the help of two main processes i.e., FGDs (Focused Group Discussions) and IDs (Individual Discussions). This gives us a 3rd party nonbiased primary view of the market scenario making it a more dependable one while collation of the data pointers.
Step 3: Data Bank Validation
Once all the information is collected via primary and secondary sources, we run that information for data validation. At our intelligence centre our research heads track a lot of information related to the market which includes the quarterly reports, the daily stock prices, and other relevant information. Our data bank server gets updated every fortnight and that is how the information which we collected using our primary and secondary information is revalidated in real time.
Step 4: QA/QC Process
After all the data collection and validation our team does a final level of quality check and quality assurance to get rid of any unwanted or undesired mistakes. This might include but not limited to getting rid of the any typos, duplication of numbers or missing of any important information. The people involved in this process include technical content writers, research heads and graphics people. Once this process is completed the title gets uploader on our platform for our clients to read it.
Step 5: Final QC/QA Process:
This is the last process and comes when the client has ordered the study. In this process a final QA/QC is done before the study is emailed to the client. Since we believe in giving our clients a good experience of our research studies, therefore, to make sure that we do not lack at our end in any way humanly possible we do a final round of quality check and then dispatch the study to the client.
Key Segments:
By Gaming Type
Interactive
Non-interactive
Explorative
Hybrid Combination
By Facility Size
5,001 to 10,000 Sq. Ft.
10,001 to 20,000 Sq. Ft.
20,001 to 40,000 Sq. Ft.
>40,000 Sq. Ft.
By Revenue Source
Entry fees & tickets
Food & Beverages
Merchandising
Advertising
Others
By Visitor Demographics
Children (0 to 12)
Teenager (13 to 18)
Young Adult (19 to 25)
Adult (25+)
Request for Segment Customization as per your Business Requirement: Segment Customization Request
REGIONAL COVERAGE:
North America
US
Canada
Mexico
Europe
Eastern Europe
Poland
Romania
Hungary
Turkey
Rest of Eastern Europe
Western Europe
Germany
France
UK
Italy
Spain
Netherlands
Switzerland
Austria
Rest of Western Europe
Asia-Pacific
China
India
Japan
South Korea
Vietnam
Singapore
Australia
Rest of Asia Pacific
Middle East & Africa
Middle East
UAE
Egypt
Saudi Arabia
Qatar
Rest of the Middle East
Africa
Nigeria
South Africa
Rest of Africa
Latin America
Brazil
Argentina
Colombia
Rest of Latin America
Request for Country Level Research Report: Country Level Customization Request
Available Customization
With the given market data, SNS Insider offers customization as per the company’s specific needs. The following customization options are available for the report:
Product Analysis
Criss-Cross segment analysis (e.g. Product X Application)
Product Matrix which gives a detailed comparison of the product portfolio of each company
Geographic Analysis
Additional countries in any of the regions
Company Information
Detailed analysis and profiling of additional market players (Up to five)
The Learning Management System (LMS) Market Size was valued at USD 20.9 Bn in 2023 and will reach USD 95.4 Bn by 2032, growing at a CAGR of 18.4% by 2032.
The Image Recognition Market Size was valued at USD 45.6 Billion in 2023 and will reach USD 165.2 Billion by 2032, growing at a CAGR of 15.4% by 2032.
Bot Services Market Size was valued at USD 2.09 Billion in 2023 and is expected to reach USD 29.15 Billion by 2032 & grow at a CAGR of 34.02% by 2024-2032
The Network Probe Market Size was valued at USD 1.17 Billion in 2023 and is expected to reach USD 4.03 Billion by 2032 and grow at a CAGR of 15.54% over the forecast period 2024-2032.
Business Process Management Market was worth USD 15.07 billion in 2023 and is predicted to be worth USD 50.35 billion by 2032, growing at a CAGR of 14.37% between 2024 and 2032.
The 5G base station Market Size was valued at USD 31.7 Billion in 2023 & is expected to reach USD 340.3 Billion by 2032, growing at a CAGR of 30.2% by 2032.
Hi! Click one of our member below to chat on Phone