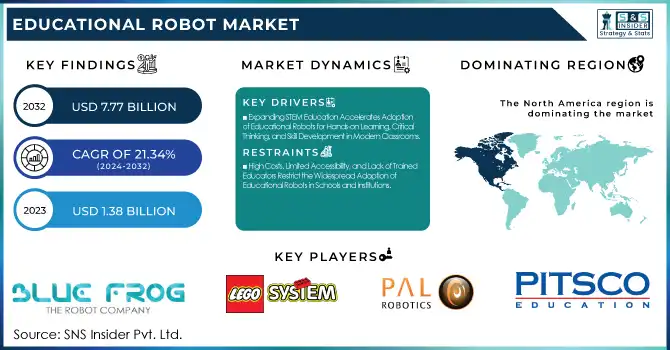
The Educational Robot Market was valued at USD 1.38 billion in 2023 and is expected to reach USD 7.77 billion by 2032, growing at a CAGR of 21.34% from 2024-2032. This report includes a comprehensive analysis of technology adoption rates, investment and funding trends, customer preferences and demand, and impact metrics, providing insights into the market's growth drivers and future potential. The increasing demand for innovative learning solutions, advancements in robotics and AI, and the shift towards STEM education are key factors driving market growth. Additionally, rising investments and growing customer interest in interactive and personalized educational tools are further fueling the market's expansion.
To Get more information on Educational Robot Market - Request Free Sample Report
Drivers
Expanding STEM Education Accelerates Adoption of Educational Robots for Hands-on Learning, Critical Thinking, and Skill Development in Modern Classrooms
The increased emphasis on science, technology, engineering, and math (STEM) education is driving the demand for more sophisticated learning solutions that increase participation and real-world understanding. Educational robots are being integrated more into the classroom to enhance experiential learning, critical thinking, and problem-solving abilities. Robotics is being implemented by schools and institutions to make STEM more interactive and accessible, stimulating students to learn coding, programming, and engineering skills. Governments and educational authorities are also encouraging robotics-based education through funding and curriculum inclusion. Moreover, technological developments in artificial intelligence (AI) and machine learning (ML) are continually enhancing robot functions, making them increasingly responsive to individualized learning experiences, thus solidifying their position in contemporary education systems.
Restraints
High Costs, Limited Accessibility, and Lack of Trained Educators Restrict the Widespread Adoption of Educational Robots in Schools and Institutions
The initial cost of high-priced educational robots, such as procurement, maintenance, and software updates, is a major hindrance to mass adoption, particularly for financially constrained schools and developing countries. Affordability is a challenge for most institutions, thereby reducing access to robotics-based learning resources. Furthermore, the unavailability of skilled teachers who are knowledgeable in robotics and programming is another limiting factor to effective application. Integration into current curricula can also be challenging, necessitating extensive adaptation processes. In addition, data privacy and cybersecurity concerns related to AI-powered robots could hinder adoption in some areas. Although technological innovation continues to enhance affordability and user-friendliness, cost and accessibility are the most significant obstacles to market growth.
Opportunities
AI Integration, Personalized Learning, and Rising Demand in Emerging Markets Drive Growth Opportunities for Educational Robots in Modern Education
The growing emphasis on personalized learning represents a significant opportunity, as education robots powered by AI have the capability to be responsive to unique student requirements, improving engagement and learning results. Increasing uptake in developing markets, fueled by government plans and investments in digital learning, is expanding customer numbers. Developments in AI and machine learning are allowing robots to become more intuitive and interactive, further enhancing their attractiveness. Furthermore, increasing the need for learning about coding and robotics at an early age is opening up new paths for expansion for the market. The inclusion of cloud-based applications and remote learning platforms is also improving accessibility, and educational robots are becoming a critical component of contemporary digital education systems.
Challenges
Curriculum Complexity, Lack of Trained Educators, and Resistance to Change Hinder the Seamless Integration of Educational Robots in Classrooms
Integrating educational robots into current curricula is a major challenge, as schools and institutions have to reorganize teaching methods to accommodate robotics-based learning. Most teachers struggle to adjust lesson plans to incorporate hands-on robotics exercises without compromising on academic standards. The absence of well-structured guidelines and standardized frameworks adds to the challenge, necessitating extra time and resources for curriculum design. Further, the lack of qualified teachers versed in programming and robotics impedes effective deployment, diminishing their potential contribution to student learning. Resistance to technology from established schools and instructors likewise hinders deployment, as many are reluctant to substitute traditional modes of instruction for dynamic robotic responses. These complications of integration serve to limit greater utilization of schooling robots in class.
By Product
Non-humanoid learning robots accounted for 62% of revenues in 2023 with their affordability, ease of implementation, and large usage in STEM schooling. They find extensive application across schools in experiential learning and computer-programming instruction through robotic kits, coding systems, and AI-facilitated learning aids. Their multi-capacity applications of teaching programming, problem-solving skills, and basic robotics skills led to their suitability for adoption across schools. Besides, their lower cost of manufacturing and maintenance than humanoid robots also makes them highly competitive in the market.
The humanoid segment will expand at the fastest CAGR of 22.67% during 2024-2032, propelled by developments in AI, machine learning, and human-like interaction abilities. Such robots are more and more employed for individualized learning, special education, and language training and provide more interactive and immersive experiences. Their capacity to replicate human movements and facial expressions increases student interaction, making them perfect for social and emotional learning. With advancing technology and decreasing costs, the use of humanoid robots in education is likely to grow tremendously.
By Component
The hardware segment led the educational robot market with a 64% revenue share in 2023 because of the high demand for robotic kits, sensors, actuators, and controllers utilized in schools. The initial expenses of production and acquisition of physical robotic systems are among the factors driving this segment's top-line leadership. Educational institutions prefer to invest in robust and engaging robotic systems for improving hands-on learning. Furthermore, increasing incorporation of AI-based robotic platforms continues to bolster demand for sophisticated hardware components in the market.
The software segment would witness the fastest CAGR of 22.38% during 2024 to 2032, as AI, machine learning, and cloud-based learning platforms gain higher adoption. The trend towards adaptive and personalized learning solutions is triggering demand for sophisticated software that enriches robotic capabilities. Interactive coding environments, simulation software, and cloud-based educational software are gaining popularity, facilitating more available and scalable learning models. Regular software upgrades and developments in AI further drive the strong growth of this segment.
By Application
The secondary education segment led the market for educational robots with a 40% revenue share in 2023 owing to the rising emphasis on learning STEM, coding, and robotics at middle schools and high schools. Schools are incorporating robotics in courses to boost problem-solving, programming, and engineering capabilities. The need for sophisticated robotic kits and AI-based learning solutions is greater in secondary education, as students work on more advanced projects. Moreover, government policy encouraging STEM education further propels uptake in this segment.
The primary education segment is set to expand at the fastest CAGR of 22.79% from 2024 to 2032, propelled by growing focus on early child STEM education and interactive learning. Schools are increasingly bringing robotics into schools at an early age to create fundamental coding and problem-solving abilities. The ease of availability of simple, easy-to-use robotic kits designed for young students is also driving adoption faster. Also, growing investments in education technology and gamified learning solutions are further making robotics accessible in primary school environments.
Regional Analysis
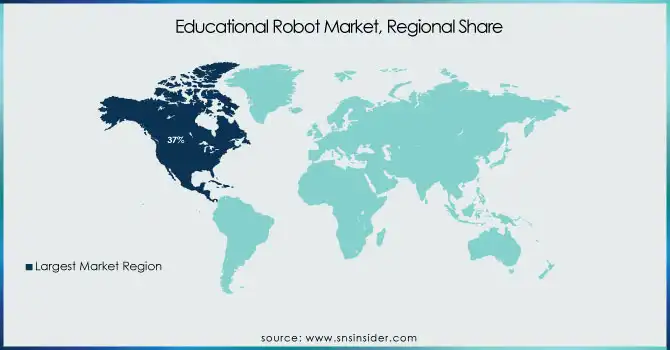
North America led the educational robot market with a 37% revenue share in 2023 based on the prevalent presence of superior educational institutions, significant investment in EdTech, and extensive usage of STEM-based education. Government programs and financing for robotics integration in schools further propel market expansion. The region also enjoys the presence of the major market players, which facilitates ongoing innovation. Also, the increase in demand for AI-driven learning robots in institutions of higher learning and research adds to North America's market lead.
Asia Pacific will grow with the fastest CAGR of 23.06% during the forecast period from 2024 to 2032, triggered by growing digital education investments, government policies boosting STEM education, and fast adoption of EdTech. China, Japan, and South Korea are at the forefront of robotics learning, incorporating AI-driven learning technology into education programs. Growing need for affordable and engaging learning products and solutions, in addition to increasing student base, is driving growth in the market. Growing knowledge of coding and robotics learning across emerging markets is also propelling growth.
Get Customized Report as per Your Business Requirement - Enquiry Now
Aisoy Robotics (Aisoy 1, Aisoy 2)
Blue Frog Robotics (Buddy, Buddy Developer Edition)
LEGO Systems A/S (LEGO Mindstorms Robot Inventor, LEGO Education SPIKE Prime)
Modular Robotics (Cubelets Robot Blocks, Cubelets Snap Together Robots)
PAL Robotics (REEM-C, TALOS)
Pitsco Education LLC (Moss Robotics, TETRIX Robotics)
ROBOTIS Inc. (ROBOTIS MINI, BIOLOID Premium Kit)
SoftBank Robotics Group (Pepper, NAO)
RM Educational Resources Ltd. (Pro-Bot, Blue-Bot)
Learning Resources (Botley 2.0, Code & Go Robot Mouse)
Educational Insights (Artie 3000, Code & Go Robot Mouse)
Universal Robots (UR3e, UR5e)
PROBOTICS AMERICA (Pioneer, Rebotics)
ABB Group (YuMi, ABB Robotics)
SoapBoxLabs (SoapBox Engine, SoapBox SDK)
YASKAWA ELECTRIC CORPORATION (MOTOMAN, YASKAWA Robotics)
Seiko Epson Corporation (Epson Robots, Epson SCARA Robots)
KUKA (KUKA Robotics, KUKA LBR iiwa)
KinderLab Robotics (KIBO, KIBO 21)
Robolink (RoboLink CoDrone, RoboLink Rokit Smart)
Hanson Robotics (Sophia, Han)
Sanbot Innovation Technology (Sanbot Elf, Sanbot Max)
HYULIM ROBOT (HYULIM, AMR Robot)
FANUC CORPORATION (FANUC LR Mate, FANUC M-20iA)
UBTECH Robotics (Jimu Robot, Alpha 1S)
On August 6, 2024, LEGO® Education launched the FIRST® LEGO® League 2024-2025 season with the theme "SUBMERGED℠", focusing on ocean exploration. This STEM competition encourages students aged 4-16 to build, code, and research real-world challenges.
On January 7, 2025, KinderLab Robotics announced "Exploring with KIBO", a new 60-hour curriculum for grades 3-5, expanding its screen-free robotics education program. The curriculum builds on KIBO’s success in early childhood learning, integrating computational thinking with subjects like math, science, and English.
2024: RM Educational Resources collaborated with Brooke Weston Trust to enhance IT infrastructure across schools, improving cybersecurity, network upgrades, and cloud-based systems. The initiative aims to streamline school operations and digital learning.
| Report Attributes | Details |
|---|---|
| Market Size in 2023 | USD 1.38 Billion |
| Market Size by 2032 | USD 7.77 Billion |
| CAGR | CAGR of 21.24% From 2024 to 2032 |
| Base Year | 2023 |
| Forecast Period | 2024-2032 |
| Historical Data | 2020-2022 |
| Report Scope & Coverage | Market Size, Segments Analysis, Competitive Landscape, Regional Analysis, DROC & SWOT Analysis, Forecast Outlook |
| Key Segments | • By Product (Humanoid, Non-Humanoid) • By Application (Primary Education, Secondary Education, Higher Education, Others) • By Component (Hardware, Software) |
| Regional Analysis/Coverage | North America (US, Canada, Mexico), Europe (Eastern Europe [Poland, Romania, Hungary, Turkey, Rest of Eastern Europe] Western Europe] Germany, France, UK, Italy, Spain, Netherlands, Switzerland, Austria, Rest of Western Europe]), Asia Pacific (China, India, Japan, South Korea, Vietnam, Singapore, Australia, Rest of Asia Pacific), Middle East & Africa (Middle East [UAE, Egypt, Saudi Arabia, Qatar, Rest of Middle East], Africa [Nigeria, South Africa, Rest of Africa], Latin America (Brazil, Argentina, Colombia, Rest of Latin America) |
| Company Profiles | Aisoy Robotics, Blue Frog Robotics, LEGO Systems A/S, Modular Robotics, PAL Robotics, Pitsco Education LLC, ROBOTIS Inc., SoftBank Robotics Group, RM Educational Resources Ltd., Learning Resources, Educational Insights, Universal Robots, PROBOTICS AMERICA, ABB Group, SoapBoxLabs, YASKAWA ELECTRIC CORPORATION, Seiko Epson Corporation, KUKA, KinderLab Robotics, Robolink, Hanson Robotics, Sanbot Innovation Technology, HYULIM ROBOT, FANUC CORPORATION, UBTECH Robotics. |
ANS: Educational Robot Market was valued at USD 1.38 billion in 2023 and is expected to reach USD 7.77 billion by 2032, growing at a CAGR of 21.34% from 2024-2032.
ANS: The non-humanoid segment held the highest revenue share of 62% in 2023 due to affordability and widespread use in STEM education.
ANS: The hardware segment led with a 64% revenue share in 2023 due to high demand for robotic kits, sensors, actuators, and controllers used in education.
ANS: The secondary education segment dominated with a 40% revenue share due to increased STEM education integration and advanced robotics projects.
ANS: North America dominated with a 37% revenue share, supported by high EdTech investments, strong STEM education adoption, and government initiatives.
Table of Contents:
1. Introduction
1.1 Market Definition
1.2 Scope (Inclusion and Exclusions)
1.3 Research Assumptions
2. Executive Summary
2.1 Market Overview
2.2 Regional Synopsis
2.3 Competitive Summary
3. Research Methodology
3.1 Top-Down Approach
3.2 Bottom-up Approach
3.3. Data Validation
3.4 Primary Interviews
4. Market Dynamics Impact Analysis
4.1 Market Driving Factors Analysis
4.1.1 Drivers
4.1.2 Restraints
4.1.3 Opportunities
4.1.4 Challenges
4.2 PESTLE Analysis
4.3 Porter’s Five Forces Model
5. Statistical Insights and Trends Reporting
5.1 Technology Adoption Rates
5.2 Investment and Funding Trends
5.3 Customer Preferences & Demand
5.4 Impact Metrics
6. Competitive Landscape
6.1 List of Major Companies, By Region
6.2 Market Share Analysis, By Region
6.3 Product Benchmarking
6.3.1 Product specifications and features
6.3.2 Pricing
6.4 Strategic Initiatives
6.4.1 Marketing and promotional activities
6.4.2 Distribution and supply chain strategies
6.4.3 Expansion plans and new product launches
6.4.4 Strategic partnerships and collaborations
6.5 Technological Advancements
6.6 Market Positioning and Branding
7. Educational Robot Market Segmentation, By Product
7.1 Chapter Overview
7.2 Humanoid
7.2.1 Humanoid Market Trends Analysis (2020-2032)
7.2.2 Humanoid Market Size Estimates and Forecasts to 2032 (USD Billion)
7.3 Non-Humanoid
7.3.1 Non-Humanoid Market Trends Analysis (2020-2032)
7.3.2 Non-Humanoid Market Size Estimates and Forecasts to 2032 (USD Billion)
8. Educational Robot Market Segmentation, By Application
8.1 Chapter Overview
8.2 Primary Education
8.2.1 Primary Education Market Trends Analysis (2020-2032)
8.2.2 Primary Education Market Size Estimates and Forecasts to 2032 (USD Billion)
8.3 Secondary Education
8.3.1 Secondary Education Market Trends Analysis (2020-2032)
8.3.2 Secondary Education Market Size Estimates and Forecasts to 2032 (USD Billion)
8.4 Higher Education
8.4.1 Higher Education Market Trends Analysis (2020-2032)
8.4.2 Higher Education Market Size Estimates and Forecasts to 2032 (USD Billion)
8.5 Others
8.5.1 Others Market Trends Analysis (2020-2032)
8.5.2 Others Market Size Estimates and Forecasts to 2032 (USD Billion)
9. Educational Robot Market Segmentation, By Component
9.1 Chapter Overview
9.2 Hardware
9.2.1 Hardware Market Trends Analysis (2020-2032)
9.2.2 Hardware Market Size Estimates and Forecasts to 2032 (USD Billion)
9.3 Software
9.3.1 Software Market Trends Analysis (2020-2032)
9.3.2 Software Market Size Estimates and Forecasts to 2032 (USD Billion)
10. Regional Analysis
10.1 Chapter Overview
10.2 North America
10.2.1 Trends Analysis
10.2.2 North America Educational Robot Market Estimates and Forecasts, by Country (2020-2032) (USD Billion)
10.2.3 North America Educational Robot Market Estimates and Forecasts, By Product (2020-2032) (USD Billion)
10.2.4 North America Educational Robot Market Estimates and Forecasts, By Application (2020-2032) (USD Billion)
10.2.5 North America Educational Robot Market Estimates and Forecasts, By Component (2020-2032) (USD Billion)
10.2.6 USA
10.2.6.1 USA Educational Robot Market Estimates and Forecasts, By Product (2020-2032) (USD Billion)
10.2.6.2 USA Educational Robot Market Estimates and Forecasts, By Application (2020-2032) (USD Billion)
10.2.6.3 USA Educational Robot Market Estimates and Forecasts, By Component (2020-2032) (USD Billion)
10.2.7 Canada
10.2.7.1 Canada Educational Robot Market Estimates and Forecasts, By Product (2020-2032) (USD Billion)
10.2.7.2 Canada Educational Robot Market Estimates and Forecasts, By Application (2020-2032) (USD Billion)
10.2.7.3 Canada Educational Robot Market Estimates and Forecasts, By Component (2020-2032) (USD Billion)
10.2.8 Mexico
10.2.8.1 Mexico Educational Robot Market Estimates and Forecasts, By Product (2020-2032) (USD Billion)
10.2.8.2 Mexico Educational Robot Market Estimates and Forecasts, By Application (2020-2032) (USD Billion)
10.2.8.3 Mexico Educational Robot Market Estimates and Forecasts, By Component (2020-2032) (USD Billion)
10.3 Europe
10.3.1 Eastern Europe
10.3.1.1 Trends Analysis
10.3.1.2 Eastern Europe Educational Robot Market Estimates and Forecasts, by Country (2020-2032) (USD Billion)
10.3.1.3 Eastern Europe Educational Robot Market Estimates and Forecasts, By Product (2020-2032) (USD Billion)
10.3.1.4 Eastern Europe Educational Robot Market Estimates and Forecasts, By Application (2020-2032) (USD Billion)
10.3.1.5 Eastern Europe Educational Robot Market Estimates and Forecasts, By Component (2020-2032) (USD Billion)
10.3.1.6 Poland
10.3.1.6.1 Poland Educational Robot Market Estimates and Forecasts, By Product (2020-2032) (USD Billion)
10.3.1.6.2 Poland Educational Robot Market Estimates and Forecasts, By Application (2020-2032) (USD Billion)
10.3.1.6.3 Poland Educational Robot Market Estimates and Forecasts, By Component (2020-2032) (USD Billion)
10.3.1.7 Romania
10.3.1.7.1 Romania Educational Robot Market Estimates and Forecasts, By Product (2020-2032) (USD Billion)
10.3.1.7.2 Romania Educational Robot Market Estimates and Forecasts, By Application (2020-2032) (USD Billion)
10.3.1.7.3 Romania Educational Robot Market Estimates and Forecasts, By Component (2020-2032) (USD Billion)
10.3.1.8 Hungary
10.3.1.8.1 Hungary Educational Robot Market Estimates and Forecasts, By Product (2020-2032) (USD Billion)
10.3.1.8.2 Hungary Educational Robot Market Estimates and Forecasts, By Application (2020-2032) (USD Billion)
10.3.1.8.3 Hungary Educational Robot Market Estimates and Forecasts, By Component (2020-2032) (USD Billion)
10.3.1.9 Turkey
10.3.1.9.1 Turkey Educational Robot Market Estimates and Forecasts, By Product (2020-2032) (USD Billion)
10.3.1.9.2 Turkey Educational Robot Market Estimates and Forecasts, By Application (2020-2032) (USD Billion)
10.3.1.9.3 Turkey Educational Robot Market Estimates and Forecasts, By Component (2020-2032) (USD Billion)
10.3.1.10 Rest of Eastern Europe
10.3.1.10.1 Rest of Eastern Europe Educational Robot Market Estimates and Forecasts, By Product (2020-2032) (USD Billion)
10.3.1.10.2 Rest of Eastern Europe Educational Robot Market Estimates and Forecasts, By Application (2020-2032) (USD Billion)
10.3.1.10.3 Rest of Eastern Europe Educational Robot Market Estimates and Forecasts, By Component (2020-2032) (USD Billion)
10.3.2 Western Europe
10.3.2.1 Trends Analysis
10.3.2.2 Western Europe Educational Robot Market Estimates and Forecasts, by Country (2020-2032) (USD Billion)
10.3.2.3 Western Europe Educational Robot Market Estimates and Forecasts, By Product (2020-2032) (USD Billion)
10.3.2.4 Western Europe Educational Robot Market Estimates and Forecasts, By Application (2020-2032) (USD Billion)
10.3.2.5 Western Europe Educational Robot Market Estimates and Forecasts, By Component (2020-2032) (USD Billion)
10.3.2.6 Germany
10.3.2.6.1 Germany Educational Robot Market Estimates and Forecasts, By Product (2020-2032) (USD Billion)
10.3.2.6.2 Germany Educational Robot Market Estimates and Forecasts, By Application (2020-2032) (USD Billion)
10.3.2.6.3 Germany Educational Robot Market Estimates and Forecasts, By Component (2020-2032) (USD Billion)
10.3.2.7 France
10.3.2.7.1 France Educational Robot Market Estimates and Forecasts, By Product (2020-2032) (USD Billion)
10.3.2.7.2 France Educational Robot Market Estimates and Forecasts, By Application (2020-2032) (USD Billion)
10.3.2.7.3 France Educational Robot Market Estimates and Forecasts, By Component (2020-2032) (USD Billion)
10.3.2.8 UK
10.3.2.8.1 UK Educational Robot Market Estimates and Forecasts, By Product (2020-2032) (USD Billion)
10.3.2.8.2 UK Educational Robot Market Estimates and Forecasts, By Application (2020-2032) (USD Billion)
10.3.2.8.3 UK Educational Robot Market Estimates and Forecasts, By Component (2020-2032) (USD Billion)
10.3.2.9 Italy
10.3.2.9.1 Italy Educational Robot Market Estimates and Forecasts, By Product (2020-2032) (USD Billion)
10.3.2.9.2 Italy Educational Robot Market Estimates and Forecasts, By Application (2020-2032) (USD Billion)
10.3.2.9.3 Italy Educational Robot Market Estimates and Forecasts, By Component (2020-2032) (USD Billion)
10.3.2.10 Spain
10.3.2.10.1 Spain Educational Robot Market Estimates and Forecasts, By Product (2020-2032) (USD Billion)
10.3.2.10.2 Spain Educational Robot Market Estimates and Forecasts, By Application (2020-2032) (USD Billion)
10.3.2.10.3 Spain Educational Robot Market Estimates and Forecasts, By Component (2020-2032) (USD Billion)
10.3.2.11 Netherlands
10.3.2.11.1 Netherlands Educational Robot Market Estimates and Forecasts, By Product (2020-2032) (USD Billion)
10.3.2.11.2 Netherlands Educational Robot Market Estimates and Forecasts, By Application (2020-2032) (USD Billion)
10.3.2.11.3 Netherlands Educational Robot Market Estimates and Forecasts, By Component (2020-2032) (USD Billion)
10.3.2.12 Switzerland
10.3.2.12.1 Switzerland Educational Robot Market Estimates and Forecasts, By Product (2020-2032) (USD Billion)
10.3.2.12.2 Switzerland Educational Robot Market Estimates and Forecasts, By Application (2020-2032) (USD Billion)
10.3.2.12.3 Switzerland Educational Robot Market Estimates and Forecasts, By Component (2020-2032) (USD Billion)
10.3.2.13 Austria
10.3.2.13.1 Austria Educational Robot Market Estimates and Forecasts, By Product (2020-2032) (USD Billion)
10.3.2.13.2 Austria Educational Robot Market Estimates and Forecasts, By Application (2020-2032) (USD Billion)
10.3.2.13.3 Austria Educational Robot Market Estimates and Forecasts, By Component (2020-2032) (USD Billion)
10.3.2.14 Rest of Western Europe
10.3.2.14.1 Rest of Western Europe Educational Robot Market Estimates and Forecasts, By Product (2020-2032) (USD Billion)
10.3.2.14.2 Rest of Western Europe Educational Robot Market Estimates and Forecasts, By Application (2020-2032) (USD Billion)
10.3.2.14.3 Rest of Western Europe Educational Robot Market Estimates and Forecasts, By Component (2020-2032) (USD Billion)
10.4 Asia Pacific
10.4.1 Trends Analysis
10.4.2 Asia Pacific Educational Robot Market Estimates and Forecasts, by Country (2020-2032) (USD Billion)
10.4.3 Asia Pacific Educational Robot Market Estimates and Forecasts, By Product (2020-2032) (USD Billion)
10.4.4 Asia Pacific Educational Robot Market Estimates and Forecasts, By Application (2020-2032) (USD Billion)
10.4.5 Asia Pacific Educational Robot Market Estimates and Forecasts, By Component (2020-2032) (USD Billion)
10.4.6 China
10.4.6.1 China Educational Robot Market Estimates and Forecasts, By Product (2020-2032) (USD Billion)
10.4.6.2 China Educational Robot Market Estimates and Forecasts, By Application (2020-2032) (USD Billion)
10.4.6.3 China Educational Robot Market Estimates and Forecasts, By Component (2020-2032) (USD Billion)
10.4.7 India
10.4.7.1 India Educational Robot Market Estimates and Forecasts, By Product (2020-2032) (USD Billion)
10.4.7.2 India Educational Robot Market Estimates and Forecasts, By Application (2020-2032) (USD Billion)
10.4.7.3 India Educational Robot Market Estimates and Forecasts, By Component (2020-2032) (USD Billion)
10.4.8 Japan
10.4.8.1 Japan Educational Robot Market Estimates and Forecasts, By Product (2020-2032) (USD Billion)
10.4.8.2 Japan Educational Robot Market Estimates and Forecasts, By Application (2020-2032) (USD Billion)
10.4.8.3 Japan Educational Robot Market Estimates and Forecasts, By Component (2020-2032) (USD Billion)
10.4.9 South Korea
10.4.9.1 South Korea Educational Robot Market Estimates and Forecasts, By Product (2020-2032) (USD Billion)
10.4.9.2 South Korea Educational Robot Market Estimates and Forecasts, By Application (2020-2032) (USD Billion)
10.4.9.3 South Korea Educational Robot Market Estimates and Forecasts, By Component (2020-2032) (USD Billion)
10.4.10 Vietnam
10.4.10.1 Vietnam Educational Robot Market Estimates and Forecasts, By Product (2020-2032) (USD Billion)
10.4.10.2 Vietnam Educational Robot Market Estimates and Forecasts, By Application (2020-2032) (USD Billion)
10.4.10.3 Vietnam Educational Robot Market Estimates and Forecasts, By Component (2020-2032) (USD Billion)
10.4.11 Singapore
10.4.11.1 Singapore Educational Robot Market Estimates and Forecasts, By Product (2020-2032) (USD Billion)
10.4.11.2 Singapore Educational Robot Market Estimates and Forecasts, By Application (2020-2032) (USD Billion)
10.4.11.3 Singapore Educational Robot Market Estimates and Forecasts, By Component (2020-2032) (USD Billion)
10.4.12 Australia
10.4.12.1 Australia Educational Robot Market Estimates and Forecasts, By Product (2020-2032) (USD Billion)
10.4.12.2 Australia Educational Robot Market Estimates and Forecasts, By Application (2020-2032) (USD Billion)
10.4.12.3 Australia Educational Robot Market Estimates and Forecasts, By Component (2020-2032) (USD Billion)
10.4.13 Rest of Asia Pacific
10.4.13.1 Rest of Asia Pacific Educational Robot Market Estimates and Forecasts, By Product (2020-2032) (USD Billion)
10.4.13.2 Rest of Asia Pacific Educational Robot Market Estimates and Forecasts, By Application (2020-2032) (USD Billion)
10.4.13.3 Rest of Asia Pacific Educational Robot Market Estimates and Forecasts, By Component (2020-2032) (USD Billion)
10.5 Middle East and Africa
10.5.1 Middle East
10.5.1.1 Trends Analysis
10.5.1.2 Middle East Educational Robot Market Estimates and Forecasts, by Country (2020-2032) (USD Billion)
10.5.1.3 Middle East Educational Robot Market Estimates and Forecasts, By Product (2020-2032) (USD Billion)
10.5.1.4 Middle East Educational Robot Market Estimates and Forecasts, By Application (2020-2032) (USD Billion)
10.5.1.5 Middle East Educational Robot Market Estimates and Forecasts, By Component (2020-2032) (USD Billion)
10.5.1.6 UAE
10.5.1.6.1 UAE Educational Robot Market Estimates and Forecasts, By Product (2020-2032) (USD Billion)
10.5.1.6.2 UAE Educational Robot Market Estimates and Forecasts, By Application (2020-2032) (USD Billion)
10.5.1.6.3 UAE Educational Robot Market Estimates and Forecasts, By Component (2020-2032) (USD Billion)
10.5.1.7 Egypt
10.5.1.7.1 Egypt Educational Robot Market Estimates and Forecasts, By Product (2020-2032) (USD Billion)
10.5.1.7.2 Egypt Educational Robot Market Estimates and Forecasts, By Application (2020-2032) (USD Billion)
10.5.1.7.3 Egypt Educational Robot Market Estimates and Forecasts, By Component (2020-2032) (USD Billion)
10.5.1.8 Saudi Arabia
10.5.1.8.1 Saudi Arabia Educational Robot Market Estimates and Forecasts, By Product (2020-2032) (USD Billion)
10.5.1.8.2 Saudi Arabia Educational Robot Market Estimates and Forecasts, By Application (2020-2032) (USD Billion)
10.5.1.8.3 Saudi Arabia Educational Robot Market Estimates and Forecasts, By Component (2020-2032) (USD Billion)
10.5.1.9 Qatar
10.5.1.9.1 Qatar Educational Robot Market Estimates and Forecasts, By Product (2020-2032) (USD Billion)
10.5.1.9.2 Qatar Educational Robot Market Estimates and Forecasts, By Application (2020-2032) (USD Billion)
10.5.1.9.3 Qatar Educational Robot Market Estimates and Forecasts, By Component (2020-2032) (USD Billion)
10.5.1.10 Rest of Middle East
10.5.1.10.1 Rest of Middle East Educational Robot Market Estimates and Forecasts, By Product (2020-2032) (USD Billion)
10.5.1.10.2 Rest of Middle East Educational Robot Market Estimates and Forecasts, By Application (2020-2032) (USD Billion)
10.5.1.10.3 Rest of Middle East Educational Robot Market Estimates and Forecasts, By Component (2020-2032) (USD Billion)
10.5.2 Africa
10.5.2.1 Trends Analysis
10.5.2.2 Africa Educational Robot Market Estimates and Forecasts, by Country (2020-2032) (USD Billion)
10.5.2.3 Africa Educational Robot Market Estimates and Forecasts, By Product (2020-2032) (USD Billion)
10.5.2.4 Africa Educational Robot Market Estimates and Forecasts, By Application (2020-2032) (USD Billion)
10.5.2.5 Africa Educational Robot Market Estimates and Forecasts, By Component (2020-2032) (USD Billion)
10.5.2.6 South Africa
10.5.2.6.1 South Africa Educational Robot Market Estimates and Forecasts, By Product (2020-2032) (USD Billion)
10.5.2.6.2 South Africa Educational Robot Market Estimates and Forecasts, By Application (2020-2032) (USD Billion)
10.5.2.6.3 South Africa Educational Robot Market Estimates and Forecasts, By Component (2020-2032) (USD Billion)
10.5.2.7 Nigeria
10.5.2.7.1 Nigeria Educational Robot Market Estimates and Forecasts, By Product (2020-2032) (USD Billion)
10.5.2.7.2 Nigeria Educational Robot Market Estimates and Forecasts, By Application (2020-2032) (USD Billion)
10.5.2.7.3 Nigeria Educational Robot Market Estimates and Forecasts, By Component (2020-2032) (USD Billion)
10.5.2.8 Rest of Africa
10.5.2.8.1 Rest of Africa Educational Robot Market Estimates and Forecasts, By Product (2020-2032) (USD Billion)
10.5.2.8.2 Rest of Africa Educational Robot Market Estimates and Forecasts, By Application (2020-2032) (USD Billion)
10.5.2.8.3 Rest of Africa Educational Robot Market Estimates and Forecasts, By Component (2020-2032) (USD Billion)
10.6 Latin America
10.6.1 Trends Analysis
10.6.2 Latin America Educational Robot Market Estimates and Forecasts, by Country (2020-2032) (USD Billion)
10.6.3 Latin America Educational Robot Market Estimates and Forecasts, By Product (2020-2032) (USD Billion)
10.6.4 Latin America Educational Robot Market Estimates and Forecasts, By Application (2020-2032) (USD Billion)
10.6.5 Latin America Educational Robot Market Estimates and Forecasts, By Component (2020-2032) (USD Billion)
10.6.6 Brazil
10.6.6.1 Brazil Educational Robot Market Estimates and Forecasts, By Product (2020-2032) (USD Billion)
10.6.6.2 Brazil Educational Robot Market Estimates and Forecasts, By Application (2020-2032) (USD Billion)
10.6.6.3 Brazil Educational Robot Market Estimates and Forecasts, By Component (2020-2032) (USD Billion)
10.6.7 Argentina
10.6.7.1 Argentina Educational Robot Market Estimates and Forecasts, By Product (2020-2032) (USD Billion)
10.6.7.2 Argentina Educational Robot Market Estimates and Forecasts, By Application (2020-2032) (USD Billion)
10.6.7.3 Argentina Educational Robot Market Estimates and Forecasts, By Component (2020-2032) (USD Billion)
10.6.8 Colombia
10.6.8.1 Colombia Educational Robot Market Estimates and Forecasts, By Product (2020-2032) (USD Billion)
10.6.8.2 Colombia Educational Robot Market Estimates and Forecasts, By Application (2020-2032) (USD Billion)
10.6.8.3 Colombia Educational Robot Market Estimates and Forecasts, By Component (2020-2032) (USD Billion)
10.6.9 Rest of Latin America
10.6.9.1 Rest of Latin America Educational Robot Market Estimates and Forecasts, By Product (2020-2032) (USD Billion)
10.6.9.2 Rest of Latin America Educational Robot Market Estimates and Forecasts, By Application (2020-2032) (USD Billion)
10.6.9.3 Rest of Latin America Educational Robot Market Estimates and Forecasts, By Component (2020-2032) (USD Billion)
11. Company Profiles
11.1 Aisoy Robotics
11.1.1 Company Overview
11.1.2 Financial
11.1.3 Products/ Services Offered
11.1.4 SWOT Analysis
11.2 Blue Frog Robotics
11.2.1 Company Overview
11.2.2 Financial
11.2.3 Products/ Services Offered
11.2.4 SWOT Analysis
11.3 LEGO Systems A/S
11.3.1 Company Overview
11.3.2 Financial
11.3.3 Products/ Services Offered
11.3.4 SWOT Analysis
11.4 Modular Robotics
11.4.1 Company Overview
11.4.2 Financial
11.4.3 Products/ Services Offered
11.4.4 SWOT Analysis
11.5 PAL Robotics
11.5.1 Company Overview
11.5.2 Financial
11.5.3 Products/ Services Offered
11.5.4 SWOT Analysis
11.6 Pitsco Education LLC
11.6.1 Company Overview
11.6.2 Financial
11.6.3 Products/ Services Offered
11.6.4 SWOT Analysis
11.7 ROBOTIS Inc.
11.7.1 Company Overview
11.7.2 Financial
11.7.3 Products/ Services Offered
11.7.4 SWOT Analysis
11.8 SoftBank Robotics Group
11.8.1 Company Overview
11.8.2 Financial
11.8.3 Products/ Services Offered
11.8.4 SWOT Analysis
11.9 RM Educational Resources Ltd.
11.9.1 Company Overview
11.9.2 Financial
11.9.3 Products/ Services Offered
11.9.4 SWOT Analysis
11.10 Learning Resources
11.10.1 Company Overview
11.10.2 Financial
11.10.3 Products/ Services Offered
11.10.4 SWOT Analysis
12. Use Cases and Best Practices
13. Conclusion
An accurate research report requires proper strategizing as well as implementation. There are multiple factors involved in the completion of good and accurate research report and selecting the best methodology to compete the research is the toughest part. Since the research reports we provide play a crucial role in any company’s decision-making process, therefore we at SNS Insider always believe that we should choose the best method which gives us results closer to reality. This allows us to reach at a stage wherein we can provide our clients best and accurate investment to output ratio.
Each report that we prepare takes a timeframe of 350-400 business hours for production. Starting from the selection of titles through a couple of in-depth brain storming session to the final QC process before uploading our titles on our website we dedicate around 350 working hours. The titles are selected based on their current market cap and the foreseen CAGR and growth.
The 5 steps process:
Step 1: Secondary Research:
Secondary Research or Desk Research is as the name suggests is a research process wherein, we collect data through the readily available information. In this process we use various paid and unpaid databases which our team has access to and gather data through the same. This includes examining of listed companies’ annual reports, Journals, SEC filling etc. Apart from this our team has access to various associations across the globe across different industries. Lastly, we have exchange relationships with various university as well as individual libraries.

Step 2: Primary Research
When we talk about primary research, it is a type of study in which the researchers collect relevant data samples directly, rather than relying on previously collected data. This type of research is focused on gaining content specific facts that can be sued to solve specific problems. Since the collected data is fresh and first hand therefore it makes the study more accurate and genuine.
We at SNS Insider have divided Primary Research into 2 parts.
Part 1 wherein we interview the KOLs of major players as well as the upcoming ones across various geographic regions. This allows us to have their view over the market scenario and acts as an important tool to come closer to the accurate market numbers. As many as 45 paid and unpaid primary interviews are taken from both the demand and supply side of the industry to make sure we land at an accurate judgement and analysis of the market.
This step involves the triangulation of data wherein our team analyses the interview transcripts, online survey responses and observation of on filed participants. The below mentioned chart should give a better understanding of the part 1 of the primary interview.

Part 2: In this part of primary research the data collected via secondary research and the part 1 of the primary research is validated with the interviews from individual consultants and subject matter experts.
Consultants are those set of people who have at least 12 years of experience and expertise within the industry whereas Subject Matter Experts are those with at least 15 years of experience behind their back within the same space. The data with the help of two main processes i.e., FGDs (Focused Group Discussions) and IDs (Individual Discussions). This gives us a 3rd party nonbiased primary view of the market scenario making it a more dependable one while collation of the data pointers.
Step 3: Data Bank Validation
Once all the information is collected via primary and secondary sources, we run that information for data validation. At our intelligence centre our research heads track a lot of information related to the market which includes the quarterly reports, the daily stock prices, and other relevant information. Our data bank server gets updated every fortnight and that is how the information which we collected using our primary and secondary information is revalidated in real time.

Step 4: QA/QC Process
After all the data collection and validation our team does a final level of quality check and quality assurance to get rid of any unwanted or undesired mistakes. This might include but not limited to getting rid of the any typos, duplication of numbers or missing of any important information. The people involved in this process include technical content writers, research heads and graphics people. Once this process is completed the title gets uploader on our platform for our clients to read it.
Step 5: Final QC/QA Process:
This is the last process and comes when the client has ordered the study. In this process a final QA/QC is done before the study is emailed to the client. Since we believe in giving our clients a good experience of our research studies, therefore, to make sure that we do not lack at our end in any way humanly possible we do a final round of quality check and then dispatch the study to the client.
Key Segments:
By Product
Humanoid
Non-Humanoid
By Application
Primary Education
Secondary Education
Higher Education
Others
By Component
Hardware
Software
Request for Segment Customization as per your Business Requirement: Segment Customization Request
Regional Coverage:
North America
US
Canada
Mexico
Europe
Eastern Europe
Poland
Romania
Hungary
Turkey
Rest of Eastern Europe
Western Europe
Germany
France
UK
Italy
Spain
Netherlands
Switzerland
Austria
Rest of Western Europe
Asia Pacific
China
India
Japan
South Korea
Vietnam
Singapore
Australia
Rest of Asia Pacific
Middle East & Africa
Middle East
UAE
Egypt
Saudi Arabia
Qatar
Rest of Middle East
Africa
Nigeria
South Africa
Rest of Africa
Latin America
Brazil
Argentina
Colombia
Rest of Latin America
Request for Country Level Research Report: Country Level Customization Request
Available Customization
With the given market data, SNS Insider offers customization as per the company’s specific needs. The following customization options are available for the report:
Detailed Volume Analysis
Criss-Cross segment analysis (e.g. Product X Application)
Competitive Product Benchmarking
Geographic Analysis
Additional countries in any of the regions
Customized Data Representation
Detailed analysis and profiling of additional market players
The Digital Assurance Market size was valued at USD 6.14 Billion in 2023 and will reach USD 19.20 Bn by 2032 and grow at a CAGR of 13.51% by 2024-2032.
IT & Telecom Cyber Security Market was valued at USD 30.87 billion in 2023 and is expected to reach USD 102.53 billion by 2032, growing at a CAGR of 14.33% from 2024-2032.
The Wireless Connectivity Market was valued at USD 91.9 billion in 2023 and is expected to reach USD 305.0 billion by 2032, growing at a CAGR of 14.28% from 2024-2032.
Online Video Platform Market was valued at USD 10.11 billion in 2023 and is expected to reach USD 49.12 billion by 2032, growing at a CAGR of 19.26% from 2024-2032.
The Cloud Encryption Market Size was valued at USD 4.0 billion in 2023 & is expected to reach USD 42.5 billion by 2032 & grow at a CAGR of 30.1% by 2024-2032.
The Multichannel Campaign Management Market size was $5.14 Billion in 2023 and will reach $23.97 Billion by 2032 and grow at a CAGR of 18.66% by 2024-2032.

Hi! Click one of our member below to chat on Phone
© 2025 All Rights Reserved by SNS Insider Pvt Ltd


