To Get More Information on Edge Computing Market - Request Sample Report
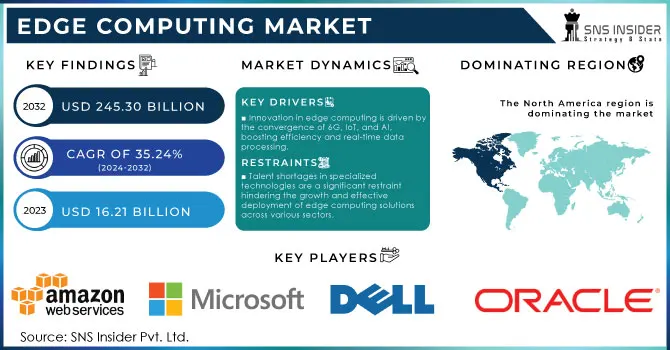
The Edge Computing Market size was valued at USD 16.21 Billion in 2023 and is expected to reach USD 245.30 Billion in 2032 and grow at a CAGR of 35.24% over the forecast period 2024-2032.
The edge computing market is experiencing remarkable growth, driven by the rapid deployment of 5G networks that enable the low-latency, high-bandwidth performance required for next-generation applications like autonomous vehicles, augmented reality (AR), virtual reality (VR), and remote healthcare. Industry data reveals that over 75% of enterprise-generated data will be processed outside traditional data centers, underscoring the growing reliance on edge solutions. Moreover, edge computing is expected to contribute to significant cost savings, with organizations predicted to reduce cloud infrastructure expenses by 30-40% by leveraging edge technologies. Global investments in smart infrastructure are set to rise by 40%, particularly in countries like China, India, and South Korea, where the adoption of edge computing in smart cities, manufacturing, and utilities is accelerating. In North America, early adoption of 5G and Internet of Things (IoT) technologies across industries like healthcare, manufacturing, and retail ensures the region’s stronghold in the market. According to the International Data Corporation (IDC), global spending on edge computing is projected to reach USD 228 billion in 2024, a 14% increase from 2023, with continued double-digit growth expected through 2032.This growth is fueled by the increasing shift of artificial intelligence (AI) from training to AI inference, where edge computing plays a crucial role in delivering faster decision-making and reducing network congestion. Research VP at IDC, edge computing enhances operational efficiencies and enables new business models previously unattainable with centralized data centers. Key industries benefiting from edge computing include manufacturing, which uses edge for real-time monitoring and predictive maintenance, and utilities, where it enables more efficient management of critical infrastructure like electricity and water. Banking is the fastest-growing sector, driven by the adoption of AI-powered fraud detection and AI-optimized operations, demonstrating the transformative potential of edge computing across diverse sectors.
Drivers
The edge computing market is significantly influenced by the convergence of several critical trends, primarily driven by the escalating demand for next-generation technologies such as 6G, IoT, and AI services. The Indian Ministry of Communications has recently urged telecom operators and startups to transition innovative technologies like edge computing from laboratories to practical applications, particularly within smart cities and Industry 4.0 frameworks. Reflecting a 14% increase from the previous year. The urgency for real-time data processing is paramount for industries aiming to fully exploit the capabilities of 5G networks and AI applications. Edge computing plays a crucial role by facilitating faster decision-making through localized data processing, which significantly mitigates latency—a vital requirement for autonomous driving, augmented and virtual reality (AR/VR), and remote healthcare services. As the edge ecosystem develops, organizations can expect savings of 30-40% on cloud infrastructure costs, marking a pivotal transition from centralized data management to decentralized solutions. Additionally, the integration of IoT-enabled devices and smart grids in sectors such as utilities and manufacturing enhances operational efficiency, enabling real-time monitoring and predictive maintenance. Notably, the banking sector emerges as the fastest-growing domain in edge computing expenditure, driven primarily by the advent of AI-driven services that bolster data processing and fraud detection capabilities. In summary, as organizations increasingly adopt edge computing, they unlock substantial opportunities for innovation and efficiency across various sectors, solidifying its vital role in shaping the future of digital infrastructure.
Restraints
The edge computing market is significantly restrained by a shortage of skilled professionals. Research indicates that nearly 90% of executives view talent shortages as the primary obstacle to adopting emerging technologies. The skills gap affects critical areas like cloud computing, with estimates suggesting up to 85 million jobs may remain unfilled globally due to this deficit. This challenge limits organizations' capacity to deploy and manage edge computing solutions, hindering innovation and operational efficiency. As the demand for advanced technologies rises, competition for skilled talent intensifies, complicating recruitment efforts. Addressing this talent gap through targeted training and education initiatives is crucial. Organizations investing in workforce development can ensure they have the necessary expertise to fully leverage edge computing, driving innovation across various sectors such as telecommunications, healthcare, and manufacturing. With a staggering 93% of UK businesses acknowledging a skills shortfall, prioritizing skill development is essential to unlock the full potential of edge computing and maintain a competitive advantage in a rapidly evolving digital landscape.
By Component
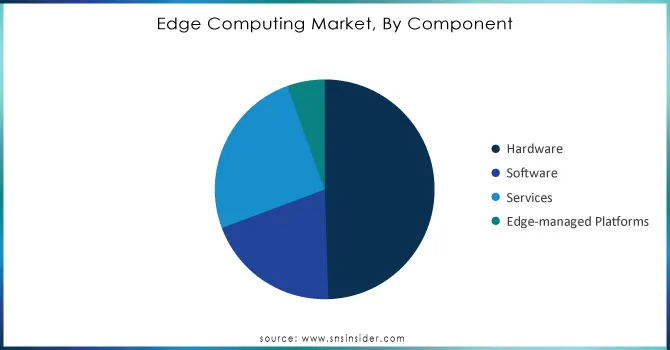
In 2023, hardware components accounted for approximately 50% of the edge computing market total revenue, driven by the increasing demand for robust infrastructures that facilitate localized data processing and real-time analytics. As organizations leverage edge computing to boost operational efficiency, essential hardware such as servers, routers, and IoT devices play a pivotal role. These components enable rapid data transfer, reduce latency, and support quick decision-making, particularly in sectors like autonomous vehicles, smart manufacturing, and healthcare. Technological advancements in hardware such as enhanced processing power and energy efficiency are also propelling investment in edge solutions. Businesses are adopting edge computing to effectively manage the extensive data generated by IoT devices, decreasing dependence on centralized cloud data centers. This shift alleviates bandwidth constraints and improves data security by keeping sensitive information closer to its source. Industries like telecommunications, retail, and healthcare further drive the demand for specialized hardware for edge applications, especially with the expansion of 5G networks, which require advanced infrastructure to support higher data rates and connectivity. As companies, embrace digital transformation, the critical role of hardware in the edge computing landscape becomes increasingly evident, highlighting its importance in fostering innovation and competitiveness in a data-centric environment.
Do You Need any Customization Research on Edge Computing Market - Inquire Now
By Application
In 2023, the Industrial Internet of Things (IIoT) represented approximately 35% of the edge computing market total revenue, underscoring its vital impact on industrial operations. By utilizing edge computing, IIoT facilitates real-time data processing from various connected devices and sensors, significantly boosting operational efficiency across sectors such as manufacturing, energy, and transportation. This integration allows for data analysis at the source, which minimizes latency and speeds up decision-making, essential for applications like predictive maintenance and automated quality control. As digital transformation accelerates, the demand for IIoT solutions is projected to rise, fueled by advancements in sensor technology and enhanced connectivity options, including 5G networks. Furthermore, IIoT enhances resource management and operational transparency, aligning with organizations' goals of reducing costs and promoting sustainability. By leveraging edge computing, businesses can effectively process large amounts of data from IoT devices, resulting in improved insights and more strategic decision-making.
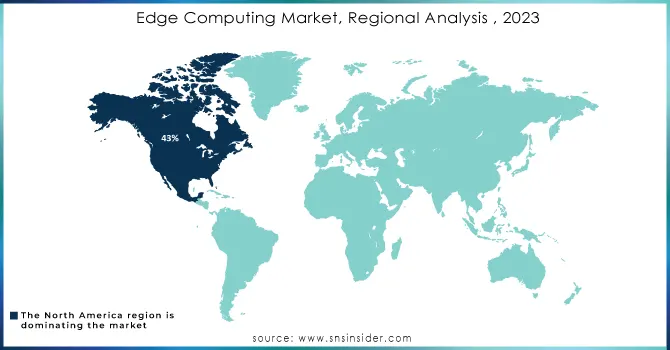
In 2023, North America represented about 43% of the edge computing market's revenue, solidifying its leadership in this fast-growing field. This dominance stems from its advanced technological infrastructure and the widespread implementation of IoT and AI solutions. The region's vibrant technology ecosystem, comprising both established companies and innovative startups, drives significant investment in edge computing. Additionally, the surging demand for low-latency applications across sectors like telecommunications, healthcare, and manufacturing propels market growth. The rollout of 5G networks further boosts connectivity, facilitating rapid data processing at the edge. Major players, including Microsoft and Amazon Web Services (AWS), have launched new edge services, while Cisco and IBM have introduced cutting-edge hardware and AI-enhanced solutions, reflecting North America's commitment to innovation in edge computing technologies.
In 2023, the Asia Pacific region emerged as the fastest-growing market for edge computing, driven by rapid industrialization, urbanization, and increasing adoption of IoT technologies. Countries like China, India, and Japan are at the forefront, with significant investments in smart city initiatives and digital transformation across sectors such as manufacturing, healthcare, and transportation. The proliferation of 5G networks enhances connectivity and enables real-time data processing, further accelerating edge computing growth. Additionally, local players and multinational corporations are innovating in edge solutions, contributing to the region's dynamic market landscape.
Some of the Major key players in Edge Computing Market with products:
Amazon Web Services (AWS) (AWS IoT Greengrass)
Microsoft (Azure IoT Edge)
Google Cloud (Anthos)
IBM (IBM Edge Application Manager)
Dell Technologies (Dell EMC Edge Gateway)
Cisco Systems (Cisco Edge Computing Solutions)
Hewlett Packard Enterprise (HPE) (HPE Edgeline)
Oracle (Oracle Edge Services)
NVIDIA (NVIDIA Jetson)
Intel (Intel IoT Platform)
Qualcomm (Qualcomm IoT Services)
EdgeConneX (EdgeConneX Edge Data Centers)
FogHorn Systems (FogHorn Edge AI)
Schneider Electric (EcoStruxure)
Siemens (MindSphere)
Veea (Veea Edge Platform)
Lumen Technologies (Lumen Edge Services)
Alibaba Cloud (Alibaba Cloud Edge Computing)
Zebra Technologies (Zebra SmartLens)
Aviatrix (Aviatrix Multi-Cloud Networking)
List of major suppliers, which provide cloud platform in the edge computing
Amazon Web Services (AWS)
Microsoft Azure
Google Cloud
IBM Cloud
Dell Technologies
Hewlett Packard Enterprise (HPE)
Cisco Systems
NVIDIA
Qualcomm
Intel
On October 23, 2024, ZEDEDA and OnLogic announced a strategic partnership to launch OnLogic Powered by ZEDEDA, integrating rugged industrial-grade hardware with cloud-native edge orchestration software. This collaboration aims to simplify and secure the deployment and management of edge computing workloads for enterprises, accelerating time to value.
On October 24, 2024, Australian micro data center provider Zella DC launched the Zella Outback, a cutting-edge outdoor micro data center designed specifically for edge computing in extreme conditions. This innovative solution emphasizes reliability and performance, drawing inspiration from the rugged landscapes of Western Australia.
On October 23, 2024, Microchip Technology announced the launch of its PIC64HX microprocessor family, expanding its 64-bit portfolio to meet the growing demand for reliable embedded solutions in edge computing. Designed specifically for mission-critical applications across sectors such as aerospace, defense, and industrial, the PIC64HX addresses the unique requirements of intelligent edge designs.
On October 19, 2024, researchers highlighted the potential of organic electrochemical transistors (OECTs) as stretchable transistors for wearable devices, enabling in-sensor edge computing. Made from carbon-based materials, these neuromorphic transistors enhance electronic signal processing in skin-mounted devices like smartwatches and health monitors.
On October 16, 2024, experts emphasized that the rise of autonomous systems is pushing CIOs to integrate AI at the network edge into their 2025 strategies. A Gartner report indicates that 75% of CIOs are increasing their AI budgets this year, as edge computing becomes crucial for enabling real-time data processing and reducing cloud costs.
On October 22, 2024, Qualcomm emphasized its leadership in on-device generative AI, highlighting its role in mainstreaming spatial computing for hyper-personalization. The company's vision includes transforming app-centric experiences into innovative solutions, heavily relying on wearable technology such as smart glasses.
Report Attributes | Details |
---|---|
Market Size in 2023 | USD 16.21 Billion |
Market Size by 2032 | USD 245.30 Billion |
CAGR | CAGR of 35.24% From 2024 to 2032 |
Base Year | 2023 |
Forecast Period | 2024-2032 |
Historical Data | 2020-2022 |
Report Scope & Coverage | Market Size, Segments Analysis, Competitive Landscape, Regional Analysis, DROC & SWOT Analysis, Forecast Outlook |
Key Segments | • By Component (Hardware, Software, Services, Edge-managed Platforms) • by Application (IIoT, Remote Monitoring, Content Delivery, Video Analytics, AR/VR, Others), • By Industry Vertical (Industrial, Energy & Utilities, Healthcare, Agriculture, Transportation & Logistics, Retail, Datacenters, Wearables, Smart Cities, Smart Homes, Smart Buildings) |
Regional Analysis/Coverage | North America (US, Canada, Mexico), Europe (Eastern Europe [Poland, Romania, Hungary, Turkey, Rest of Eastern Europe] Western Europe] Germany, France, UK, Italy, Spain, Netherlands, Switzerland, Austria, Rest of Western Europe]), Asia-Pacific (China, India, Japan, South Korea, Vietnam, Singapore, Australia, Rest of Asia-Pacific), Middle East & Africa (Middle East [UAE, Egypt, Saudi Arabia, Qatar, Rest of Middle East], Africa [Nigeria, South Africa, Rest of Africa], Latin America (Brazil, Argentina, Colombia, Rest of Latin America) |
Company Profiles | Amazon Web Services (AWS), Microsoft, Google Cloud, IBM, Dell Technologies, Cisco Systems, Hewlett Packard Enterprise (HPE), Oracle, NVIDIA, Intel, Qualcomm, EdgeConneX, FogHorn Systems, Schneider Electric, Siemens, Veea, Lumen Technologies, Alibaba Cloud, Zebra Technologies, and Aviatrix. |
Key Drivers | • Innovation in edge computing is driven by the convergence of 6G, IoT, and AI, boosting efficiency and real-time data processing. |
RESTRAINTS | • Talent shortages in specialized technologies are a significant restraint hindering the growth and effective deployment of edge computing solutions across various sectors. |
Ans. The primary growth tactics of market participants include merger and acquisition, business expansion, and product launch.
Ans: The high impact of the IoT in recent days.
Ans: The Edge Computing Market size was valued at USD 16.21 Billion in 2023 and is expected to reach USD 245.30 Billion in 2032 and grow at a CAGR of 35.24% over the forecast period 2024-2032.
Ans: Hardware is the dominating segment in Edge Computing Market in 2023.
Ans: North America is dominating in Edge Computing market in 2023
Table of Contents
1. Introduction
1.1 Market Definition
1.2 Scope (Inclusion and Exclusions)
1.3 Research Assumptions
2. Executive Summary
2.1 Market Overview
2.2 Regional Synopsis
2.3 Competitive Summary
3. Research Methodology
3.1 Top-Down Approach
3.2 Bottom-up Approach
3.3. Data Validation
3.4 Primary Interviews
4. Market Dynamics Impact Analysis
4.1 Market Driving Factors Analysis
4.1.1 Drivers
4.1.2 Restraints
4.1.3 Opportunities
4.1.4 Challenges
4.2 PESTLE Analysis
4.3 Porter’s Five Forces Model
5. Statistical Insights and Trends Reporting
5.1 Adoption Rates of Emerging Technologies
5.2 Network Infrastructure Expansion, by Region
5.3 Cybersecurity Incidents, by Region (2020-2023)
5.4 Cloud Services Usage, by Region
6. Competitive Landscape
6.1 List of Major Companies, By Region
6.2 Market Share Analysis, By Region
6.3 Product Benchmarking
6.3.1 Product specifications and features
6.3.2 Pricing
6.4 Strategic Initiatives
6.4.1 Marketing and promotional activities
6.4.2 Distribution and Supply Chain Strategies
6.4.3 Expansion plans and new product launches
6.4.4 Strategic partnerships and collaborations
6.5 Technological Advancements
6.6 Market Positioning and Branding
7. Edge Computing Market Segmentation, by Component
7.1 Chapter Overview
7.2 Hardware
7.2.1 Hardware Market Trends Analysis (2020-2032)
7.2.2 Hardware Market Size Estimates and Forecasts to 2032 (USD Billion)
7.3 Software
7.3.1 Software Market Trends Analysis (2020-2032)
7.3.2 Software Market Size Estimates and Forecasts to 2032 (USD Billion)
7.4 Services
7.4.1 Services Market Trends Analysis (2020-2032)
7.4.2 Services Market Size Estimates and Forecasts to 2032 (USD Billion)
7.5 Edge-managed Platforms
7.5.1 Edge-managed Platforms Market Trends Analysis (2020-2032)
7.5.2 Edge-managed Platforms Market Size Estimates and Forecasts to 2032 (USD Billion)
8. Edge Computing Market Segmentation, by Application
8.1 Chapter Overview
8.2 IIoT
8.2.1 IIoT Market Trends Analysis (2020-2032)
8.2.2 IIoT Market Size Estimates and Forecasts to 2032 (USD Billion)
8.3 Remote Monitoring
8.3.1 Remote Monitoring Market Trends Analysis (2020-2032)
8.3.2 Remote Monitoring Market Size Estimates and Forecasts to 2032 (USD Billion)
8.4 Content Delivery
8.4.1 Content Delivery Market Trends Analysis (2020-2032)
8.4.2 Content Delivery Market Size Estimates and Forecasts to 2032 (USD Billion)
8.5 Video Analytics
8.5.1 Video Analytics Market Trends Analysis (2020-2032)
8.5.2 Video Analytics Market Size Estimates and Forecasts to 2032 (USD Billion)
8.6 AR/VR
8.6.1 AR/VR Market Trends Analysis (2020-2032)
8.6.2 AR/VR Market Size Estimates and Forecasts to 2032 (USD Billion)
8.7 Others
8.7.1 Others Market Trends Analysis (2020-2032)
8.7.2 Others Market Size Estimates and Forecasts to 2032 (USD Billion)
9. Edge Computing Market Segmentation, by Industry Vertical
9.1 Chapter Overview
9.2 Industrial
9.2.1 Industrial Market Trends Analysis (2020-2032)
9.2.2 Industrial Market Size Estimates and Forecasts to 2032 (USD Billion)
9.3 Energy & Utilities
9.3.1 Energy & Utilities Market Trends Analysis (2020-2032)
9.3.2 Energy & Utilities Market Size Estimates and Forecasts to 2032 (USD Billion)
9.4 Healthcare
9.4.1 Healthcare Market Trends Analysis (2020-2032)
9.4.2 Healthcare Market Size Estimates and Forecasts to 2032 (USD Billion)
9.5 Agriculture
9.5.1 Agriculture Market Trends Analysis (2020-2032)
9.5.2 Agriculture Market Size Estimates and Forecasts to 2032 (USD Billion)
9.6 Transportation & Logistics
9.6.1 Transportation & Logistics Market Trends Analysis (2020-2032)
9.6.2 Transportation & Logistics Market Size Estimates and Forecasts to 2032 (USD Billion)
9.7 Retail
9.7.1 Retail Market Trends Analysis (2020-2032)
9.7.2 Retail Market Size Estimates and Forecasts to 2032 (USD Billion)
9.8 Datacenters
9.8.1 Datacenters Market Trends Analysis (2020-2032)
9.8.2 Datacenters Market Size Estimates and Forecasts to 2032 (USD Billion)
9.9 Wearables
9.9.1 Wearables Market Trends Analysis (2020-2032)
9.9.2 Wearables Market Size Estimates and Forecasts to 2032 (USD Billion)
9.10 Smart Cities, Smart Homes, Smart Buildings
9.10.1 Smart Cities, Smart Homes, Smart Buildings Market Trends Analysis (2020-2032)
9.10.2 Smart Cities, Smart Homes, Smart Buildings Market Size Estimates and Forecasts to 2032 (USD Billion)
10. Regional Analysis
10.1 Chapter Overview
10.2 North America
10.2.1 Trends Analysis
10.2.2 North America Edge Computing Market Estimates and Forecasts, by Country (2020-2032) (USD Billion)
10.2.3 North America Edge Computing Market Estimates and Forecasts, by Component (2020-2032) (USD Billion)
10.2.4 North America Edge Computing Market Estimates and Forecasts, by Application (2020-2032) (USD Billion)
10.2.5 North America Edge Computing Market Estimates and Forecasts, by Industry Vertical (2020-2032) (USD Billion)
10.2.6 USA
10.2.6.1 USA Edge Computing Market Estimates and Forecasts, by Component (2020-2032) (USD Billion)
10.2.6.2 USA Edge Computing Market Estimates and Forecasts, by Application (2020-2032) (USD Billion)
10.2.6.3 USA Edge Computing Market Estimates and Forecasts, by Industry Vertical (2020-2032) (USD Billion)
10.2.7 Canada
10.2.7.1 Canada Edge Computing Market Estimates and Forecasts, by Component (2020-2032) (USD Billion)
10.2.7.2 Canada Edge Computing Market Estimates and Forecasts, by Application (2020-2032) (USD Billion)
10.2.7.3 Canada Edge Computing Market Estimates and Forecasts, by Industry Vertical (2020-2032) (USD Billion)
10.2.8 Mexico
10.2.8.1 Mexico Edge Computing Market Estimates and Forecasts, by Component (2020-2032) (USD Billion)
10.2.8.2 Mexico Edge Computing Market Estimates and Forecasts, by Application (2020-2032) (USD Billion)
10.2.8.3 Mexico Edge Computing Market Estimates and Forecasts, by Industry Vertical (2020-2032) (USD Billion)
10.3 Europe
10.3.1 Eastern Europe
10.3.1.1 Trends Analysis
10.3.1.2 Eastern Europe Edge Computing Market Estimates and Forecasts, by Country (2020-2032) (USD Billion)
10.3.1.3 Eastern Europe Edge Computing Market Estimates and Forecasts, by Component (2020-2032) (USD Billion)
10.3.1.4 Eastern Europe Edge Computing Market Estimates and Forecasts, by Application (2020-2032) (USD Billion)
10.3.1.5 Eastern Europe Edge Computing Market Estimates and Forecasts, by Industry Vertical (2020-2032) (USD Billion)
10.3.1.6 Poland
10.3.1.6.1 Poland Edge Computing Market Estimates and Forecasts, by Component (2020-2032) (USD Billion)
10.3.1.6.2 Poland Edge Computing Market Estimates and Forecasts, by Application (2020-2032) (USD Billion)
10.3.1.6.3 Poland Edge Computing Market Estimates and Forecasts, by Industry Vertical (2020-2032) (USD Billion)
10.3.1.7 Romania
10.3.1.7.1 Romania Edge Computing Market Estimates and Forecasts, by Component (2020-2032) (USD Billion)
10.3.1.7.2 Romania Edge Computing Market Estimates and Forecasts, by Application (2020-2032) (USD Billion)
10.3.1.7.3 Romania Edge Computing Market Estimates and Forecasts, by Industry Vertical (2020-2032) (USD Billion)
10.3.1.8 Hungary
10.3.1.8.1 Hungary Edge Computing Market Estimates and Forecasts, by Component (2020-2032) (USD Billion)
10.3.1.8.2 Hungary Edge Computing Market Estimates and Forecasts, by Application (2020-2032) (USD Billion)
10.3.1.8.3 Hungary Edge Computing Market Estimates and Forecasts, by Industry Vertical (2020-2032) (USD Billion)
10.3.1.9 Turkey
10.3.1.9.1 Turkey Edge Computing Market Estimates and Forecasts, by Component (2020-2032) (USD Billion)
10.3.1.9.2 Turkey Edge Computing Market Estimates and Forecasts, by Application (2020-2032) (USD Billion)
10.3.1.9.3 Turkey Edge Computing Market Estimates and Forecasts, by Industry Vertical (2020-2032) (USD Billion)
10.3.1.10 Rest of Eastern Europe
10.3.1.10.1 Rest of Eastern Europe Edge Computing Market Estimates and Forecasts, by Component (2020-2032) (USD Billion)
10.3.1.10.2 Rest of Eastern Europe Edge Computing Market Estimates and Forecasts, by Application (2020-2032) (USD Billion)
10.3.1.10.3 Rest of Eastern Europe Edge Computing Market Estimates and Forecasts, by Industry Vertical (2020-2032) (USD Billion)
10.3.2 Western Europe
10.3.2.1 Trends Analysis
10.3.2.2 Western Europe Edge Computing Market Estimates and Forecasts, by Country (2020-2032) (USD Billion)
10.3.2.3 Western Europe Edge Computing Market Estimates and Forecasts, by Component (2020-2032) (USD Billion)
10.3.2.4 Western Europe Edge Computing Market Estimates and Forecasts, by Application (2020-2032) (USD Billion)
10.3.2.5 Western Europe Edge Computing Market Estimates and Forecasts, by Industry Vertical (2020-2032) (USD Billion)
10.3.2.6 Germany
10.3.2.6.1 Germany Edge Computing Market Estimates and Forecasts, by Component (2020-2032) (USD Billion)
10.3.2.6.2 Germany Edge Computing Market Estimates and Forecasts, by Application (2020-2032) (USD Billion)
10.3.2.6.3 Germany Edge Computing Market Estimates and Forecasts, by Industry Vertical (2020-2032) (USD Billion)
10.3.2.7 France
10.3.2.7.1 France Edge Computing Market Estimates and Forecasts, by Component (2020-2032) (USD Billion)
10.3.2.7.2 France Edge Computing Market Estimates and Forecasts, by Application (2020-2032) (USD Billion)
10.3.2.7.3 France Edge Computing Market Estimates and Forecasts, by Industry Vertical (2020-2032) (USD Billion)
10.3.2.8 UK
10.3.2.8.1 UK Edge Computing Market Estimates and Forecasts, by Component (2020-2032) (USD Billion)
10.3.2.8.2 UK Edge Computing Market Estimates and Forecasts, by Application (2020-2032) (USD Billion)
10.3.2.8.3 UK Edge Computing Market Estimates and Forecasts, by Industry Vertical (2020-2032) (USD Billion)
10.3.2.9 Italy
10.3.2.9.1 Italy Edge Computing Market Estimates and Forecasts, by Component (2020-2032) (USD Billion)
10.3.2.9.2 Italy Edge Computing Market Estimates and Forecasts, by Application (2020-2032) (USD Billion)
10.3.2.9.3 Italy Edge Computing Market Estimates and Forecasts, by Industry Vertical (2020-2032) (USD Billion)
10.3.2.10 Spain
10.3.2.10.1 Spain Edge Computing Market Estimates and Forecasts, by Component (2020-2032) (USD Billion)
10.3.2.10.2 Spain Edge Computing Market Estimates and Forecasts, by Application (2020-2032) (USD Billion)
10.3.2.10.3 Spain Edge Computing Market Estimates and Forecasts, by Industry Vertical (2020-2032) (USD Billion)
10.3.2.11 Netherlands
10.3.2.11.1 Netherlands Edge Computing Market Estimates and Forecasts, by Component (2020-2032) (USD Billion)
10.3.2.11.2 Netherlands Edge Computing Market Estimates and Forecasts, by Application (2020-2032) (USD Billion)
10.3.2.11.3 Netherlands Edge Computing Market Estimates and Forecasts, by Industry Vertical (2020-2032) (USD Billion)
10.3.2.12 Switzerland
10.3.2.12.1 Switzerland Edge Computing Market Estimates and Forecasts, by Component (2020-2032) (USD Billion)
10.3.2.12.2 Switzerland Edge Computing Market Estimates and Forecasts, by Application (2020-2032) (USD Billion)
10.3.2.12.3 Switzerland Edge Computing Market Estimates and Forecasts, by Industry Vertical (2020-2032) (USD Billion)
10.3.2.13 Austria
10.3.2.13.1 Austria Edge Computing Market Estimates and Forecasts, by Component (2020-2032) (USD Billion)
10.3.2.13.2 Austria Edge Computing Market Estimates and Forecasts, by Application (2020-2032) (USD Billion)
10.3.2.13.3 Austria Edge Computing Market Estimates and Forecasts, by Industry Vertical (2020-2032) (USD Billion)
10.3.2.14 Rest of Western Europe
10.3.2.14.1 Rest of Western Europe Edge Computing Market Estimates and Forecasts, by Component (2020-2032) (USD Billion)
10.3.2.14.2 Rest of Western Europe Edge Computing Market Estimates and Forecasts, by Application (2020-2032) (USD Billion)
10.3.2.14.3 Rest of Western Europe Edge Computing Market Estimates and Forecasts, by Industry Vertical (2020-2032) (USD Billion)
10.4 Asia Pacific
10.4.1 Trends Analysis
10.4.2 Asia Pacific Edge Computing Market Estimates and Forecasts, by Country (2020-2032) (USD Billion)
10.4.3 Asia Pacific Edge Computing Market Estimates and Forecasts, by Component (2020-2032) (USD Billion)
10.4.4 Asia Pacific Edge Computing Market Estimates and Forecasts, by Application (2020-2032) (USD Billion)
10.4.5 Asia Pacific Edge Computing Market Estimates and Forecasts, by Industry Vertical (2020-2032) (USD Billion)
10.4.6 China
10.4.6.1 China Edge Computing Market Estimates and Forecasts, by Component (2020-2032) (USD Billion)
10.4.6.2 China Edge Computing Market Estimates and Forecasts, by Application (2020-2032) (USD Billion)
10.4.6.3 China Edge Computing Market Estimates and Forecasts, by Industry Vertical (2020-2032) (USD Billion)
10.4.7 India
10.4.7.1 India Edge Computing Market Estimates and Forecasts, by Component (2020-2032) (USD Billion)
10.4.7.2 India Edge Computing Market Estimates and Forecasts, by Application (2020-2032) (USD Billion)
10.4.7.3 India Edge Computing Market Estimates and Forecasts, by Industry Vertical (2020-2032) (USD Billion)
10.4.8 Japan
10.4.8.1 Japan Edge Computing Market Estimates and Forecasts, by Component (2020-2032) (USD Billion)
10.4.8.2 Japan Edge Computing Market Estimates and Forecasts, by Application (2020-2032) (USD Billion)
10.4.8.3 Japan Edge Computing Market Estimates and Forecasts, by Industry Vertical (2020-2032) (USD Billion)
10.4.9 South Korea
10.4.9.1 South Korea Edge Computing Market Estimates and Forecasts, by Component (2020-2032) (USD Billion)
10.4.9.2 South Korea Edge Computing Market Estimates and Forecasts, by Application (2020-2032) (USD Billion)
10.4.9.3 South Korea Edge Computing Market Estimates and Forecasts, by Industry Vertical (2020-2032) (USD Billion)
10.4.10 Vietnam
10.4.10.1 Vietnam Edge Computing Market Estimates and Forecasts, by Component (2020-2032) (USD Billion)
10.4.10.2 Vietnam Edge Computing Market Estimates and Forecasts, by Application (2020-2032) (USD Billion)
10.4.10.3 Vietnam Edge Computing Market Estimates and Forecasts, by Industry Vertical (2020-2032) (USD Billion)
10.4.11 Singapore
10.4.11.1 Singapore Edge Computing Market Estimates and Forecasts, by Component (2020-2032) (USD Billion)
10.4.11.2 Singapore Edge Computing Market Estimates and Forecasts, by Application (2020-2032) (USD Billion)
10.4.11.3 Singapore Edge Computing Market Estimates and Forecasts, by Industry Vertical (2020-2032) (USD Billion)
10.4.12 Australia
10.4.12.1 Australia Edge Computing Market Estimates and Forecasts, by Component (2020-2032) (USD Billion)
10.4.12.2 Australia Edge Computing Market Estimates and Forecasts, by Application (2020-2032) (USD Billion)
10.4.12.3 Australia Edge Computing Market Estimates and Forecasts, by Industry Vertical (2020-2032) (USD Billion)
10.4.13 Rest of Asia Pacific
10.4.13.1 Rest of Asia Pacific Edge Computing Market Estimates and Forecasts, by Component (2020-2032) (USD Billion)
10.4.13.2 Rest of Asia Pacific Edge Computing Market Estimates and Forecasts, by Application (2020-2032) (USD Billion)
10.4.13.3 Rest of Asia Pacific Edge Computing Market Estimates and Forecasts, by Industry Vertical (2020-2032) (USD Billion)
10.5 Middle East and Africa
10.5.1 Middle East
10.5.1.1 Trends Analysis
10.5.1.2 Middle East Edge Computing Market Estimates and Forecasts, by Country (2020-2032) (USD Billion)
10.5.1.3 Middle East Edge Computing Market Estimates and Forecasts, by Component (2020-2032) (USD Billion)
10.5.1.4 Middle East Edge Computing Market Estimates and Forecasts, by Application (2020-2032) (USD Billion)
10.5.1.5 Middle East Edge Computing Market Estimates and Forecasts, by Industry Vertical (2020-2032) (USD Billion)
10.5.1.6 UAE
10.5.1.6.1 UAE Edge Computing Market Estimates and Forecasts, by Component (2020-2032) (USD Billion)
10.5.1.6.2 UAE Edge Computing Market Estimates and Forecasts, by Application (2020-2032) (USD Billion)
10.5.1.6.3 UAE Edge Computing Market Estimates and Forecasts, by Industry Vertical (2020-2032) (USD Billion)
10.5.1.7 Egypt
10.5.1.7.1 Egypt Edge Computing Market Estimates and Forecasts, by Component (2020-2032) (USD Billion)
10.5.1.7.2 Egypt Edge Computing Market Estimates and Forecasts, by Application (2020-2032) (USD Billion)
10.5.1.7.3 Egypt Edge Computing Market Estimates and Forecasts, by Industry Vertical (2020-2032) (USD Billion)
10.5.1.8 Saudi Arabia
10.5.1.8.1 Saudi Arabia Edge Computing Market Estimates and Forecasts, by Component (2020-2032) (USD Billion)
10.5.1.8.2 Saudi Arabia Edge Computing Market Estimates and Forecasts, by Application (2020-2032) (USD Billion)
10.5.1.8.3 Saudi Arabia Edge Computing Market Estimates and Forecasts, by Industry Vertical (2020-2032) (USD Billion)
10.5.1.9 Qatar
10.5.1.9.1 Qatar Edge Computing Market Estimates and Forecasts, by Component (2020-2032) (USD Billion)
10.5.1.9.2 Qatar Edge Computing Market Estimates and Forecasts, by Application (2020-2032) (USD Billion)
10.5.1.9.3 Qatar Edge Computing Market Estimates and Forecasts, by Industry Vertical (2020-2032) (USD Billion)
10.5.1.10 Rest of Middle East
10.5.1.10.1 Rest of Middle East Edge Computing Market Estimates and Forecasts, by Component (2020-2032) (USD Billion)
10.5.1.10.2 Rest of Middle East Edge Computing Market Estimates and Forecasts, by Application (2020-2032) (USD Billion)
10.5.1.10.3 Rest of Middle East Edge Computing Market Estimates and Forecasts, by Industry Vertical (2020-2032) (USD Billion)
10.5.2 Africa
10.5.2.1 Trends Analysis
10.5.2.2 Africa Edge Computing Market Estimates and Forecasts, by Country (2020-2032) (USD Billion)
10.5.2.3 Africa Edge Computing Market Estimates and Forecasts, by Component (2020-2032) (USD Billion)
10.5.2.4 Africa Edge Computing Market Estimates and Forecasts, by Application (2020-2032) (USD Billion)
10.5.2.5 Africa Edge Computing Market Estimates and Forecasts, by Industry Vertical (2020-2032) (USD Billion)
10.5.2.6 South Africa
10.5.2.6.1 South Africa Edge Computing Market Estimates and Forecasts, by Component (2020-2032) (USD Billion)
10.5.2.6.2 South Africa Edge Computing Market Estimates and Forecasts, by Application (2020-2032) (USD Billion)
10.5.2.6.3 South Africa Edge Computing Market Estimates and Forecasts, by Industry Vertical (2020-2032) (USD Billion)
10.5.2.7 Nigeria
10.5.2.7.1 Nigeria Edge Computing Market Estimates and Forecasts, by Component (2020-2032) (USD Billion)
10.5.2.7.2 Nigeria Edge Computing Market Estimates and Forecasts, by Application (2020-2032) (USD Billion)
10.5.2.7.3 Nigeria Edge Computing Market Estimates and Forecasts, by Industry Vertical (2020-2032) (USD Billion)
10.5.2.8 Rest of Africa
10.5.2.8.1 Rest of Africa Edge Computing Market Estimates and Forecasts, by Component (2020-2032) (USD Billion)
10.5.2.8.2 Rest of Africa Edge Computing Market Estimates and Forecasts, by Application (2020-2032) (USD Billion)
10.5.2.8.3 Rest of Africa Edge Computing Market Estimates and Forecasts, by Industry Vertical (2020-2032) (USD Billion)
10.6 Latin America
10.6.1 Trends Analysis
10.6.2 Latin America Edge Computing Market Estimates and Forecasts, by Country (2020-2032) (USD Billion)
10.6.3 Latin America Edge Computing Market Estimates and Forecasts, by Component (2020-2032) (USD Billion)
10.6.4 Latin America Edge Computing Market Estimates and Forecasts, by Application (2020-2032) (USD Billion)
10.6.5 Latin America Edge Computing Market Estimates and Forecasts, by Industry Vertical (2020-2032) (USD Billion)
10.6.6 Brazil
10.6.6.1 Brazil Edge Computing Market Estimates and Forecasts, by Component (2020-2032) (USD Billion)
10.6.6.2 Brazil Edge Computing Market Estimates and Forecasts, by Application (2020-2032) (USD Billion)
10.6.6.3 Brazil Edge Computing Market Estimates and Forecasts, by Industry Vertical (2020-2032) (USD Billion)
10.6.7 Argentina
10.6.7.1 Argentina Edge Computing Market Estimates and Forecasts, by Component (2020-2032) (USD Billion)
10.6.7.2 Argentina Edge Computing Market Estimates and Forecasts, by Application (2020-2032) (USD Billion)
10.6.7.3 Argentina Edge Computing Market Estimates and Forecasts, by Industry Vertical (2020-2032) (USD Billion)
10.6.8 Colombia
10.6.8.1 Colombia Edge Computing Market Estimates and Forecasts, by Component (2020-2032) (USD Billion)
10.6.8.2 Colombia Edge Computing Market Estimates and Forecasts, by Application (2020-2032) (USD Billion)
10.6.8.3 Colombia Edge Computing Market Estimates and Forecasts, by Industry Vertical (2020-2032) (USD Billion)
10.6.9 Rest of Latin America
10.6.9.1 Rest of Latin America Edge Computing Market Estimates and Forecasts, by Component (2020-2032) (USD Billion)
10.6.9.2 Rest of Latin America Edge Computing Market Estimates and Forecasts, by Application (2020-2032) (USD Billion)
10.6.9.3 Rest of Latin America Edge Computing Market Estimates and Forecasts, by Industry Vertical (2020-2032) (USD Billion)
11. Company Profiles
11.1 Amazon Web Services (AWS)
11.1.1 Company Overview
11.1.2 Financial
11.1.3 Products/ Services Offered
11.1.4 SWOT Analysis
11.2 Microsoft
11.2.1 Company Overview
11.2.2 Financial
11.2.3 Products/ Services Offered
11.2.4 SWOT Analysis
11.3 Google Cloud
11.3.1 Company Overview
11.3.2 Financial
11.3.3 Products/ Services Offered
11.3.4 SWOT Analysis
11.4 IBM
11.4.1 Company Overview
11.4.2 Financial
11.4.3 Products/ Services Offered
11.4.4 SWOT Analysis
11.5 Dell Technologies
11.5.1 Company Overview
11.5.2 Financial
11.5.3 Products/ Services Offered
11.5.4 SWOT Analysis
11.6 Dell Technologies
11.6.1 Company Overview
11.6.2 Financial
11.6.3 Products/ Services Offered
11.6.4 SWOT Analysis
11.7 Hewlett Packard Enterprise (HPE)
11.7.1 Company Overview
11.7.2 Financial
11.7.3 Products/ Services Offered
11.7.4 SWOT Analysis
11.8 Oracle
11.8.1 Company Overview
11.8.2 Financial
11.8.3 Products/ Services Offered
11.8.4 SWOT Analysis
11.9 NVIDIA
11.9.1 Company Overview
11.9.2 Financial
11.9.3 Products/ Services Offered
11.9.4 SWOT Analysis
11.10 Intel
11.10.1 Company Overview
11.10.2 Financial
11.10.3 Products/ Services Offered
11.10.4 SWOT Analysis
12. Use Cases and Best Practices
13. Conclusion
An accurate research report requires proper strategizing as well as implementation. There are multiple factors involved in the completion of good and accurate research report and selecting the best methodology to compete the research is the toughest part. Since the research reports we provide play a crucial role in any company’s decision-making process, therefore we at SNS Insider always believe that we should choose the best method which gives us results closer to reality. This allows us to reach at a stage wherein we can provide our clients best and accurate investment to output ratio.
Each report that we prepare takes a timeframe of 350-400 business hours for production. Starting from the selection of titles through a couple of in-depth brain storming session to the final QC process before uploading our titles on our website we dedicate around 350 working hours. The titles are selected based on their current market cap and the foreseen CAGR and growth.
The 5 steps process:
Step 1: Secondary Research:
Secondary Research or Desk Research is as the name suggests is a research process wherein, we collect data through the readily available information. In this process we use various paid and unpaid databases which our team has access to and gather data through the same. This includes examining of listed companies’ annual reports, Journals, SEC filling etc. Apart from this our team has access to various associations across the globe across different industries. Lastly, we have exchange relationships with various university as well as individual libraries.
Step 2: Primary Research
When we talk about primary research, it is a type of study in which the researchers collect relevant data samples directly, rather than relying on previously collected data. This type of research is focused on gaining content specific facts that can be sued to solve specific problems. Since the collected data is fresh and first hand therefore it makes the study more accurate and genuine.
We at SNS Insider have divided Primary Research into 2 parts.
Part 1 wherein we interview the KOLs of major players as well as the upcoming ones across various geographic regions. This allows us to have their view over the market scenario and acts as an important tool to come closer to the accurate market numbers. As many as 45 paid and unpaid primary interviews are taken from both the demand and supply side of the industry to make sure we land at an accurate judgement and analysis of the market.
This step involves the triangulation of data wherein our team analyses the interview transcripts, online survey responses and observation of on filed participants. The below mentioned chart should give a better understanding of the part 1 of the primary interview.
Part 2: In this part of primary research the data collected via secondary research and the part 1 of the primary research is validated with the interviews from individual consultants and subject matter experts.
Consultants are those set of people who have at least 12 years of experience and expertise within the industry whereas Subject Matter Experts are those with at least 15 years of experience behind their back within the same space. The data with the help of two main processes i.e., FGDs (Focused Group Discussions) and IDs (Individual Discussions). This gives us a 3rd party nonbiased primary view of the market scenario making it a more dependable one while collation of the data pointers.
Step 3: Data Bank Validation
Once all the information is collected via primary and secondary sources, we run that information for data validation. At our intelligence centre our research heads track a lot of information related to the market which includes the quarterly reports, the daily stock prices, and other relevant information. Our data bank server gets updated every fortnight and that is how the information which we collected using our primary and secondary information is revalidated in real time.
Step 4: QA/QC Process
After all the data collection and validation our team does a final level of quality check and quality assurance to get rid of any unwanted or undesired mistakes. This might include but not limited to getting rid of the any typos, duplication of numbers or missing of any important information. The people involved in this process include technical content writers, research heads and graphics people. Once this process is completed the title gets uploader on our platform for our clients to read it.
Step 5: Final QC/QA Process:
This is the last process and comes when the client has ordered the study. In this process a final QA/QC is done before the study is emailed to the client. Since we believe in giving our clients a good experience of our research studies, therefore, to make sure that we do not lack at our end in any way humanly possible we do a final round of quality check and then dispatch the study to the client.
Key Segments:
By Component
Hardware
Software
Services
Edge-managed Platforms
By Application
IIoT
Remote Monitoring
Content Delivery
Video Analytics
AR/VR
Others
By Industry Vertical
Industrial
Energy & Utilities
Healthcare
Agriculture
Transportation & Logistics
Retail
Datacenters
Wearables
Smart Cities, Smart Homes, Smart Buildings
Request for Segment Customization as per your Business Requirement: Segment Customization Request
REGIONAL COVERAGE:
North America
US
Canada
Mexico
Europe
Eastern Europe
Poland
Romania
Hungary
Turkey
Rest of Eastern Europe
Western Europe
Germany
France
UK
Italy
Spain
Netherlands
Switzerland
Austria
Rest of Western Europe
Asia-Pacific
China
India
Japan
South Korea
Vietnam
Singapore
Australia
Rest of Asia Pacific
Middle East & Africa
Middle East
UAE
Egypt
Saudi Arabia
Qatar
Rest of the Middle East
Africa
Nigeria
South Africa
Rest of Africa
Latin America
Brazil
Argentina
Colombia
Rest of Latin America
Request for Country Level Research Report: Country Level Customization Request
Available Customization
With the given market data, SNS Insider offers customization as per the company’s specific needs. The following customization options are available for the report:
Product Analysis
Criss-Cross segment analysis (e.g. Product X Application)
Product Matrix which gives a detailed comparison of the product portfolio of each company
Geographic Analysis
Additional countries in any of the regions
Company Information
Detailed analysis and profiling of additional market players (Up to five)
The Time and Attendance Software Market size was valued at USD 3.03 billion in 2023 and is expected to grow to USD 8.60 billion by 2032 and grow at a CAGR of 12.3% over the forecast period of 2024-2032.
The Shipping Software Market was valued at USD 13.01 billion in 2023 and will reach USD 28.07 Billion by 2032, growing at a CAGR of 8.94% by 2032.
Finance and Accounting Business Process Outsourcing Market size was valued at USD 60.93 Billion in 2023. It is expected to Reach USD 134.65 Billion by 2032 and grow at a CAGR of 9.22% over the forecast period of 2024-2032.
The Contactless Payment Market Size was valued at USD 20.21 Billion in 2023 and will reach USD 440 Billion by 2032 and grow at a CAGR of 41.31% by 2024-2032.
The Artificial Intelligence Market size was valued at USD 285.7 billion in 2023 and is expected to reach USD 3324.4 billion by 2032 and grow at a CAGR of 30.94% over the forecast period of 2024-2032.
The Conversational Systems Market size was USD 13.32 billion in 2023 and is expected to reach USD 150.30 billion by 2032 and grow at a CAGR of 30.9% over the forecast period of 2024-2032.
Hi! Click one of our member below to chat on Phone