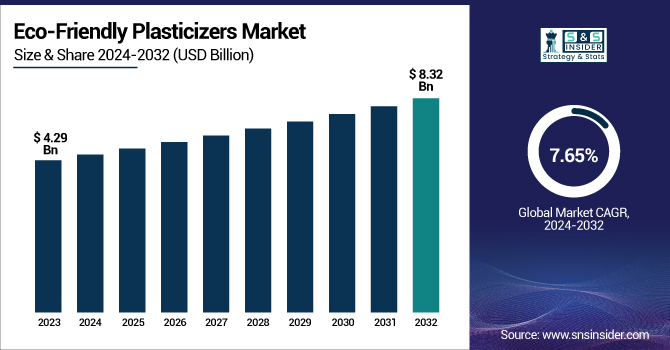
The Eco-Friendly Plasticizers Market size was USD 4.29 billion in 2023 and is expected to reach USD 8.32 billion by 2032 and grow at a CAGR of 7.65% over the forecast period of 2024-2032. The report provides detailed insights on production capacity and utilization rates by country and product type for 2023. The report covers fluctuations in feedstock prices impacting eco-friendly plasticizer production across key regions. It analyzes the regulatory impact on sustainable plasticizer development and adoption worldwide. Additionally, the report highlights environmental metrics such as emission reductions and waste management practices by major players. It also includes innovation trends and R&D activities focused on bio-based and non-toxic plasticizers, along with the adoption rate of eco-friendly alternatives across industries.
The United States held the largest share in the Eco-Friendly Plasticizers market in 2023, with a market size of USD 804 million, projected to reach USD 1610 million by 2032, growing at a CAGR of 8.02% during 2024–2032. This is due to its strong emphasis on sustainability regulations and increasing demand for non-toxic materials across various industries. The country’s strict environmental policies, such as those enforced by the Environmental Protection Agency (EPA) and initiatives promoting green chemistry, have accelerated the shift from conventional plasticizers to eco-friendly alternatives. Additionally, robust growth in sectors like packaging, automotive, and construction, where eco-friendly plasticizers are increasingly used to meet safety and environmental standards, has further fueled market expansion. Rising consumer awareness regarding health hazards linked to traditional phthalate-based plasticizers and the surge in investments by key players in research and innovation for bio-based solutions have also played a critical role. Moreover, collaborations between industries and government bodies to promote sustainable materials continue to strengthen the U.S. leadership in this market
Drivers
Rising preference for non-toxic, bio-based alternatives across end-use sectors fuels the eco-friendly plasticizers market growth.
Growing health concerns and regulatory restrictions surrounding traditional phthalate plasticizers have driven industries to adopt safer, bio-based alternatives. Eco-friendly plasticizers derived from renewable sources like soybean oil, castor oil, and citrates are witnessing increased demand in packaging, medical devices, automotive interiors, and toys. This shift is further supported by consumer awareness about environmental and health hazards. Key manufacturers are expanding their product portfolios with innovative, biodegradable plasticizers to meet evolving compliance and consumer needs. In addition, government initiatives promoting green chemistry and the circular economy are contributing to the demand surge, making bio-based plasticizers a strategic focus in the long-term sustainability goals of several industries.
Restrain
High cost and limited availability of raw materials restrain the eco-friendly plasticizers market.
Despite rising demand, the high production cost and limited raw material availability for bio-based plasticizers hinder widespread adoption. Compared to conventional phthalate plasticizers, eco-friendly alternatives require more complex synthesis and specialized feedstocks such as epoxidized oils, citrates, and castor derivatives. These inputs often face price fluctuations and availability issues due to seasonal factors, agricultural constraints, and competition for food resources. This increases production costs, which in turn impacts the final pricing of plasticizer-infused products. As a result, cost-sensitive industries like packaging and construction remain hesitant to switch completely to green plasticizers. Moreover, the lack of standardized processing technologies in certain regions adds to the inconsistency in supply and quality. These factors collectively create a barrier for small and mid-sized players trying to enter or expand within the eco-friendly plasticizer space.
Opportunity
Increasing adoption of green packaging solutions presents significant opportunities for the eco-friendly plasticizers market.
The growing global focus on sustainable packaging solutions presents lucrative opportunities for eco-friendly plasticizer manufacturers. Governments and corporations are increasingly shifting toward biodegradable and recyclable packaging to minimize environmental impact. As plasticizers play a crucial role in enhancing flexibility and durability in packaging films and containers, the demand for non-toxic and biodegradable alternatives is on the rise. Major FMCG brands and e-commerce giants are adopting green packaging solutions as part of their ESG (Environmental, Social, and Governance) commitments. This creates a promising avenue for bio-based plasticizers in flexible packaging, food wraps, and molded packaging. In addition, innovations in mono-material packaging systems that require compatible and sustainable plasticizers are expanding the market potential. This growing interest in green packaging is expected to unlock substantial growth opportunities across developed and emerging markets.
Challenge
Performance limitations and compatibility issues challenge the mass adoption of eco-friendly plasticizers globally.
Despite their eco-friendly nature, bio-based plasticizers often face challenges in achieving performance parity with traditional phthalates, particularly in demanding industrial applications. In sectors such as automotive, electronics, and high-performance flooring, plasticizers must deliver exceptional thermal stability, flexibility, and compatibility with various polymers. However, certain eco-friendly plasticizers may underperform in extreme conditions or show limited compatibility with conventional PVC and other synthetic polymers. These shortcomings can result in inferior product durability or inconsistent quality. Furthermore, the lack of standardized testing protocols and certifications across different regions creates additional uncertainty for manufacturers considering a switch to green plasticizers. Overcoming these technical barriers requires ongoing R&D investment and collaboration between raw material providers, formulators, and end-users to optimize performance and develop polymer systems that fully support eco-friendly additives without compromising product functionality.
By Product
Bio-Based Plasticizers held the largest market share, around 68%, in 2023. It is driven largely by its favorable environmental profile, increasing regulatory compliance, and rising demand for sustainable products. Bio-based plasticizers, which originate from renewable resources, e.g., vegetable oils, citrates, and castor oil, provide non-toxic and biodegradable substitutes to traditional phthalates. Many major economies, such as the U.S., Europe, and even parts of Asia, have implemented stringent regulations, such as REACH and the U.S. EPA Safer Choice Program, to mandate the use of safer, bio-based chemicals in consumer products. Moreover, as sustainability becomes the latest trend, end-use industries such as packaging, automotive, and healthcare are utilizing bio-based plasticizers to achieve sustainability objectives and fulfill the customer's requirement for eco-friendly options. Their capability to provide similar performance attributes like flexibility, durability and low volatility while having a lower carbon footprint has powered their market prevalence in the last few years.
By Application
Packaging held the largest market share, around 38%, in 2023. The packaging industry, especially in food, beverages, personal care, and pharmaceuticals, embraces materials with stringent health, safety, and environmental standards. Green plasticizers, particularly bio-based plasticizers, with non-toxicity, low migration, and durability, are requisite for packaging applications. The introduction of safe additives through agencies such as the FDA and European Food Safety Authority (EFSA) has sped up the conversion of environmentally friendly plasticizers. Furthermore, to enhance their sustainable practices in line with corporate social responsibility (CSR) initiatives and customer expectations for environmentally friendly products, major packaging firms are also focusing on sustainability. This significant regulatory impetus, coupled with industry-wide sustainability targets, has paved the way for packaging to establish itself as the leading application segment.
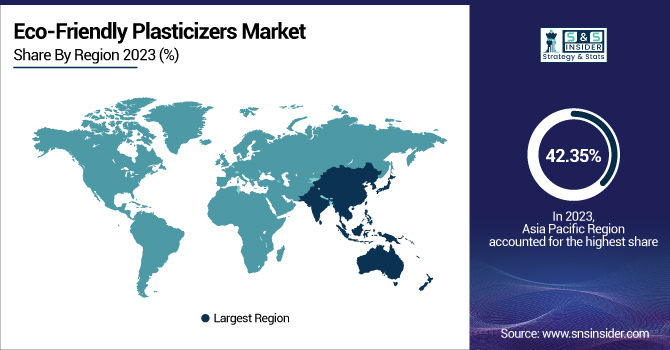
Asia Pacific held the largest market share, around 42.35%, in 2023. The region is also witnessing robust end-use industry growth, including packaging, automotive, and construction, particularly in countries such as China, India, Japan, and South Korea, where the demand for non-toxic, sustainable plasticizers has surged. Moreover, mandates that promote green manufacturing methods by the government, including Indian "National Action Plan on Climate Change" and Green Development Guidelines China have led to a greater uptake of bio-based plasticizers. A major manufacturing base and lower production costs allow prominent players to extend their facilities and offer environmentally friendly options in the market. In addition, the rising consumer consciousness regarding health and environmental safety has spurred the demand for sustainable products, thus bolstering the market in Asia Pacific.
North America held a significant market share. It is due to strong regulatory support and rising sustainability initiatives. The region, led by the U.S. and Canada, has implemented stringent regulations such as the U.S. Environmental Protection Agency (EPA) guidelines and the Canadian Environmental Protection Act, promoting the use of non-toxic, bio-based plasticizers across industries. Additionally, increasing consumer awareness regarding the environmental impact of conventional plasticizers has accelerated the demand for safer alternatives in applications like packaging, automotive, and construction. Major manufacturers in North America are investing heavily in R&D to develop innovative, eco-friendly plasticizer solutions to meet evolving environmental standards. Furthermore, growing corporate commitments toward carbon neutrality and the circular economy have further fueled market growth, making North America the leading region in adopting sustainable plasticizer technologies.
Key Players
BASF SE (Palatinol, Hexamoll)
Evonik Industries AG (ELATUR, VESTINOL)
Eastman Chemical Company (Benzoflex, Eastman 168)
Dow Chemical Company (DOW ECOLIBRIUM, DOW VERSIFY)
Arkema Group (PLANTROZ, BIOVYNYL)
Perstorp Holding AB (Pevalen, Emoltene 100)
LG Chem Ltd. (ECO-DEH, BIO-DEH)
LANXESS AG (Mesamoll, Ultramoll)
ExxonMobil Chemical (Jayflex, Vistamaxx)
UPC Technology Corporation (Polymol, Polyol)
Wacker Chemie AG (VINNAPAS, ECOSIL)
Asahi Kasei Corporation (Tufdene, Asaflex)
Hexion Inc. (ECO-LOY, VEOVA)
PolyOne Corporation (Geon BIO, OnFlex BIO)
Shandong Hongxin Chemical Co., Ltd. (HX-168, HX-510)
Grupa Azoty ZAK S.A. (OXOVIFLEX, Oxoplast Medica)
Nan Ya Plastics Corporation (Nan Ya 168, Nan Ya 108)
Meltem Kimya (MELFLEX, MELBIO)
KLJ Group (KLJ 610, KLJ 810)
Vertellus Holdings LLC (Citroflex, FlexaTrac)
In 2024, Dow launched DOW ECOLIBRIUM bio-based plasticizers specifically for wire and cable applications, focusing on lowering carbon emissions and enhancing environmental sustainability.
In May 2024, Arkema entered a partnership to expand the production of PLANTROZ plasticizers made from renewable castor oil, supporting the advancement of low-carbon materials.
Report Attributes | Details |
Market Size in 2023 | USD4.29 Billion |
Market Size by 2032 | USD8.32 Billion |
CAGR | CAGR of7.65 % From 2024 to 2032 |
Base Year | 2023 |
Forecast Period | 2024-2032 |
Historical Data | 2020-2022 |
Report Scope & Coverage | Market Size, Segments Analysis, Competitive Landscape, Regional Analysis, DROC & SWOT Analysis, Forecast Outlook |
Key Segments | • By Product (Bio-Based Plasticizers, Non-Phthalate Plasticizers) •By Application (Packaging, Consumer Goods, Automotive & Transportation, Building & Construction, Textile, Agriculture & Horticulture) |
Regional Analysis/Coverage | North America (US, Canada, Mexico), Europe (Eastern Europe [Poland, Romania, Hungary, Turkey, Rest of Eastern Europe] Western Europe] Germany, France, UK, Italy, Spain, Netherlands, Switzerland, Austria, Rest of Western Europe]), Asia Pacific (China, India, Japan, South Korea, Vietnam, Singapore, Australia, Rest of Asia Pacific), Middle East & Africa (Middle East [UAE, Egypt, Saudi Arabia, Qatar, Rest of Middle East], Africa [Nigeria, South Africa, Rest of Africa], Latin America (Brazil, Argentina, Colombia, Rest of Latin America) |
Company Profiles | BASF SE, Evonik Industries AG, Eastman Chemical Company, Dow Chemical Company, Arkema Group, Perstorp Holding AB, LG Chem Ltd., LANXESS AG, ExxonMobil Chemical, UPC Technology Corporation, Wacker Chemie AG, Asahi Kasei Corporation, Hexion Inc., PolyOne Corporation, Shandong Hongxin Chemical Co., Ltd., Grupa Azoty ZAK S.A., Nan Ya Plastics Corporation, Meltem Kimya, KLJ Group, Vertellus Holdings LLC |
Ans: The Eco-Friendly Plasticizers Market was valued at USD 4.29 billion in 2023.
Ans: The expected CAGR of the global Eco-Friendly Plasticizers Market during the forecast period is 7.65%.
Ans: The Bio-Based Plasticizers segment will grow rapidly in the Eco-Friendly Plasticizers Market from 2024 to 2032.
Ans: Rising preference for non-toxic, bio-based alternatives across end-use sectors fuels the eco-friendly plasticizers market growth.
Ans: Asia Pacific led the Eco-Friendly Plasticizers Market in the region with the highest revenue share in 2023.
Table of Content
1. Introduction
1.1 Market Definition
1.2 Scope (Inclusion and Exclusions)
1.3 Research Assumptions
2. Executive Summary
2.1 Market Overview
2.2 Regional Synopsis
2.3 Competitive Summary
3. Research Methodology
3.1 Top-Down Approach
3.2 Bottom-up Approach
3.3. Data Validation
3.4 Primary Interviews
4. Market Dynamics Impact Analysis
4.1 Market Driving Factors Analysis
4.1.2 Drivers
4.1.2 Restraints
4.1.3 Opportunities
4.1.4 Challenges
4.2 PESTLE Analysis
4.3 Porter’s Five Forces Model
5. Statistical Insights and Trends Reporting
5.1 Production Capacity and Utilization by Country, By Type, 2023
5.2 Feedstock Prices by Country, and Type, 2023
5.3 Regulatory Impact by Country and By Type 2023.
5.4 Environmental Metrics: Emissions Data, Waste Management Practices, and Sustainability Initiatives by Region
5.5 Innovation and R&D, Type, 2023
6. Competitive Landscape
6.1 List of Major Companies By Region
6.2 Market Share Analysis By Region
6.3 Product Benchmarking
6.3.1 Product specifications and features
6.3.2 Pricing
6.4 Strategic Initiatives
6.4.1 Marketing and promotional activities
6.4.2 Distribution and Supply Chain Strategies
6.4.3 Expansion Plans and New Product Launches
6.4.4 Strategic partnerships and collaborations
6.5 Technological Advancements
6.6 Market Positioning and Branding
7. Eco-Friendly Plasticizers Market Segmentation By Product
7.1 Chapter Overview
7.2 Bio-Based Plasticizers
7.2.1 Bio-Based Plasticizers Trend Analysis (2020-2032)
7.2.2 Bio-Based Plasticizers Market Size Estimates and Forecasts to 2032 (USD Billion)
7.3 Non-Phthalate Plasticizers
7.3.1 Non-Phthalate Plasticizers Market Trends Analysis (2020-2032)
7.3.2 Non-Phthalate Plasticizers Market Size Estimates and Forecasts to 2032 (USD Billion)
8. Eco-Friendly Plasticizers Market Segmentation By Application
8.1 Chapter Overview
8.2 Packaging
8.2.1 Packaging Market Trends Analysis (2020-2032)
8.2.2 Packaging Market Size Estimates and Forecasts to 2032 (USD Billion)
8.3 Consumer Goods
8.3.1 Consumer Goods Market Trends Analysis (2020-2032)
8.3.2 Consumer Goods Market Size Estimates and Forecasts to 2032 (USD Billion)
8.4 Automotive & Transportation
8.4.1 Automotive & Transportation Market Trends Analysis (2020-2032)
8.4.2 Automotive & Transportation Market Size Estimates and Forecasts to 2032 (USD Billion)
8.4 Building & Construction
8.4.1 Building & Construction Market Trends Analysis (2020-2032)
8.4.2 Building & Construction Market Size Estimates and Forecasts to 2032 (USD Billion)
8.5 Textile
8.5.1 Textile Market Trends Analysis (2020-2032)
8.5.2 Textile Market Size Estimates and Forecasts to 2032 (USD Billion)
8.6 Agriculture & Horticulture
8.6.1 Agriculture & Horticulture Market Trends Analysis (2020-2032)
8.6.2 Agriculture & Horticulture Market Size Estimates and Forecasts to 2032 (USD Billion)
9. Regional Analysis
9.1 Chapter Overview
9.2 North America
9.2.1 Trends Analysis
9.2.2 North America Eco-Friendly Plasticizers Market Estimates and Forecasts, by Country (2020-2032) (USD Billion)
9.2.3 North America Eco-Friendly Plasticizers Market Estimates and Forecasts, By Product (2020-2032) (USD Billion)
9.2.4 North America Eco-Friendly Plasticizers Market Estimates and Forecasts, By Application (2020-2032) (USD Billion)
9.2.5 USA
9.2.5.1 USA Eco-Friendly Plasticizers Market Estimates and Forecasts, By Product (2020-2032) (USD Billion)
9.2.5.2 USA Eco-Friendly Plasticizers Market Estimates and Forecasts, By Application (2020-2032) (USD Billion)
9.2.6 Canada
9.2.6.1 Canada Eco-Friendly Plasticizers Market Estimates and Forecasts, By Product (2020-2032) (USD Billion)
9.2.6.2 Canada Eco-Friendly Plasticizers Market Estimates and Forecasts, By Application (2020-2032) (USD Billion)
9.2.7 Mexico
9.2.7.1 Mexico Eco-Friendly Plasticizers Market Estimates and Forecasts, By Product (2020-2032) (USD Billion)
9.2.7.2 Mexico Eco-Friendly Plasticizers Market Estimates and Forecasts, By Application (2020-2032) (USD Billion)
9.3 Europe
9.3.1 Eastern Europe
9.3.1.1 Trends Analysis
9.3.1.2 Eastern Europe Eco-Friendly Plasticizers Market Estimates and Forecasts, by Country (2020-2032) (USD Billion)
9.3.1.3 Eastern Europe Eco-Friendly Plasticizers Market Estimates and Forecasts, By Product (2020-2032) (USD Billion)
9.3.1.4 Eastern Europe Eco-Friendly Plasticizers Market Estimates and Forecasts, By Application (2020-2032) (USD Billion)
9.3.1.5 Poland
9.3.1.5.1 Poland Eco-Friendly Plasticizers Market Estimates and Forecasts, By Product (2020-2032) (USD Billion)
9.3.1.5.2 Poland Eco-Friendly Plasticizers Market Estimates and Forecasts, By Application (2020-2032) (USD Billion)
9.3.1.6 Romania
9.3.1.6.1 Romania Eco-Friendly Plasticizers Market Estimates and Forecasts, By Product (2020-2032) (USD Billion)
9.3.1.6.2 Romania Eco-Friendly Plasticizers Market Estimates and Forecasts, By Application (2020-2032) (USD Billion)
9.3.1.7 Hungary
9.3.1.7.1 Hungary Eco-Friendly Plasticizers Market Estimates and Forecasts, By Product (2020-2032) (USD Billion)
9.3.1.7.2 Hungary Eco-Friendly Plasticizers Market Estimates and Forecasts, By Application (2020-2032) (USD Billion)
9.3.1.8 Turkey
9.3.1.8.1 Turkey Eco-Friendly Plasticizers Market Estimates and Forecasts, By Product (2020-2032) (USD Billion)
9.3.1.8.2 Turkey Eco-Friendly Plasticizers Market Estimates and Forecasts, By Application (2020-2032) (USD Billion)
9.3.1.9 Rest of Eastern Europe
9.3.1.9.1 Rest of Eastern Europe Eco-Friendly Plasticizers Market Estimates and Forecasts, By Product (2020-2032) (USD Billion)
9.3.1.9.2 Rest of Eastern Europe Eco-Friendly Plasticizers Market Estimates and Forecasts, By Application (2020-2032) (USD Billion)
9.3.2 Western Europe
9.3.2.1 Trends Analysis
9.3.2.2 Western Europe Eco-Friendly Plasticizers Market Estimates and Forecasts, by Country (2020-2032) (USD Billion)
9.3.2.3 Western Europe Eco-Friendly Plasticizers Market Estimates and Forecasts, By Product (2020-2032) (USD Billion)
9.3.2.4 Western Europe Eco-Friendly Plasticizers Market Estimates and Forecasts, By Application (2020-2032) (USD Billion)
9.3.2.5 Germany
9.3.2.5.1 Germany Eco-Friendly Plasticizers Market Estimates and Forecasts, By Product (2020-2032) (USD Billion)
9.3.2.5.2 Germany Eco-Friendly Plasticizers Market Estimates and Forecasts, By Application (2020-2032) (USD Billion)
9.3.2.6 France
9.3.2.6.1 France Eco-Friendly Plasticizers Market Estimates and Forecasts, By Product (2020-2032) (USD Billion)
9.3.2.6.2 France Eco-Friendly Plasticizers Market Estimates and Forecasts, By Application (2020-2032) (USD Billion)
9.3.2.7 UK
9.3.2.7.1 UK Eco-Friendly Plasticizers Market Estimates and Forecasts, By Product (2020-2032) (USD Billion)
9.3.2.7.2 UK Eco-Friendly Plasticizers Market Estimates and Forecasts, By Application (2020-2032) (USD Billion)
9.3.2.8 Italy
9.3.2.8.1 Italy Eco-Friendly Plasticizers Market Estimates and Forecasts, By Product (2020-2032) (USD Billion)
9.3.2.8.2 Italy Eco-Friendly Plasticizers Market Estimates and Forecasts, By Application (2020-2032) (USD Billion)
9.3.2.9 Spain
9.3.2.9.1 Spain Eco-Friendly Plasticizers Market Estimates and Forecasts, By Product (2020-2032) (USD Billion)
9.3.2.9.2 Spain Eco-Friendly Plasticizers Market Estimates and Forecasts, By Application (2020-2032) (USD Billion)
9.3.2.10 Netherlands
9.3.2.10.1 Netherlands Eco-Friendly Plasticizers Market Estimates and Forecasts, By Product (2020-2032) (USD Billion)
9.3.2.10.2 Netherlands Eco-Friendly Plasticizers Market Estimates and Forecasts, By Application (2020-2032) (USD Billion)
9.3.2.11 Switzerland
9.3.2.11.1 Switzerland Eco-Friendly Plasticizers Market Estimates and Forecasts, By Product (2020-2032) (USD Billion)
9.3.2.11.2 Switzerland Eco-Friendly Plasticizers Market Estimates and Forecasts, By Application (2020-2032) (USD Billion)
9.3.2.12 Austria
9.3.2.12.1 Austria Eco-Friendly Plasticizers Market Estimates and Forecasts, By Product (2020-2032) (USD Billion)
9.3.2.12.2 Austria Eco-Friendly Plasticizers Market Estimates and Forecasts, By Application (2020-2032) (USD Billion)
9.3.2.13 Rest of Western Europe
9.3.2.13.1 Rest of Western Europe Eco-Friendly Plasticizers Market Estimates and Forecasts, By Product (2020-2032) (USD Billion)
9.3.2.13.2 Rest of Western Europe Eco-Friendly Plasticizers Market Estimates and Forecasts, By Application (2020-2032) (USD Billion)
9.4 Asia Pacific
9.4.1 Trends Analysis
9.4.2 Asia Pacific Eco-Friendly Plasticizers Market Estimates and Forecasts, by Country (2020-2032) (USD Billion)
9.4.3 Asia Pacific Eco-Friendly Plasticizers Market Estimates and Forecasts, By Product (2020-2032) (USD Billion)
9.4.4 Asia Pacific Eco-Friendly Plasticizers Market Estimates and Forecasts, By Application (2020-2032) (USD Billion)
9.4.5 China
9.4.5.1 China Eco-Friendly Plasticizers Market Estimates and Forecasts, By Product (2020-2032) (USD Billion)
9.4.5.2 China Eco-Friendly Plasticizers Market Estimates and Forecasts, By Application (2020-2032) (USD Billion)
9.4.6 India
9.4.5.1 India Eco-Friendly Plasticizers Market Estimates and Forecasts, By Product (2020-2032) (USD Billion)
9.4.5.2 India Eco-Friendly Plasticizers Market Estimates and Forecasts, By Application (2020-2032) (USD Billion)
9.4.5 Japan
9.4.5.1 Japan Eco-Friendly Plasticizers Market Estimates and Forecasts, By Product (2020-2032) (USD Billion)
9.4.5.2 Japan Eco-Friendly Plasticizers Market Estimates and Forecasts, By Application (2020-2032) (USD Billion)
9.4.6 South Korea
9.4.6.1 South Korea Eco-Friendly Plasticizers Market Estimates and Forecasts, By Product (2020-2032) (USD Billion)
9.4.6.2 South Korea Eco-Friendly Plasticizers Market Estimates and Forecasts, By Application (2020-2032) (USD Billion)
9.4.7 Vietnam
9.4.7.1 Vietnam Eco-Friendly Plasticizers Market Estimates and Forecasts, By Product (2020-2032) (USD Billion)
9.2.7.2 Vietnam Eco-Friendly Plasticizers Market Estimates and Forecasts, By Application (2020-2032) (USD Billion)
9.4.8 Singapore
9.4.8.1 Singapore Eco-Friendly Plasticizers Market Estimates and Forecasts, By Product (2020-2032) (USD Billion)
9.4.8.2 Singapore Eco-Friendly Plasticizers Market Estimates and Forecasts, By Application (2020-2032) (USD Billion)
9.4.9 Australia
9.4.9.1 Australia Eco-Friendly Plasticizers Market Estimates and Forecasts, By Product (2020-2032) (USD Billion)
9.4.9.2 Australia Eco-Friendly Plasticizers Market Estimates and Forecasts, By Application (2020-2032) (USD Billion)
9.4.10 Rest of Asia Pacific
9.4.10.1 Rest of Asia Pacific Eco-Friendly Plasticizers Market Estimates and Forecasts, By Product (2020-2032) (USD Billion)
9.4.10.2 Rest of Asia Pacific Eco-Friendly Plasticizers Market Estimates and Forecasts, By Application (2020-2032) (USD Billion)
9.5 Middle East and Africa
9.5.1 Middle East
9.5.1.1 Trends Analysis
9.5.1.2 Middle East Eco-Friendly Plasticizers Market Estimates and Forecasts, by Country (2020-2032) (USD Billion)
9.5.1.3 Middle East Eco-Friendly Plasticizers Market Estimates and Forecasts, By Product (2020-2032) (USD Billion)
9.5.1.4 Middle East Eco-Friendly Plasticizers Market Estimates and Forecasts, By Application (2020-2032) (USD Billion)
9.5.1.5 UAE
9.5.1.5.1 UAE Eco-Friendly Plasticizers Market Estimates and Forecasts, By Product (2020-2032) (USD Billion)
9.5.1.5.2 UAE Eco-Friendly Plasticizers Market Estimates and Forecasts, By Application (2020-2032) (USD Billion)
9.5.1.6 Egypt
9.5.1.6.1 Egypt Eco-Friendly Plasticizers Market Estimates and Forecasts, By Product (2020-2032) (USD Billion)
9.5.1.6.2 Egypt Eco-Friendly Plasticizers Market Estimates and Forecasts, By Application (2020-2032) (USD Billion)
9.5.1.7 Saudi Arabia
9.5.1.7.1 Saudi Arabia Eco-Friendly Plasticizers Market Estimates and Forecasts, By Product (2020-2032) (USD Billion)
9.5.1.7.2 Saudi Arabia Eco-Friendly Plasticizers Market Estimates and Forecasts, By Application (2020-2032) (USD Billion)
9.5.1.8 Qatar
9.5.1.8.1 Qatar Eco-Friendly Plasticizers Market Estimates and Forecasts, By Product (2020-2032) (USD Billion)
9.5.1.8.2 Qatar Eco-Friendly Plasticizers Market Estimates and Forecasts, By Application (2020-2032) (USD Billion)
9.5.1.9 Rest of Middle East
9.5.1.9.1 Rest of Middle East Eco-Friendly Plasticizers Market Estimates and Forecasts, By Product (2020-2032) (USD Billion)
9.5.1.9.2 Rest of Middle East Eco-Friendly Plasticizers Market Estimates and Forecasts, By Application (2020-2032) (USD Billion)
9.5.2 Africa
9.5.2.1 Trends Analysis
9.5.2.2 Africa Eco-Friendly Plasticizers Market Estimates and Forecasts, by Country (2020-2032) (USD Billion)
9.5.2.3 Africa Eco-Friendly Plasticizers Market Estimates and Forecasts, By Product (2020-2032) (USD Billion)
9.5.2.4 Africa Eco-Friendly Plasticizers Market Estimates and Forecasts, By Application (2020-2032) (USD Billion)
9.5.2.5 South Africa
9.5.2.5.1 South Africa Eco-Friendly Plasticizers Market Estimates and Forecasts, By Product (2020-2032) (USD Billion)
9.5.2.5.2 South Africa Eco-Friendly Plasticizers Market Estimates and Forecasts, By Application (2020-2032) (USD Billion)
9.5.2.6 Nigeria
9.5.2.6.1 Nigeria Eco-Friendly Plasticizers Market Estimates and Forecasts, By Product (2020-2032) (USD Billion)
9.5.2.6.2 Nigeria Eco-Friendly Plasticizers Market Estimates and Forecasts, By Application (2020-2032) (USD Billion)
9.6 Latin America
9.6.1 Trends Analysis
9.6.2 Latin America Eco-Friendly Plasticizers Market Estimates and Forecasts, by Country (2020-2032) (USD Billion)
9.6.3 Latin America Eco-Friendly Plasticizers Market Estimates and Forecasts, By Product (2020-2032) (USD Billion)
9.6.4 Latin America Eco-Friendly Plasticizers Market Estimates and Forecasts, By Application (2020-2032) (USD Billion)
9.6.5 Brazil
9.6.5.1 Brazil Eco-Friendly Plasticizers Market Estimates and Forecasts, By Product (2020-2032) (USD Billion)
9.6.5.2 Brazil Eco-Friendly Plasticizers Market Estimates and Forecasts, By Application (2020-2032) (USD Billion)
9.6.6 Argentina
9.6.6.1 Argentina Eco-Friendly Plasticizers Market Estimates and Forecasts, By Product (2020-2032) (USD Billion)
9.6.6.2 Argentina Eco-Friendly Plasticizers Market Estimates and Forecasts, By Application (2020-2032) (USD Billion)
9.6.7 Colombia
9.6.7.1 Colombia Eco-Friendly Plasticizers Market Estimates and Forecasts, By Product (2020-2032) (USD Billion)
9.6.7.2 Colombia Eco-Friendly Plasticizers Market Estimates and Forecasts, By Application (2020-2032) (USD Billion)
9.6.8 Rest of Latin America
9.6.8.1 Rest of Latin America Eco-Friendly Plasticizers Market Estimates and Forecasts, By Product (2020-2032) (USD Billion)
9.6.8.2 Rest of Latin America Eco-Friendly Plasticizers Market Estimates and Forecasts, By Application (2020-2032) (USD Billion)
10. Company Profiles
10.1 BASF SE
10.1.1 Company Overview
10.1.2 Financial
10.1.3 Product / Services Offered
10.1.4 SWOT Analysis
10.2 Evonik Industries AG
10.2.1 Company Overview
10.2.2 Financial
10.2.3 Product/ Services Offered
10.2.4 SWOT Analysis
10.3 Eastman Chemical Company
10.3.1 Company Overview
10.3.2 Financial
10.3.3 Product/ Services Offered
10.3.4 SWOT Analysis
10.4 The Dow Chemical Company
10.4.1 Company Overview
10.4.2 Financial
10.4.3 Product/ Services Offered
10.4.4 SWOT Analysis
10.5 Arkema Group
10.5.1 Company Overview
10.5.2 Financial
10.5.3 Product/ Services Offered
10.5.4 SWOT Analysis
10.6 Perstorp Holding AB
10.6.1 Company Overview
10.6.2 Financial
10.6.3 Product/ Services Offered
10.6.4 SWOT Analysis
10.7 LG Chem Ltd.
10.7.1 Company Overview
10.7.2 Financial
10.7.3 Product/ Services Offered
10.7.4 SWOT Analysis
10.8 LANXESS AG
10.8.1 Company Overview
10.8.2 Financial
10.8.3 Product/ Services Offered
10.8.4 SWOT Analysis
10.9 ExxonMobil Chemical
10.9.1 Company Overview
10.9.2 Financial
10.9.3 Product/ Services Offered
10.9.4 SWOT Analysis
10.10 UPC Technology Corporation
10.10.1 Company Overview
10.10.2 Financial
10.10.3 Product/ Services Offered
10.10.4 SWOT Analysis
11. Use Cases and Best Practices
12. Conclusion
An accurate research report requires proper strategizing as well as implementation. There are multiple factors involved in the completion of good and accurate research report and selecting the best methodology to compete the research is the toughest part. Since the research reports we provide play a crucial role in any company’s decision-making process, therefore we at SNS Insider always believe that we should choose the best method which gives us results closer to reality. This allows us to reach at a stage wherein we can provide our clients best and accurate investment to output ratio.
Each report that we prepare takes a timeframe of 350-400 business hours for production. Starting from the selection of titles through a couple of in-depth brain storming session to the final QC process before uploading our titles on our website we dedicate around 350 working hours. The titles are selected based on their current market cap and the foreseen CAGR and growth.
The 5 steps process:
Step 1: Secondary Research:
Secondary Research or Desk Research is as the name suggests is a research process wherein, we collect data through the readily available information. In this process we use various paid and unpaid databases which our team has access to and gather data through the same. This includes examining of listed companies’ annual reports, Journals, SEC filling etc. Apart from this our team has access to various associations across the globe across different industries. Lastly, we have exchange relationships with various university as well as individual libraries.
Step 2: Primary Research
When we talk about primary research, it is a type of study in which the researchers collect relevant data samples directly, rather than relying on previously collected data. This type of research is focused on gaining content specific facts that can be sued to solve specific problems. Since the collected data is fresh and first hand therefore it makes the study more accurate and genuine.
We at SNS Insider have divided Primary Research into 2 parts.
Part 1 wherein we interview the KOLs of major players as well as the upcoming ones across various geographic regions. This allows us to have their view over the market scenario and acts as an important tool to come closer to the accurate market numbers. As many as 45 paid and unpaid primary interviews are taken from both the demand and supply side of the industry to make sure we land at an accurate judgement and analysis of the market.
This step involves the triangulation of data wherein our team analyses the interview transcripts, online survey responses and observation of on filed participants. The below mentioned chart should give a better understanding of the part 1 of the primary interview.
Part 2: In this part of primary research the data collected via secondary research and the part 1 of the primary research is validated with the interviews from individual consultants and subject matter experts.
Consultants are those set of people who have at least 12 years of experience and expertise within the industry whereas Subject Matter Experts are those with at least 15 years of experience behind their back within the same space. The data with the help of two main processes i.e., FGDs (Focused Group Discussions) and IDs (Individual Discussions). This gives us a 3rd party nonbiased primary view of the market scenario making it a more dependable one while collation of the data pointers.
Step 3: Data Bank Validation
Once all the information is collected via primary and secondary sources, we run that information for data validation. At our intelligence centre our research heads track a lot of information related to the market which includes the quarterly reports, the daily stock prices, and other relevant information. Our data bank server gets updated every fortnight and that is how the information which we collected using our primary and secondary information is revalidated in real time.
Step 4: QA/QC Process
After all the data collection and validation our team does a final level of quality check and quality assurance to get rid of any unwanted or undesired mistakes. This might include but not limited to getting rid of the any typos, duplication of numbers or missing of any important information. The people involved in this process include technical content writers, research heads and graphics people. Once this process is completed the title gets uploader on our platform for our clients to read it.
Step 5: Final QC/QA Process:
This is the last process and comes when the client has ordered the study. In this process a final QA/QC is done before the study is emailed to the client. Since we believe in giving our clients a good experience of our research studies, therefore, to make sure that we do not lack at our end in any way humanly possible we do a final round of quality check and then dispatch the study to the client.
Key Segments
Product
Bio-Based Plasticizers
Non-Phthalate Plasticizers
Application
Packaging
Consumer Goods
Automotive & Transportation
Building & Construction
Textile
Agriculture & Horticulture
Request for Segment Customization as per your Business Requirement: Segment Customization Request
Regional Coverage:
North America
US
Canada
Mexico
Europe
Eastern Europe
Poland
Romania
Hungary
Turkey
Rest of Eastern Europe
Western Europe
Germany
France
UK
Italy
Spain
Netherlands
Switzerland
Austria
Rest of Western Europe
Asia Pacific
China
India
Japan
South Korea
Vietnam
Singapore
Australia
Rest of Asia Pacific
Middle East & Africa
Middle East
UAE
Egypt
Saudi Arabia
Qatar
Rest of Middle East
Africa
Nigeria
South Africa
Rest of Africa
Latin America
Brazil
Argentina
Colombia
Rest of Latin America
Request for Country Level Research Report: Country Level Customization Request
Available Customization
With the given market data, SNS Insider offers customization as per the company’s specific needs. The following customization options are available for the report:
Detailed Volume Analysis
Criss-Cross segment analysis (e.g. Product X Application)
Competitive Product Benchmarking
Geographic Analysis
Additional countries in any of the regions
Customized Data Representation
Detailed analysis and profiling of additional market players
The Biolubricants Market Size was valued at USD 2.59 billion in 2023 and is expected to reach USD 4.14 Bn by 2032 and grow at a CAGR of 6.13% by 2024-2032
Plain Bearing Market size was estimated at USD 12.88 billion in 2023 and is expected to reach USD 20.33 billion by 2032 at a CAGR of 5.20% from 2024 to 2032.
The Paints and Coatings Market size was USD 186.74 billion in 2023 & is expected to reach USD 254.51 Bn by 2032 & grow at a CAGR of 3.50% by 2024-2032.
Advanced Composites Market was valued at USD 38.5 billion in 2023 and is expected to reach USD 91.1 Billion by 2032, growing at a CAGR of 10.07% from 2024-2032.
The Potash Market Size was valued at USD 60.36 Billion in 2023 and is expected to reach USD 91.73 Billion by 2032, growing at a CAGR of 4.76% from 2024-2032.
Bromobenzene Market Size was valued at USD 1,231.30 Million in 2023 and is expected to reach USD 1,853.90 Million by 2032, at a CAGR of 4.70% from 2024-2032.
Hi! Click one of our member below to chat on Phone