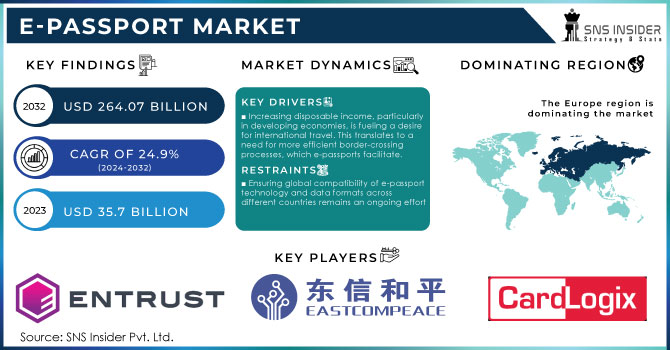
The E-passport Market was valued at USD 32.67 Billion in 2023 and is expected to reach USD 145.45 Billion by 2032, growing at a CAGR of 18.08% over the forecast period 2024-2032.
Get more information on E-passport Market - Request Free Sample Report
Rising demand for secure efficient travel solutions is a primary driver of the e-passport market, and further growth can be expected. With international travel on the increase, countries are implementing advanced technologies including RFID and biometrics into their border control operations to step up their protections against identity theft, fraud, and security breaches. With the inclusion of chips, the e-passport can store biometric information that can uniquely identify a person, fingerprints, and/or facial recognition of a person, thus making it harder for unauthorized or non-legitimate people to clone or alter documents. In part, greater security is driving this especially as governments work to protect citizens and preserve the very definition and integrity of travel documentation. There are more than 1 billion ePassports issued currently, by 174 countries as of December 2024. Biometric passports likely accounted for about 24.5 million passports in the US in 2024. The adoption of ePassports is growing rapidly, highlighting the global trend of secure and efficient travel documentation.
The e-passport market is also being driven by rising biometric system adoption at airports and immigration centers around the world. This speeds up and simplifies the passport verification process, which reduces the time taken to cross a border. The demand for e-passports is also driven by growth in international tourism, business travel, and the worldwide demand for digital identity solutions. E-passports are being integrated with biometrics as part of a global digital transformation of the governmental and security infrastructure that will ultimately make travel easier and safer for people everywhere. International tourist numbers topped 1.4 billion and tourism receipts USD 1.6 trillion in 2024. As travelers using biometrics at airports has climbed to 46%, the preference for biometrics over conventional methods is at 75%. TSA's biometric rollout will take place at 400 U.S. airports, while India operates its Digi Yatra system at 28 different airports, covering 90% of the country's domestic air travel.
Key Drivers:
Government Investments in Border Security and Biometric Systems Drive E-passport Market Growth
Government investments in identity management and border security systems are one of the major factors responsible for the growth of the e-passport market. As the threat of terrorism, illegal immigration, and organized crime grows, governments across the globe are prioritizing border security. The advanced biometric capabilities of e-passports provide a trustworthy and secure means of verifying the identity of travelers, significantly reducing the opportunity for fraud and impersonation. Numerous nations have overhauled their passport delivery techniques to fulfill the global norms of the International Civil Aviation Organization (ICAO), which promotes the utilization of biometric info in passports to enhance outskirt safety. Such government initiatives and regulations have been instrumental in the global acceptance of e-passports, as nations rush to meet the changing landscape of security requirements while safeguarding the lives of citizens and visitors alike. The U.S. Department of Homeland Security approved USD 103.2b for 2024 for border security, but only USD 60.4b for discretionary purposes. ICE spending climbed from USD 3.3 billion in 2003 to USD 9.6 billion. With practices dating back to 2020, the U.S. has invested USD 7.8 billion dollars into its immigration technologies and working with 263 partners who specialize in biometric systems.
E-passport Adoption Accelerates with Digital Technologies Frictionless Travel and Smart Airport Integration
Moreover, the increasing adoption of digital technologies and initiatives aimed at ensuring smooth human-to-human migration is another factor fueling the e-passport market. At the same time, increasing numbers of travelers want speedier access to cross borders without sacrificing security. E-passports facilitate the integration of biometrics, facial recognition, and RFID technology, which can significantly improve the immigration process, reducing the waiting period at the airport, and enhancing the overall travel spending experience. Growth of “smart” airports Automated self-check-in kiosks and biometric scanners could develop in both of these types of airports, creating greater demand for e-passports, as e-passports include advanced features that facilitate seamless verification on the part of the digital travel ecosystem. As e-passports enable efficient, fast, and secure border processing of millions of travelers around the globe, their adoption rate is on the rise amidst the push to contactless and frictionless travel.
Restrain:
Challenges of Technological Interoperability Data Privacy and Security in E-passport Adoption
Technological interoperability and standardization are some of the key challenges restraining the growth of the e-passport market. The need for data encryption, biometrics, and passport chip technology differs from country to region, and traveling across borders also brings with it compatibility issues. Such a lack of harmonization can obstruct the global uptake of e-passports and may result in seeming inconsistency in the manner in which biometric data is stored and processed, causing inconvenience or errors in travel document validation. There is also a major hurdle in data privacy and cyber-attack. Since e-passports include sensitive biometric information like fingerprints and facial images they present a lucrative target for cyberattacks and data breaches. This personal information needs to be protected against identity theft or use by someone else. Keeping e-passports secure from hacking and unauthorized access is a complex, ongoing challenge for governments and other organizations, which need to continuously upgrade security protocols.
By Technology
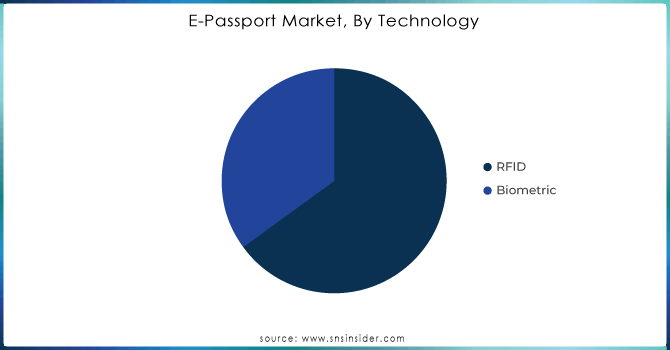
In 2023, RFID held the highest share of the e-passport market at 63.6%, largely due to its widespread presence and widespread adoption across several countries. RFID technology has proven methods of securely storing and transmitting information from an embedded chip in e-passports and allows for faster, automated border control procedures. The system also acts as an unattended contactless authentication method that allows travelers to clear security passages without physical contact. RFID has a significant market share due to its simplicity, low cost to implement, and reliable performance, and many countries are using RFID-based electronic passports for international travel.
Biometrics is expected to have the highest CAGR growth in 2024-2032 owing to the rising security concerns and the need for stronger identity verification of travelers. Fingerprint recognition, facial recognition, and iris scanning are all considered biometric identifiers and are more secure than traditional RFID because their uniqueness is a lot higher and they cannot be forged or replicated, unlike RFID cards. Even in e-passports, with governments and moving authorities placing greater importance on preventing fraud, biometrics are coming to play larger roles. But this change is actually in line with the whole new paradigm shift going around the globe towards better digital ways of travel through Made Easy, Safe, and Secured Travels. As the technology gets polished and cheaper, so will its expansion which will make the global travel experience a lot more secure and efficient.
By Application
In 2023, leisure travel held the largest share in the e-passport market at 55.2% owing to the rise in international tourist arrivals and the wider accessibility of global travel. As disposable incomes rise and international travel is easier to book, the number of travelers hitting the skies, ocean, and rails has also increased and so has the need for travel documents that facilitate safe and secure travel. As the thirst for long trips, holidays and cultural gastronomy has driven the expansion of tourism, e-passport use has greatly spread among holiday travelers, providing a reliable and rapid option for border processing. This dominance is also bolstered by the commonality of e-passports in tourism-heavy areas such as Europe, North America, and Asia.
Business travel is expected to witness the highest CAGR growth from 2024-2032 owing to the swift internationalization of sectors and the rising demand for cross-border collaboration and meetings. Overseas expansion requires more business-related travel, increasing the adoption rate of e-passports from corporations as well as the government. E-passports, which incorporate biometric information and RFID technology, provide the more fluid, secure, and efficient border crossings that business travelers often need. Also, the lifting of international business activities after a long apocalyptic shutdown and the upsurge of international conferences and trade shows, along with work-from-home setups, will also boost business tourism growth.
Need any customization research on E-passport Market - Enquiry Now
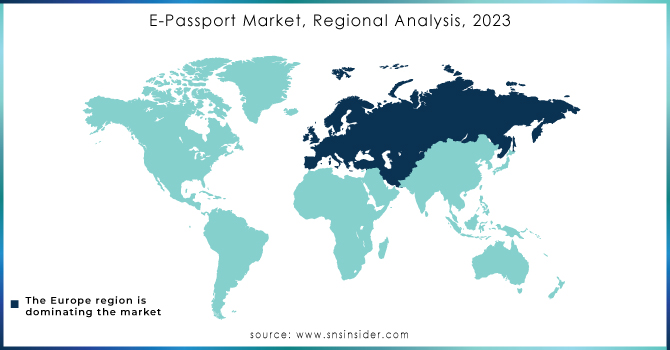
In 2023, Europe held the largest share of the e-passport market with 38.2% due to the significant infrastructure and adoption of secure travel technologies in the region. The deployment of e-passports in many European nations, including the UK, Germany, and France has been close to reaching the maximum standardized execution of the mandatory travel enforced globally by the International Civil Aviation Organization (ICAO). While its ambitions for military modernization are still developing, the EU has had more success with investments in border security and digital identity projects like the European Travel Information and Authorization System (ETIAS), which is designed to improve travel security at EU frontiers. With nations such as Sweden and Estonia already leading the charge towards biometric e-passports, and other governments exploring systems too, it is clear the region is forcing the pace of development further and driving the market.
Asia Pacific region is anticipated to witness the highest CAGR from 2024 to 2032 owing to high growth in international travel and the rising need for secure travel documents. Driven by increasing security and countermeasures worries, a lot more nations such as China, India, and Japan are earmarking bigger expense budgets for biometric and RFID e-passports. China, for example, has made considerable headway on the biometric passport front, including fingerprint and facial recognition to ease the pressure on border control departments. Likewise, India has also been updating the passport system with new methods such as e-passports that have RFID Chips and biometric information, due to having the second largest population with many more international travelers coming from India. This expansion will be boosted by the increasing saturation of the digital transformation in the Asia Pacific region and the demand for travel with high growth in emerging economies that will remain one of the vectors for the implementation of e-passports in the future.
Some of the major players in the E-passport Market are:
Gemalto (Thales Group) (eTravel, Premium eCover)
IDEMIA (eID, ePass)
Bundesdruckerei GmbH (Polycarbonate Data Pages, ePassport Personalization Systems)
Mühlbauer Group (ePassport Inlays, ePassport Personalization Systems)
De La Rue plc (ePassport Printing Solutions, ePassport Personalization Systems)
Veridos GmbH (ePassport Solutions, eID Cards)
Oberthur Technologies (Idemia Group) (ePassport Solutions, eID Cards)
IDEX ASA (Fingerprint Sensors, Biometric Cards)
Mühlbauer Holding AG (ePassport Inlays, ePassport Personalization Systems)
Shanghai Mite Speciality & Precision Printing (Security Printing Services, ePassport Printing)
India Security Press (Passport Printing, Security Printing)
Beijing Jinchen Cvic Security Printing (Security Printing Services, ePassport Printing)
Japan National Printing Bureau (Passport Printing, Security Printing)
Goznak (Security Printing, ePassport Printing)
Casa da Moeda do Brasil (Security Printing, ePassport Printing)
Canadian Bank Note (Security Printing, ePassport Printing)
Royal Mint of Spain (Security Printing, ePassport Printing)
Polish Security Printing Works (Security Printing, ePassport Printing)
Istituto Poligrafico e Zecca dello Stato (Security Printing, ePassport Printing)
Iris Corporation Berhad (ePassport Solutions, Biometric Systems)
Some of the Raw Material Suppliers for E-passport companies:
3M
DuPont
Eastman Chemical Company
Xerox Corporation
BASF
Arjowiggins
U.S. Banknote Corporation
LG Chem
Schreiner Group
Avery Dennison Corporation
In June 2024, The Netherlands introduced new identity documents featuring LASINK™ Helios by IDEMIA, enhancing security with advanced biometric and optical technology.
In February 2024, Veridos launched Latvia's first-ever ePassport featuring a color photo, enhancing both security and design. The innovative document was recognized with the "Regional ID Document of the Year Award" at the 2024 HSP conference.
In January 2025, IDEX Biometrics ASA partnered with LIFE CARD to launch biometric payment cards in Japan, marking the country's first commercial deployment. This innovation is set to enhance security and convenience in Japan's payments market by 2025.
| Report Attributes | Details |
|---|---|
| Market Size in 2023 | USD 32.67 Billion |
| Market Size by 2032 | USD 145.45 Billion |
| CAGR | CAGR of 18.08% From 2024 to 2032 |
| Base Year | 2023 |
| Forecast Period | 2024-2032 |
| Historical Data | 2020-2022 |
| Report Scope & Coverage | Market Size, Segments Analysis, Competitive Landscape, Regional Analysis, DROC & SWOT Analysis, Forecast Outlook |
| Key Segments | • By Technology (RFID, Biometrics) • By Application (Business Travel, Leisure Travel) |
| Regional Analysis/Coverage | North America (US, Canada, Mexico), Europe (Eastern Europe [Poland, Romania, Hungary, Turkey, Rest of Eastern Europe] Western Europe] Germany, France, UK, Italy, Spain, Netherlands, Switzerland, Austria, Rest of Western Europe]), Asia Pacific (China, India, Japan, South Korea, Vietnam, Singapore, Australia, Rest of Asia Pacific), Middle East & Africa (Middle East [UAE, Egypt, Saudi Arabia, Qatar, Rest of Middle East], Africa [Nigeria, South Africa, Rest of Africa], Latin America (Brazil, Argentina, Colombia, Rest of Latin America) |
| Company Profiles | Gemalto (Thales Group), IDEMIA, Bundesdruckerei GmbH, Mühlbauer Group, De La Rue plc, Veridos GmbH, Oberthur Technologies (Idemia Group), IDEX ASA, Mühlbauer Holding AG, Shanghai Mite Speciality & Precision Printing, India Security Press, Beijing Jinchen Cvic Security Printing, Japan National Printing Bureau, Goznak, Casa da Moeda do Brasil, Canadian Bank Note, Royal Mint of Spain, Polish Security Printing Works, Istituto Poligrafico e Zecca dello Stato, Iris Corporation Berhad. |
| Key Drivers | • Government Investments in Border Security and Biometric Systems Drive E-passport Market Growth • E-passport Adoption Accelerates with Digital Technologies Frictionless Travel and Smart Airport Integration |
| RESTRAINTS | • Challenges of Technological Interoperability Data Privacy and Security in E-passport Adoption |
Ans: The E-passport Market is expected to grow at a CAGR of 18.08% during 2024-2032.
Ans: E-passport Market size was USD 32.67 Billion in 2023 and is expected to Reach USD 145.45 Billion by 2032.
Ans: The major growth factor of the e-passport market is the increasing demand for enhanced security and efficient border control through biometric and RFID technology.
Ans: The RFID segment dominated the Industrial battery market in 2023.
Ans: Europe dominated the E-passport Market in 2023.
Table of Content
1. Introduction
1.1 Market Definition
1.2 Scope (Inclusion and Exclusions)
1.3 Research Assumptions
2. Executive Summary
2.1 Market Overview
2.2 Regional Synopsis
2.3 Competitive Summary
3. Research Methodology
3.1 Top-Down Approach
3.2 Bottom-up Approach
3.3. Data Validation
3.4 Primary Interviews
4. Market Dynamics Impact Analysis
4.1 Market Driving Factors Analysis
4.1.1 Drivers
4.1.2 Restraints
4.2 PESTLE Analysis
4.3 Porter’s Five Forces Model
5. Statistical Insights and Trends Reporting
5.1 E-passport Security Incident Rate (2023)
5.2 E-passport Issuance Volume (2023)
5.3 E-passport Cost of Production
5.4 E-passport Public Adoption vs. Business Adoption
6. Competitive Landscape
6.1 List of Major Companies, By Region
6.2 Market Share Analysis, By Region
6.3 Product Benchmarking
6.3.1 Product specifications and features
6.3.2 Pricing
6.4 Strategic Initiatives
6.4.1 Marketing and promotional activities
6.4.2 Distribution and Supply Chain Strategies
6.4.3 Expansion plans and new product launches
6.4.4 Strategic partnerships and collaborations
6.5 Technological Advancements
6.6 Market Positioning and Branding
7. E-passport Market Segmentation, By Technology
7.1 Chapter Overview
7.2 RFID
7.2.1 RFID Market Trends Analysis (2020-2032)
7.2.2 RFID Market Size Estimates and Forecasts to 2032 (USD BILLION)
7.3 Biometrics
7.3.1 Biometrics Market Trends Analysis (2020-2032)
7.3.2 Biometrics Market Size Estimates and Forecasts to 2032 (USD BILLION)
8. E-passport Market Segmentation, By Application
8.1 Chapter Overview
8.2 Business Travel
8.2.1 Business Travel Market Trends Analysis (2020-2032)
8.2.2 Business Travel Market Size Estimates and Forecasts to 2032 (USD BILLION)
8.3 Leisure Travel
8.3.1 Leisure Travel Market Trends Analysis (2020-2032)
8.3.2 Leisure Travel Market Size Estimates and Forecasts to 2032 (USD BILLION)
9. Regional Analysis
9.1 Chapter Overview
9.2 North America
9.2.1 Trends Analysis
9.2.2 North America E-passport Market Estimates and Forecasts, by Country (2020-2032) (USD BILLION)
9.2.3 North America E-passport Market Estimates and Forecasts, By Technology (2020-2032) (USD BILLION)
9.2.4 North America E-passport Market Estimates and Forecasts, By Application (2020-2032) (USD BILLION)
9.2.5 USA
9.2.5.1 USA E-passport Market Estimates and Forecasts, By Technology (2020-2032) (USD BILLION)
9.2.5.2 USA E-passport Market Estimates and Forecasts, By Application (2020-2032) (USD BILLION)
9.2.6 Canada
9.2.6.1 Canada E-passport Market Estimates and Forecasts, By Technology (2020-2032) (USD BILLION)
9.2.6.2 Canada E-passport Market Estimates and Forecasts, By Application (2020-2032) (USD BILLION)
9.2.7 Mexico
9.2.7.1 Mexico E-passport Market Estimates and Forecasts, By Technology (2020-2032) (USD BILLION)
9.2.7.2 Mexico E-passport Market Estimates and Forecasts, By Application (2020-2032) (USD BILLION)
9.3 Europe
9.3.1 Eastern Europe
9.3.1.1 Trends Analysis
9.3.1.2 Eastern Europe E-passport Market Estimates and Forecasts, by Country (2020-2032) (USD BILLION)
9.3.1.3 Eastern Europe E-passport Market Estimates and Forecasts, By Technology (2020-2032) (USD BILLION)
9.3.1.4 Eastern Europe E-passport Market Estimates and Forecasts, By Application (2020-2032) (USD BILLION)
9.3.1.5 Poland
9.3.1.5.1 Poland E-passport Market Estimates and Forecasts, By Technology (2020-2032) (USD BILLION)
9.3.1.5.2 Poland E-passport Market Estimates and Forecasts, By Application (2020-2032) (USD BILLION)
9.3.1.6 Romania
9.3.1.6.1 Romania E-passport Market Estimates and Forecasts, By Technology (2020-2032) (USD BILLION)
9.3.1.6.2 Romania E-passport Market Estimates and Forecasts, By Application (2020-2032) (USD BILLION)
9.3.1.7 Hungary
9.3.1.7.1 Hungary E-passport Market Estimates and Forecasts, By Technology (2020-2032) (USD BILLION)
9.3.1.7.2 Hungary E-passport Market Estimates and Forecasts, By Application (2020-2032) (USD BILLION)
9.3.1.8 turkey
9.3.1.8.1 Turkey E-passport Market Estimates and Forecasts, By Technology (2020-2032) (USD BILLION)
9.3.1.8.2 Turkey E-passport Market Estimates and Forecasts, By Application (2020-2032) (USD BILLION)
9.3.1.9 Rest of Eastern Europe
9.3.1.9.1 Rest of Eastern Europe E-passport Market Estimates and Forecasts, By Technology (2020-2032) (USD BILLION)
9.3.1.9.2 Rest of Eastern Europe E-passport Market Estimates and Forecasts, By Application (2020-2032) (USD BILLION)
9.3.2 Western Europe
9.3.2.1 Trends Analysis
9.3.2.2 Western Europe E-passport Market Estimates and Forecasts, by Country (2020-2032) (USD BILLION)
9.3.2.3 Western Europe E-passport Market Estimates and Forecasts, By Technology (2020-2032) (USD BILLION)
9.3.2.4 Western Europe E-passport Market Estimates and Forecasts, By Application (2020-2032) (USD BILLION)
9.3.2.5 Germany
9.3.2.5.1 Germany E-passport Market Estimates and Forecasts, By Technology (2020-2032) (USD BILLION)
9.3.2.5.2 Germany E-passport Market Estimates and Forecasts, By Application (2020-2032) (USD BILLION)
9.3.2.6 France
9.3.2.6.1 France E-passport Market Estimates and Forecasts, By Technology (2020-2032) (USD BILLION)
9.3.2.6.2 France E-passport Market Estimates and Forecasts, By Application (2020-2032) (USD BILLION)
9.3.2.7 UK
9.3.2.7.1 UK E-passport Market Estimates and Forecasts, By Technology (2020-2032) (USD BILLION)
9.3.2.7.2 UK E-passport Market Estimates and Forecasts, By Application (2020-2032) (USD BILLION)
9.3.2.8 Italy
9.3.2.8.1 Italy E-passport Market Estimates and Forecasts, By Technology (2020-2032) (USD BILLION)
9.3.2.8.2 Italy E-passport Market Estimates and Forecasts, By Application (2020-2032) (USD BILLION)
9.3.2.9 Spain
9.3.2.9.1 Spain E-passport Market Estimates and Forecasts, By Technology (2020-2032) (USD BILLION)
9.3.2.9.2 Spain E-passport Market Estimates and Forecasts, By Application (2020-2032) (USD BILLION)
9.3.2.10 Netherlands
9.3.2.10.1 Netherlands E-passport Market Estimates and Forecasts, By Technology (2020-2032) (USD BILLION)
9.3.2.10.2 Netherlands E-passport Market Estimates and Forecasts, By Application (2020-2032) (USD BILLION)
9.3.2.11 Switzerland
9.3.2.11.1 Switzerland E-passport Market Estimates and Forecasts, By Technology (2020-2032) (USD BILLION)
9.3.2.11.2 Switzerland E-passport Market Estimates and Forecasts, By Application (2020-2032) (USD BILLION)
9.3.2.12 Austria
9.3.2.12.1 Austria E-passport Market Estimates and Forecasts, By Technology (2020-2032) (USD BILLION)
9.3.2.12.2 Austria E-passport Market Estimates and Forecasts, By Application (2020-2032) (USD BILLION)
9.3.2.13 Rest of Western Europe
9.3.2.13.1 Rest of Western Europe E-passport Market Estimates and Forecasts, By Technology (2020-2032) (USD BILLION)
9.3.2.13.2 Rest of Western Europe E-passport Market Estimates and Forecasts, By Application (2020-2032) (USD BILLION)
9.4 Asia Pacific
9.4.1 Trends Analysis
9.4.2 Asia Pacific E-passport Market Estimates and Forecasts, by Country (2020-2032) (USD BILLION)
9.4.3 Asia Pacific E-passport Market Estimates and Forecasts, By Technology (2020-2032) (USD BILLION)
9.4.4 Asia Pacific E-passport Market Estimates and Forecasts, By Application (2020-2032) (USD BILLION)
9.4.5 China
9.4.5.1 China E-passport Market Estimates and Forecasts, By Technology (2020-2032) (USD BILLION)
9.4.5.2 China E-passport Market Estimates and Forecasts, By Application (2020-2032) (USD BILLION)
9.4.6 India
9.4.5.1 India E-passport Market Estimates and Forecasts, By Technology (2020-2032) (USD BILLION)
9.4.5.2 India E-passport Market Estimates and Forecasts, By Application (2020-2032) (USD BILLION)
9.4.5 Japan
9.4.5.1 Japan E-passport Market Estimates and Forecasts, By Technology (2020-2032) (USD BILLION)
9.4.5.2 Japan E-passport Market Estimates and Forecasts, By Application (2020-2032) (USD BILLION)
9.4.6 South Korea
9.4.6.1 South Korea E-passport Market Estimates and Forecasts, By Technology (2020-2032) (USD BILLION)
9.4.6.2 South Korea E-passport Market Estimates and Forecasts, By Application (2020-2032) (USD BILLION)
9.4.7 Vietnam
9.4.7.1 Vietnam E-passport Market Estimates and Forecasts, By Technology (2020-2032) (USD BILLION)
9.2.7.2 Vietnam E-passport Market Estimates and Forecasts, By Application (2020-2032) (USD BILLION)
9.4.8 Singapore
9.4.8.1 Singapore E-passport Market Estimates and Forecasts, By Technology (2020-2032) (USD BILLION)
9.4.8.2 Singapore E-passport Market Estimates and Forecasts, By Application (2020-2032) (USD BILLION)
9.4.9 Australia
9.4.9.1 Australia E-passport Market Estimates and Forecasts, By Technology (2020-2032) (USD BILLION)
9.4.9.2 Australia E-passport Market Estimates and Forecasts, By Application (2020-2032) (USD BILLION)
9.4.10 Rest of Asia Pacific
9.4.10.1 Rest of Asia Pacific E-passport Market Estimates and Forecasts, By Technology (2020-2032) (USD BILLION)
9.4.10.2 Rest of Asia Pacific E-passport Market Estimates and Forecasts, By Application (2020-2032) (USD BILLION)
9.5 Middle East and Africa
9.5.1 Middle East
9.5.1.1 Trends Analysis
9.5.1.2 Middle East E-passport Market Estimates and Forecasts, by Country (2020-2032) (USD BILLION)
9.5.1.3 Middle East E-passport Market Estimates and Forecasts, By Technology (2020-2032) (USD BILLION)
9.5.1.4 Middle East E-passport Market Estimates and Forecasts, By Application (2020-2032) (USD BILLION)
9.5.1.5 UAE
9.5.1.5.1 UAE E-passport Market Estimates and Forecasts, By Technology (2020-2032) (USD BILLION)
9.5.1.5.2 UAE E-passport Market Estimates and Forecasts, By Application (2020-2032) (USD BILLION)
9.5.1.6 Egypt
9.5.1.6.1 Egypt E-passport Market Estimates and Forecasts, By Technology (2020-2032) (USD BILLION)
9.5.1.6.2 Egypt E-passport Market Estimates and Forecasts, By Application (2020-2032) (USD BILLION)
9.5.1.7 Saudi Arabia
9.5.1.7.1 Saudi Arabia E-passport Market Estimates and Forecasts, By Technology (2020-2032) (USD BILLION)
9.5.1.7.2 Saudi Arabia E-passport Market Estimates and Forecasts, By Application (2020-2032) (USD BILLION)
9.5.1.8 Qatar
9.5.1.8.1 Qatar E-passport Market Estimates and Forecasts, By Technology (2020-2032) (USD BILLION)
9.5.1.8.2 Qatar E-passport Market Estimates and Forecasts, By Application (2020-2032) (USD BILLION)
9.5.1.9 Rest of Middle East
9.5.1.9.1 Rest of Middle East E-passport Market Estimates and Forecasts, By Technology (2020-2032) (USD BILLION)
9.5.1.9.2 Rest of Middle East E-passport Market Estimates and Forecasts, By Application (2020-2032) (USD BILLION)
9.5.2 Africa
9.5.2.1 Trends Analysis
9.5.2.2 Africa E-passport Market Estimates and Forecasts, by Country (2020-2032) (USD BILLION)
9.5.2.3 Africa E-passport Market Estimates and Forecasts, By Technology (2020-2032) (USD BILLION)
9.5.2.4 Africa E-passport Market Estimates and Forecasts, By Application (2020-2032) (USD BILLION)
9.5.2.5 South Africa
9.5.2.5.1 South Africa E-passport Market Estimates and Forecasts, By Technology (2020-2032) (USD BILLION)
9.5.2.5.2 South Africa E-passport Market Estimates and Forecasts, By Application (2020-2032) (USD BILLION)
9.5.2.6 Nigeria
9.5.2.6.1 Nigeria E-passport Market Estimates and Forecasts, By Technology (2020-2032) (USD BILLION)
9.5.2.6.2 Nigeria E-passport Market Estimates and Forecasts, By Application (2020-2032) (USD BILLION)
9.5.2.7 Rest of Africa
9.5.2.7.1 Rest of Africa E-passport Market Estimates and Forecasts, By Technology (2020-2032) (USD BILLION)
9.5.2.7.2 Rest of Africa E-passport Market Estimates and Forecasts, By Application (2020-2032) (USD BILLION)
9.6 Latin America
9.6.1 Trends Analysis
9.6.2 Latin America E-passport Market Estimates and Forecasts, by Country (2020-2032) (USD BILLION)
9.6.3 Latin America E-passport Market Estimates and Forecasts, By Technology (2020-2032) (USD BILLION)
9.6.4 Latin America E-passport Market Estimates and Forecasts, By Application (2020-2032) (USD BILLION)
9.6.5 Brazil
9.6.5.1 Brazil E-passport Market Estimates and Forecasts, By Technology (2020-2032) (USD BILLION)
9.6.5.2 Brazil E-passport Market Estimates and Forecasts, By Application (2020-2032) (USD BILLION)
9.6.6 Argentina
9.6.6.1 Argentina E-passport Market Estimates and Forecasts, By Technology (2020-2032) (USD BILLION)
9.6.6.2 Argentina E-passport Market Estimates and Forecasts, By Application (2020-2032) (USD BILLION)
9.6.7 Colombia
9.6.7.1 Colombia E-passport Market Estimates and Forecasts, By Technology (2020-2032) (USD BILLION)
9.6.7.2 Colombia E-passport Market Estimates and Forecasts, By Application (2020-2032) (USD BILLION)
9.6.8 Rest of Latin America
9.6.8.1 Rest of Latin America E-passport Market Estimates and Forecasts, By Technology (2020-2032) (USD BILLION)
9.6.8.2 Rest of Latin America E-passport Market Estimates and Forecasts, By Application (2020-2032) (USD BILLION)
10. Company Profiles
10.1 Gemalto (Thales Group)
10.1.1 Company Overview
10.1.2 Financial
10.1.3 Products/ Services Offered
110.1.4 SWOT Analysis
10.2 IDEMIA
10.2.1 Company Overview
10.2.2 Financial
10.2.3 Products/ Services Offered
10.2.4 SWOT Analysis
10.3 Bundesdruckerei GmbH.
10.3.1 Company Overview
10.3.2 Financial
10.3.3 Products/ Services Offered
10.3.4 SWOT Analysis
10.4 Mühlbauer Group
10.4.1 Company Overview
10.4.2 Financial
10.4.3 Products/ Services Offered
10.4.4 SWOT Analysis
10.5 De La Rue plc
10.5.1 Company Overview
10.5.2 Financial
10.5.3 Products/ Services Offered
10.5.4 SWOT Analysis
10.6 Veridos GmbH.
10.6.1 Company Overview
10.6.2 Financial
10.6.3 Products/ Services Offered
10.6.4 SWOT Analysis
10.7 Oberthur Technologies (Idemia Group)
10.7.1 Company Overview
10.7.2 Financial
10.7.3 Products/ Services Offered
10.7.4 SWOT Analysis
10.8 IDEX ASA
10.8.1 Company Overview
10.8.2 Financial
10.8.3 Products/ Services Offered
10.8.4 SWOT Analysis
10.9 Mühlbauer Holding AG
10.9.1 Company Overview
10.9.2 Financial
10.9.3 Products/ Services Offered
10.9.4 SWOT Analysis
10.10 Shanghai Mite Speciality & Precision Printing
10.9.1 Company Overview
10.9.2 Financial
10.9.3 Products/ Services Offered
10.9.4 SWOT Analysis
11. Use Cases and Best Practices
12. Conclusion
An accurate research report requires proper strategizing as well as implementation. There are multiple factors involved in the completion of good and accurate research report and selecting the best methodology to compete the research is the toughest part. Since the research reports we provide play a crucial role in any company’s decision-making process, therefore we at SNS Insider always believe that we should choose the best method which gives us results closer to reality. This allows us to reach at a stage wherein we can provide our clients best and accurate investment to output ratio.
Each report that we prepare takes a timeframe of 350-400 business hours for production. Starting from the selection of titles through a couple of in-depth brain storming session to the final QC process before uploading our titles on our website we dedicate around 350 working hours. The titles are selected based on their current market cap and the foreseen CAGR and growth.
The 5 steps process:
Step 1: Secondary Research:
Secondary Research or Desk Research is as the name suggests is a research process wherein, we collect data through the readily available information. In this process we use various paid and unpaid databases which our team has access to and gather data through the same. This includes examining of listed companies’ annual reports, Journals, SEC filling etc. Apart from this our team has access to various associations across the globe across different industries. Lastly, we have exchange relationships with various university as well as individual libraries.

Step 2: Primary Research
When we talk about primary research, it is a type of study in which the researchers collect relevant data samples directly, rather than relying on previously collected data. This type of research is focused on gaining content specific facts that can be sued to solve specific problems. Since the collected data is fresh and first hand therefore it makes the study more accurate and genuine.
We at SNS Insider have divided Primary Research into 2 parts.
Part 1 wherein we interview the KOLs of major players as well as the upcoming ones across various geographic regions. This allows us to have their view over the market scenario and acts as an important tool to come closer to the accurate market numbers. As many as 45 paid and unpaid primary interviews are taken from both the demand and supply side of the industry to make sure we land at an accurate judgement and analysis of the market.
This step involves the triangulation of data wherein our team analyses the interview transcripts, online survey responses and observation of on filed participants. The below mentioned chart should give a better understanding of the part 1 of the primary interview.

Part 2: In this part of primary research the data collected via secondary research and the part 1 of the primary research is validated with the interviews from individual consultants and subject matter experts.
Consultants are those set of people who have at least 12 years of experience and expertise within the industry whereas Subject Matter Experts are those with at least 15 years of experience behind their back within the same space. The data with the help of two main processes i.e., FGDs (Focused Group Discussions) and IDs (Individual Discussions). This gives us a 3rd party nonbiased primary view of the market scenario making it a more dependable one while collation of the data pointers.
Step 3: Data Bank Validation
Once all the information is collected via primary and secondary sources, we run that information for data validation. At our intelligence centre our research heads track a lot of information related to the market which includes the quarterly reports, the daily stock prices, and other relevant information. Our data bank server gets updated every fortnight and that is how the information which we collected using our primary and secondary information is revalidated in real time.

Step 4: QA/QC Process
After all the data collection and validation our team does a final level of quality check and quality assurance to get rid of any unwanted or undesired mistakes. This might include but not limited to getting rid of the any typos, duplication of numbers or missing of any important information. The people involved in this process include technical content writers, research heads and graphics people. Once this process is completed the title gets uploader on our platform for our clients to read it.
Step 5: Final QC/QA Process:
This is the last process and comes when the client has ordered the study. In this process a final QA/QC is done before the study is emailed to the client. Since we believe in giving our clients a good experience of our research studies, therefore, to make sure that we do not lack at our end in any way humanly possible we do a final round of quality check and then dispatch the study to the client.
Key Segments:
By Technology
RFID
Biometrics
By Application
Business Travel
Leisure Travel
Request for Segment Customization as per your Business Requirement: Segment Customization Request
REGIONAL COVERAGE:
North America
US
Canada
Mexico
Europe
Eastern Europe
Poland
Romania
Hungary
Turkey
Rest of Eastern Europe
Western Europe
Germany
France
UK
Italy
Spain
Netherlands
Switzerland
Austria
Rest of Western Europe
Asia Pacific
China
India
Japan
South Korea
Vietnam
Singapore
Australia
Rest of Asia Pacific
Middle East & Africa
Middle East
UAE
Egypt
Saudi Arabia
Qatar
Rest of the Middle East
Africa
Nigeria
South Africa
Rest of Africa
Latin America
Brazil
Argentina
Colombia
Rest of Latin America
Request for Country Level Research Report: Country Level Customization Request
Available Customization
With the given market data, SNS Insider offers customization as per the company’s specific needs. The following customization options are available for the report:
Product Analysis
Criss-Cross segment analysis (e.g. Product X Application)
Product Matrix which gives a detailed comparison of the product portfolio of each company
Geographic Analysis
Additional countries in any of the regions
Company Information
Detailed analysis and profiling of additional market players (Up to five)
The Deception Technology Market was valued at USD 2.0 Billion in 2023 and is expected to reach USD 6.6 Billion by 2032, growing at a CAGR of 13.72% from 2024-2032.
The Hedge Fund Market was valued at USD 5.1 trillion in 2024 and is expected to reach USD 7.0 trillion by 2032, growing at a CAGR of 3.90% from 2025-2032.
The Cybersecurity Mesh Market Size was valued at USD 2.68 Billion in 2023 and will reach USD 6.63 Billion by 2032 and grow at a CAGR of 10.7% by 2032.
The Mobile Application Market Size was valued at USD 245.71 Billion in 2023 and is expected to reach USD 813.07 Billion by 2032 and grow at a CAGR of 14.3% over the forecast period 2024-2032.
Metadata Management Tools Market was valued at USD 9.31 billion in 2023 and is expected to reach USD 47.87 billion by 2032, growing at a CAGR of 20.04% from 2024-2032.
The Cloud Applications Market was valued at USD 468.9 Billion in 2023 and will reach USD 2230.4 Billion by 2032, growing at a CAGR of 18.94% by 2032.

Hi! Click one of our member below to chat on Phone
© 2025 All Rights Reserved by SNS Insider Pvt Ltd


