image

E-Commerce Market Report Scope & Overview:

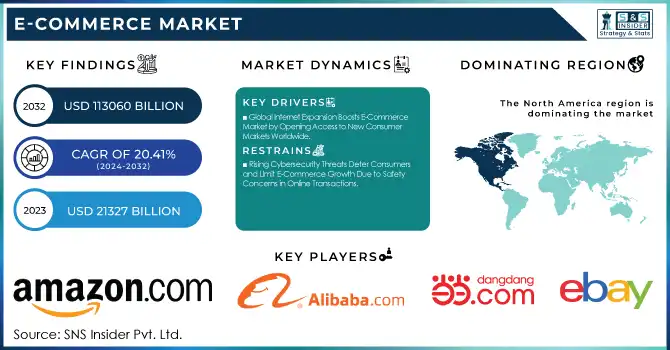
The E-Commerce Market was valued at USD 21,327 billion in 2023 and is expected to reach USD 113,060 billion by 2032, growing at a CAGR of 20.41% from 2024-2032. This report includes an in-depth analysis of consumer demographics, shopping trends, payment preferences, and e-commerce security trends. The market is driven by increasing digital adoption, shifting consumer behaviors, and advancements in secure payment methods. As the demand for seamless, personalized shopping experiences rises, businesses must adapt to these evolving preferences while ensuring robust security measures to build consumer trust and foster long-term growth.

E-Commerce Market Revenue Analysis

To get more information on E-Commerce Market - Request Free Sample Report

E-Commerce Market Dynamics

Drivers

  • Global Internet Expansion Boosts E-Commerce Market by Opening Access to New Consumer Markets Worldwide

The rapid increase in global internet access plays a crucial role in the expansion of the e-commerce market. As more people around the world come online, a vast new customer base emerges, leading to greater opportunities for businesses to tap into previously underserved regions. The expansion of mobile internet access, especially in developing countries, has been a key factor in driving online shopping. With broader connectivity, consumers now have the ability to shop from anywhere at any time, breaking down geographical barriers. This trend is particularly evident in emerging markets where traditional retail infrastructure is limited, giving e-commerce platforms a significant edge in capturing new customers and expanding their reach across diverse regions.

Restraints

  • Rising Cybersecurity Threats Deter Consumers and Limit E-Commerce Growth Due to Safety Concerns in Online Transactions

This new trend in hacking and breach of data has had a toll on the e-commerce market as users are becoming more cautious of their online transactions. These users have increasingly become more conscious of fraud, greatly depriving the platform of potential customers who do not trust the system. Hackers toward their intended e-commerce sites usually target the domains lacking appropriate security mechanisms to compromise the sites and the user information therein. These security breaches may lead to exposure of confidential information, hence losing trust and resulting in reputational loss. Moreover, the continuing requirement for companies to alter their security controls increases the cost of business. This emerging issue of cybersecurity weaknesses is one significant factor that discourages potential customers and limits the growth of the e-commerce industry.

Opportunities

  • Artificial Intelligence Enhances Personalization, Boosting Customer Engagement and Driving E-Commerce Growth Through Tailored Shopping Experiences

The application of artificial intelligence in e-commerce is revolutionizing the shopping experience, providing significant potential for growth. By harnessing AI, businesses can offer personalized product recommendations, tailored advertisements, and dynamic pricing models that resonate with individual consumers' preferences. AI-driven algorithms analyze customer behavior and purchasing patterns, enabling e-commerce platforms to predict needs and optimize offerings in real-time. This level of personalization not only boosts customer satisfaction but also enhances engagement, leading to higher conversion rates and repeat purchases. Additionally, AI enables businesses to streamline operations, optimize supply chains, and provide proactive customer service, further elevating the overall shopping experience. As consumers increasingly demand customized solutions, businesses that incorporate AI will have a distinct competitive advantage in the market.

Challenges

  • Increasing Competition in E-Commerce Makes Differentiation and Customer Retention Challenging for Smaller Businesses in Saturated Markets

As more businesses enter the e-commerce space, standing out in a highly saturated market becomes increasingly difficult. This growing competition places pressure on companies, particularly smaller players, to differentiate themselves. With a vast number of online retailers offering similar products, it is challenging to capture and maintain consumer attention. E-commerce businesses must invest in effective branding, innovative marketing strategies, and unique value propositions to rise above the competition. Also, customer acquisition costs rise when more companies fight for the same target base. Small companies with fewer resources are unable to match larger companies' ability to pay for high-end advertising and operational efficiencies, thus finding it increasingly difficult to capture a large market share.

E-Commerce Market Segment Analysis

By Product

The home appliances segment led the e-commerce market with a significant revenue share of approximately 31% in 2023 due to the increasing consumer preference for convenience and online shopping. The rise in demand for smart home appliances and advancements in technology have fueled online purchases. Additionally, frequent discounts, easy comparison of products, and doorstep delivery options have further boosted consumer spending in this category.

The fashion products segment is poised to grow at the fastest CAGR of about 22.56% from 2024 to 2032, driven by the growing trend of online shopping for clothing and accessories. The convenience of browsing a wide variety of styles, easy returns, and personalized shopping experiences offered by e-commerce platforms are attracting more consumers. Social media influencers and targeted advertising also play a key role in driving fashion-related sales

By Model Type

The B2B segment dominated the e-commerce market with a substantial revenue share of approximately 69% in 2023, driven by large-scale transactions between businesses. Companies are increasingly turning to digital platforms for procurement and supply chain management, as these platforms offer cost efficiencies, streamlined processes, and access to a global network of suppliers. B2B e-commerce also benefits from bulk orders and long-term contracts, ensuring consistent growth.

The B2C segment is expected to grow at the fastest CAGR of about 22.82% from 2024 to 2032 due to the increasing shift towards online shopping among consumers. The convenience of browsing products, secure payment methods, and home delivery options have made e-commerce the preferred shopping choice. Furthermore, the rise of mobile commerce and digital marketing strategies has accelerated consumer adoption, fueling robust growth in this segment.

Regional Analysis

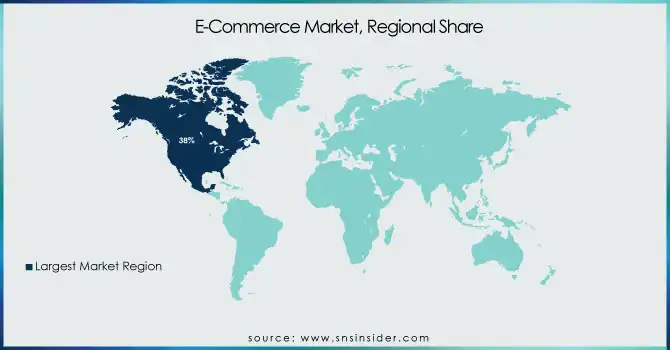
North America dominated the e-commerce market with the highest revenue share of about 38% in 2023 due to the region's advanced digital infrastructure and high internet penetration. Consumers in North America have embraced online shopping due to its convenience, variety, and the availability of secure payment methods. The presence of major e-commerce players like Amazon and Walmart, along with robust logistics networks, has further solidified North America's leadership in the global e-commerce market.

The B2C segment is expected to grow at the fastest CAGR of about 22.27% from 2024 to 2032, driven by the continued shift toward online shopping among consumers worldwide. The convenience of browsing products, competitive pricing, personalized shopping experiences, and quick delivery options are key factors contributing to this growth. The widespread adoption of mobile devices and social media platforms also enhances the accessibility and reach of B2C businesses, further accelerating market expansion.

E-Commerce-Market-Regional-Share

Get Customized Report as per Your Business Requirement - Enquiry Now

Key Players

  • Amazon.com, Inc. (Echo Dot, Fire TV Stick)

  • Alibaba.com (Wholesale Electronics, Clothing)

  • ASOS (Men’s Hoodies, Women’s Dresses)

  • Costco Wholesale Corporation (Kirkland Signature Vitamins, Office Furniture)

  • Dangdang (Books, Electronics)

  • eBay Inc. (Smartphones, Vintage Clothing)

  • Flipkart.com (Smartphones, Laptops)

  • JD.com (Home Appliances, Smartphones)

  • Lazada (Electronics, Beauty Products)

  • MercadoLibre S.R.L. (Smartphones, Furniture)

  • Shopify (Website Builder, Payment Solutions)

  • Shopee (Toys, Home Decor)

  • Walmart (Groceries, Clothing)

  • Wayfair LLC (Furniture, Home Goods)

  • Zalando (Shoes, Clothing)

  • Ebates Performance Marketing Inc. (Cashback Offers, Coupons)

  • Best Buy Co. Inc. (Laptops, Cameras)

  • Groupon Inc. (Travel Deals, Local Services)

  • Inter IKEA Systems B.V. (Furniture, Home Accessories)

  • Otto GmbH & Co. KG (Clothing, Electronics)

  • Lojas Americanas S.A. (Books, Electronics)

  • Priceline.com LLC (Hotel Deals, Car Rentals)

  • BigCommerce (E-commerce Solutions, Website Templates)

  • SHEIN (Women’s Fashion, Accessories)

  • Carrefour (Groceries, Household Items)

  • Ocado (Grocery Delivery, Household Goods)

Recent Developments:

  • In February 2025, JD.com entered China's competitive food delivery market with JD Takeaway, inviting restaurants to join its platform with a commission-free offer for the first year. This move aims to challenge market leaders Meituan and Eleme while leveraging JD.com's extensive logistics network.

  • In May 2024, Reliance Retail announced a strategic partnership with ASOS to introduce the UK-based fashion retailer’s curated portfolio to India. The collaboration aims to offer ASOS's fashion labels through a multi-channel presence, including exclusive stores and online platforms.

  • In November 2024, Alibaba formed a new E-Commerce Business Group to integrate its various e-commerce platforms, such as Taobao, Tmall, and AliExpress. This restructuring aims to create synergies across global supply chains, enhance market access for small businesses, and leverage AI to drive growth and improve efficiency.

E-commerce Market Report Scope:

Report Attributes Details
Market Size in 2023 USD 21,327 Billion
Market Size by 2032 USD 113,060 Billion
CAGR CAGR of 20.41% From 2024 to 2032
Base Year 2023
Forecast Period 2024-2032
Historical Data 2020-2022
Report Scope & Coverage Market Size, Segments Analysis, Competitive  Landscape, Regional Analysis, DROC & SWOT Analysis, Forecast Outlook
Key Segments • By Type (Business To Business (B2B), Business To Consumer (B2C), Consumer To Consumer (C2C))
• By Product (Home Appliances, Fashion Products, Groceries, Books, Others)
Regional Analysis/Coverage North America (US, Canada, Mexico), Europe (Eastern Europe [Poland, Romania, Hungary, Turkey, Rest of Eastern Europe] Western Europe] Germany, France, UK, Italy, Spain, Netherlands, Switzerland, Austria, Rest of Western Europe]), Asia Pacific (China, India, Japan, South Korea, Vietnam, Singapore, Australia, Rest of Asia Pacific), Middle East & Africa (Middle East [UAE, Egypt, Saudi Arabia, Qatar, Rest of Middle East], Africa [Nigeria, South Africa, Rest of Africa], Latin America (Brazil, Argentina, Colombia, Rest of Latin America)
Company Profiles Amazon.com, Inc., Alibaba.com, ASOS, Costco Wholesale Corporation, Dangdang, eBay Inc., Flipkart.com, JD.com, Lazada, MercadoLibre S.R.L., Shopify, Shopee, Walmart, Wayfair LLC, Zalando, Ebates Performance Marketing Inc., Best Buy Co. Inc., Groupon Inc., Inter IKEA Systems B.V., Otto GmbH & Co. KG, Lojas Americanas S.A., Priceline.com LLC, BigCommerce, SHEIN, Carrefour, Ocado

Frequently Asked Questions

ANS: E-Commerce Market was valued at USD 21,327 billion in 2023 and is expected to reach USD 113,060 billion by 2032, growing at a CAGR of 20.41% from 2024-2032.

ANS: The home appliances segment led with about 31% of the market share in 2023.

ANS: The B2C segment is expected to grow at a CAGR of 22.82%, driven by increased online shopping and mobile commerce.

ANS: Increasing competition makes differentiation and customer retention difficult for smaller businesses.

ANS: North America dominated with a 38% revenue share in 2023.

Table of Content

1. Introduction

1.1 Market Definition

1.2 Scope (Inclusion and Exclusions)

1.3 Research Assumptions

2. Executive Summary

2.1 Market Overview

2.2 Regional Synopsis

2.3 Competitive Summary

3. Research Methodology

3.1 Top-Down Approach

3.2 Bottom-up Approach

3.3. Data Validation

3.4 Primary Interviews

4. Market Dynamics Impact Analysis

4.1 Market Driving Factors Analysis

4.1.2 Drivers

4.1.2 Restraints

4.1.3 Opportunities

4.1.4 Challenges

4.2 PESTLE Analysis

4.3 Porter’s Five Forces Model

5. Statistical Insights and Trends Reporting

5.1 Consumer Demographics

5.2 Shopping Trends

5.3 Payment Preferences

5.4 E-Commerce Security Trends

6. Competitive Landscape

6.1 List of Major Companies, By Region

6.2 Market Share Analysis, By Region

6.3 Product Benchmarking

6.3.1 Product specifications and features

6.3.2 Pricing

6.4 Strategic Initiatives

6.4.1 Marketing and promotional activities

6.4.2 Distribution and supply chain strategies

6.4.3 Expansion plans and new product launches

6.4.4 Strategic partnerships and collaborations

6.5 Technological Advancements

6.6 Market Positioning and Branding

7. E-Commerce Market Segmentation, By Model Type

7.1 Chapter Overview

7.2 Business To Business (B2B)

7.2.1 Business To Business (B2B) Market Trends Analysis (2020-2032)

7.2.2 Business To Business (B2B) Market Size Estimates and Forecasts to 2032 (USD Billion)

7.3 Business To Consumer (B2C)

7.3.1 Business To Consumer (B2C) Market Trends Analysis (2020-2032)

7.3.2 Business To Consumer (B2C) Market Size Estimates and Forecasts to 2032 (USD Billion)

7.4 Consumer To Consumer (C2C)

7.4.1 Consumer To Consumer (C2C) Market Trends Analysis (2020-2032)

7.4.2 Consumer To Consumer (C2C) Market Size Estimates and Forecasts to 2032 (USD Billion)

8. E-Commerce Market Segmentation, By Product

8.1 Chapter Overview

8.2 Home Appliances

8.2.1 Home Appliances Market Trends Analysis (2020-2032)

8.2.2 Home Appliances Market Size Estimates and Forecasts to 2032 (USD Billion)

8.3 Fashion Products

8.3.1 Fashion Products Market Trends Analysis (2020-2032)

8.3.2 Fashion Products Market Size Estimates and Forecasts to 2032 (USD Billion)

8.4 Groceries

8.4.1 Groceries Market Trends Analysis (2020-2032)

8.4.2 Groceries Market Size Estimates and Forecasts to 2032 (USD Billion)

8.5 Books

8.5.1 Books Market Trends Analysis (2020-2032)

8.5.2 Books Market Size Estimates and Forecasts to 2032 (USD Billion)

8.6 Others

8.6.1 Others Market Trends Analysis (2020-2032)

8.6.2 Others Market Size Estimates and Forecasts to 2032 (USD Billion)

9. Regional Analysis

9.1 Chapter Overview

9.2 North America

9.2.1 Trends Analysis

9.2.2 North America E-Commerce Market Estimates and Forecasts, by Country (2020-2032) (USD Billion)

9.2.3 North America E-Commerce Market Estimates and Forecasts, By Model Type (2020-2032) (USD Billion) 

9.2.4 North America E-Commerce Market Estimates and Forecasts, By Product (2020-2032) (USD Billion)

9.2.5 USA

9.2.5.1 USA E-Commerce Market Estimates and Forecasts, By Model Type (2020-2032) (USD Billion)

9.2.5.2 USA E-Commerce Market Estimates and Forecasts, By Product (2020-2032) (USD Billion)

9.2.6 Canada

9.2.6.1 Canada E-Commerce Market Estimates and Forecasts, By Model Type (2020-2032) (USD Billion)

9.2.6.2 Canada E-Commerce Market Estimates and Forecasts, By Product (2020-2032) (USD Billion)

9.2.7 Mexico

9.2.7.1 Mexico E-Commerce Market Estimates and Forecasts, By Model Type (2020-2032) (USD Billion)

9.2.7.2 Mexico E-Commerce Market Estimates and Forecasts, By Product (2020-2032) (USD Billion)

9.3 Europe

9.3.1 Eastern Europe

9.3.1.1 Trends Analysis

9.3.1.2 Eastern Europe E-Commerce Market Estimates and Forecasts, by Country (2020-2032) (USD Billion)

9.3.1.3 Eastern Europe E-Commerce Market Estimates and Forecasts, By Model Type (2020-2032) (USD Billion) 

9.3.1.4 Eastern Europe E-Commerce Market Estimates and Forecasts, By Product (2020-2032) (USD Billion)

9.3.1.5 Poland

9.3.1.5.1 Poland E-Commerce Market Estimates and Forecasts, By Model Type (2020-2032) (USD Billion)

9.3.1.5.2 Poland E-Commerce Market Estimates and Forecasts, By Product (2020-2032) (USD Billion)

9.3.1.6 Romania

9.3.1.6.1 Romania E-Commerce Market Estimates and Forecasts, By Model Type (2020-2032) (USD Billion)

9.3.1.6.2 Romania E-Commerce Market Estimates and Forecasts, By Product (2020-2032) (USD Billion)

9.3.1.7 Hungary

9.3.1.7.1 Hungary E-Commerce Market Estimates and Forecasts, By Model Type (2020-2032) (USD Billion)

9.3.1.7.2 Hungary E-Commerce Market Estimates and Forecasts, By Product (2020-2032) (USD Billion)

9.3.1.8 Turkey

9.3.1.8.1 Turkey E-Commerce Market Estimates and Forecasts, By Model Type (2020-2032) (USD Billion)

9.3.1.8.2 Turkey E-Commerce Market Estimates and Forecasts, By Product (2020-2032) (USD Billion)

9.3.1.9 Rest of Eastern Europe

9.3.1.9.1 Rest of Eastern Europe E-Commerce Market Estimates and Forecasts, By Model Type (2020-2032) (USD Billion)

9.3.1.9.2 Rest of Eastern Europe E-Commerce Market Estimates and Forecasts, By Product (2020-2032) (USD Billion)

9.3.2 Western Europe

9.3.2.1 Trends Analysis

9.3.2.2 Western Europe E-Commerce Market Estimates and Forecasts, by Country (2020-2032) (USD Billion)

9.3.2.3 Western Europe E-Commerce Market Estimates and Forecasts, By Model Type (2020-2032) (USD Billion) 

9.3.2.4 Western Europe E-Commerce Market Estimates and Forecasts, By Product (2020-2032) (USD Billion)

9.3.2.5 Germany

9.3.2.5.1 Germany E-Commerce Market Estimates and Forecasts, By Model Type (2020-2032) (USD Billion)

9.3.2.5.2 Germany E-Commerce Market Estimates and Forecasts, By Product (2020-2032) (USD Billion)

9.3.2.6 France

9.3.2.6.1 France E-Commerce Market Estimates and Forecasts, By Model Type (2020-2032) (USD Billion)

9.3.2.6.2 France E-Commerce Market Estimates and Forecasts, By Product (2020-2032) (USD Billion)

9.3.2.7 UK

9.3.2.7.1 UK E-Commerce Market Estimates and Forecasts, By Model Type (2020-2032) (USD Billion)

9.3.2.7.2 UK E-Commerce Market Estimates and Forecasts, By Product (2020-2032) (USD Billion)

9.3.2.8 Italy

9.3.2.8.1 Italy E-Commerce Market Estimates and Forecasts, By Model Type (2020-2032) (USD Billion)

9.3.2.8.2 Italy E-Commerce Market Estimates and Forecasts, By Product (2020-2032) (USD Billion)

9.3.2.9 Spain

9.3.2.9.1 Spain E-Commerce Market Estimates and Forecasts, By Model Type (2020-2032) (USD Billion)

9.3.2.9.2 Spain E-Commerce Market Estimates and Forecasts, By Product (2020-2032) (USD Billion)

9.3.2.10 Netherlands

9.3.2.10.1 Netherlands E-Commerce Market Estimates and Forecasts, By Model Type (2020-2032) (USD Billion)

9.3.2.10.2 Netherlands E-Commerce Market Estimates and Forecasts, By Product (2020-2032) (USD Billion)

9.3.2.11 Switzerland

9.3.2.11.1 Switzerland E-Commerce Market Estimates and Forecasts, By Model Type (2020-2032) (USD Billion)

9.3.2.11.2 Switzerland E-Commerce Market Estimates and Forecasts, By Product (2020-2032) (USD Billion)

9.3.2.12 Austria

9.3.2.12.1 Austria E-Commerce Market Estimates and Forecasts, By Model Type (2020-2032) (USD Billion)

9.3.2.12.2 Austria E-Commerce Market Estimates and Forecasts, By Product (2020-2032) (USD Billion)

9.3.2.13 Rest of Western Europe

9.3.2.13.1 Rest of Western Europe E-Commerce Market Estimates and Forecasts, By Model Type (2020-2032) (USD Billion)

9.3.2.13.2 Rest of Western Europe E-Commerce Market Estimates and Forecasts, By Product (2020-2032) (USD Billion)

9.4 Asia Pacific

9.4.1 Trends Analysis

9.4.2 Asia Pacific E-Commerce Market Estimates and Forecasts, by Country (2020-2032) (USD Billion)

9.4.3 Asia Pacific E-Commerce Market Estimates and Forecasts, By Model Type (2020-2032) (USD Billion) 

9.4.4 Asia Pacific E-Commerce Market Estimates and Forecasts, By Product (2020-2032) (USD Billion)

9.4.5 China

9.4.5.1 China E-Commerce Market Estimates and Forecasts, By Model Type (2020-2032) (USD Billion)

9.4.5.2 China E-Commerce Market Estimates and Forecasts, By Product (2020-2032) (USD Billion)

9.4.6 India

9.4.5.1 India E-Commerce Market Estimates and Forecasts, By Model Type (2020-2032) (USD Billion)

9.4.5.2 India E-Commerce Market Estimates and Forecasts, By Product (2020-2032) (USD Billion)

9.4.5 Japan

9.4.5.1 Japan E-Commerce Market Estimates and Forecasts, By Model Type (2020-2032) (USD Billion)

9.4.5.2 Japan E-Commerce Market Estimates and Forecasts, By Product (2020-2032) (USD Billion)

9.4.6 South Korea

9.4.6.1 South Korea E-Commerce Market Estimates and Forecasts, By Model Type (2020-2032) (USD Billion)

9.4.6.2 South Korea E-Commerce Market Estimates and Forecasts, By Product (2020-2032) (USD Billion)

9.4.7 Vietnam

9.4.7.1 Vietnam E-Commerce Market Estimates and Forecasts, By Model Type (2020-2032) (USD Billion)

9.2.7.2 Vietnam E-Commerce Market Estimates and Forecasts, By Product (2020-2032) (USD Billion)

9.4.8 Singapore

9.4.8.1 Singapore E-Commerce Market Estimates and Forecasts, By Model Type (2020-2032) (USD Billion)

9.4.8.2 Singapore E-Commerce Market Estimates and Forecasts, By Product (2020-2032) (USD Billion)

9.4.9 Australia

9.4.9.1 Australia E-Commerce Market Estimates and Forecasts, By Model Type (2020-2032) (USD Billion)

9.4.9.2 Australia E-Commerce Market Estimates and Forecasts, By Product (2020-2032) (USD Billion)

9.4.10 Rest of Asia Pacific

9.4.10.1 Rest of Asia Pacific E-Commerce Market Estimates and Forecasts, By Model Type (2020-2032) (USD Billion)

9.4.10.2 Rest of Asia Pacific E-Commerce Market Estimates and Forecasts, By Product (2020-2032) (USD Billion)

9.5 Middle East and Africa

9.5.1 Middle East

9.5.1.1 Trends Analysis

9.5.1.2 Middle East E-Commerce Market Estimates and Forecasts, by Country (2020-2032) (USD Billion)

9.5.1.3 Middle East E-Commerce Market Estimates and Forecasts, By Model Type (2020-2032) (USD Billion) 

9.5.1.4 Middle East E-Commerce Market Estimates and Forecasts, By Product (2020-2032) (USD Billion)

9.5.1.5 UAE

9.5.1.5.1 UAE E-Commerce Market Estimates and Forecasts, By Model Type (2020-2032) (USD Billion)

9.5.1.5.2 UAE E-Commerce Market Estimates and Forecasts, By Product (2020-2032) (USD Billion)

9.5.1.6 Egypt

9.5.1.6.1 Egypt E-Commerce Market Estimates and Forecasts, By Model Type (2020-2032) (USD Billion)

9.5.1.6.2 Egypt E-Commerce Market Estimates and Forecasts, By Product (2020-2032) (USD Billion)

9.5.1.7 Saudi Arabia

9.5.1.7.1 Saudi Arabia E-Commerce Market Estimates and Forecasts, By Model Type (2020-2032) (USD Billion)

9.5.1.7.2 Saudi Arabia E-Commerce Market Estimates and Forecasts, By Product (2020-2032) (USD Billion)

9.5.1.8 Qatar

9.5.1.8.1 Qatar E-Commerce Market Estimates and Forecasts, By Model Type (2020-2032) (USD Billion)

9.5.1.8.2 Qatar E-Commerce Market Estimates and Forecasts, By Product (2020-2032) (USD Billion)

9.5.1.9 Rest of Middle East

9.5.1.9.1 Rest of Middle East E-Commerce Market Estimates and Forecasts, By Model Type (2020-2032) (USD Billion)

9.5.1.9.2 Rest of Middle East E-Commerce Market Estimates and Forecasts, By Product (2020-2032) (USD Billion)

9.5.2 Africa

9.5.2.1 Trends Analysis

9.5.2.2 Africa E-Commerce Market Estimates and Forecasts, by Country (2020-2032) (USD Billion)

9.5.2.3 Africa E-Commerce Market Estimates and Forecasts, By Model Type (2020-2032) (USD Billion) 

9.5.2.4 Africa E-Commerce Market Estimates and Forecasts, By Product (2020-2032) (USD Billion)

9.5.2.5 South Africa

9.5.2.5.1 South Africa E-Commerce Market Estimates and Forecasts, By Model Type (2020-2032) (USD Billion)

9.5.2.5.2 South Africa E-Commerce Market Estimates and Forecasts, By Product (2020-2032) (USD Billion)

9.5.2.6 Nigeria

9.5.2.6.1 Nigeria E-Commerce Market Estimates and Forecasts, By Model Type (2020-2032) (USD Billion)

9.5.2.6.2 Nigeria E-Commerce Market Estimates and Forecasts, By Product (2020-2032) (USD Billion)

9.5.2.7 Rest of Africa

9.5.2.7.1 Rest of Africa E-Commerce Market Estimates and Forecasts, By Model Type (2020-2032) (USD Billion)

9.5.2.7.2 Rest of Africa E-Commerce Market Estimates and Forecasts, By Product (2020-2032) (USD Billion)

9.6 Latin America

9.6.1 Trends Analysis

9.6.2 Latin America E-Commerce Market Estimates and Forecasts, by Country (2020-2032) (USD Billion)

9.6.3 Latin America E-Commerce Market Estimates and Forecasts, By Model Type (2020-2032) (USD Billion) 

9.6.4 Latin America E-Commerce Market Estimates and Forecasts, By Product (2020-2032) (USD Billion)

9.6.5 Brazil

9.6.5.1 Brazil E-Commerce Market Estimates and Forecasts, By Model Type (2020-2032) (USD Billion)

9.6.5.2 Brazil E-Commerce Market Estimates and Forecasts, By Product (2020-2032) (USD Billion)

9.6.6 Argentina

9.6.6.1 Argentina E-Commerce Market Estimates and Forecasts, By Model Type (2020-2032) (USD Billion)

9.6.6.2 Argentina E-Commerce Market Estimates and Forecasts, By Product (2020-2032) (USD Billion)

9.6.7 Colombia

9.6.7.1 Colombia E-Commerce Market Estimates and Forecasts, By Model Type (2020-2032) (USD Billion)

9.6.7.2 Colombia E-Commerce Market Estimates and Forecasts, By Product (2020-2032) (USD Billion)

9.6.8 Rest of Latin America

9.6.8.1 Rest of Latin America E-Commerce Market Estimates and Forecasts, By Model Type (2020-2032) (USD Billion)

9.6.8.2 Rest of Latin America E-Commerce Market Estimates and Forecasts, By Product (2020-2032) (USD Billion)

10. Company Profiles

10.1 Amazon.com, Inc.

10.1.1 Company Overview

10.1.2 Financial

10.1.3 Products/ Services Offered

10.1.4 SWOT Analysis

10.2 Alibaba.com

10.2.1 Company Overview

10.2.2 Financial

10.2.3 Products/ Services Offered

10.2.4 SWOT Analysis

10.3 ASOS

10.3.1 Company Overview

10.3.2 Financial

10.3.3 Products/ Services Offered

10.3.4 SWOT Analysis

10.4 Costco Wholesale Corporation

10.4.1 Company Overview

10.4.2 Financial

10.4.3 Products/ Services Offered

10.4.4 SWOT Analysis

10.5 Dangdang

10.5.1 Company Overview

10.5.2 Financial

10.5.3 Products/ Services Offered

10.5.4 SWOT Analysis

10.6 eBay Inc.

10.6.1 Company Overview

10.6.2 Financial

10.6.3 Products/ Services Offered

10.6.4 SWOT Analysis

10.7 Flipkart.com

10.7.1 Company Overview

10.7.2 Financial

10.7.3 Products/ Services Offered

10.7.4 SWOT Analysis

10.8 JD.com

10.8.1 Company Overview

10.8.2 Financial

10.8.3 Products/ Services Offered

10.8.4 SWOT Analysis

10.9 Lazada

10.9.1 Company Overview

10.9.2 Financial

10.9.3 Products/ Services Offered

10.9.4 SWOT Analysis

10.10 MercadoLibre S.R.L.

10.10.1 Company Overview

10.10.2 Financial

10.10.3 Products/ Services Offered

10.10.4 SWOT Analysis

11. Use Cases and Best Practices

12. Conclusion

An accurate research report requires proper strategizing as well as implementation. There are multiple factors involved in the completion of good and accurate research report and selecting the best methodology to compete the research is the toughest part. Since the research reports we provide play a crucial role in any company’s decision-making process, therefore we at SNS Insider always believe that we should choose the best method which gives us results closer to reality. This allows us to reach at a stage wherein we can provide our clients best and accurate investment to output ratio.

Each report that we prepare takes a timeframe of 350-400 business hours for production. Starting from the selection of titles through a couple of in-depth brain storming session to the final QC process before uploading our titles on our website we dedicate around 350 working hours. The titles are selected based on their current market cap and the foreseen CAGR and growth.


The 5 steps process:

Step 1: Secondary Research:

Secondary Research or Desk Research is as the name suggests is a research process wherein, we collect data through the readily available information. In this process we use various paid and unpaid databases which our team has access to and gather data through the same. This includes examining of listed companies’ annual reports, Journals, SEC filling etc. Apart from this our team has access to various associations across the globe across different industries. Lastly, we have exchange relationships with various university as well as individual libraries.

Secondary Research

Step 2: Primary Research

When we talk about primary research, it is a type of study in which the researchers collect relevant data samples directly, rather than relying on previously collected data.  This type of research is focused on gaining content specific facts that can be sued to solve specific problems. Since the collected data is fresh and first hand therefore it makes the study more accurate and genuine.

We at SNS Insider have divided Primary Research into 2 parts.

Part 1 wherein we interview the KOLs of major players as well as the upcoming ones across various geographic regions. This allows us to have their view over the market scenario and acts as an important tool to come closer to the accurate market numbers. As many as 45 paid and unpaid primary interviews are taken from both the demand and supply side of the industry to make sure we land at an accurate judgement and analysis of the market.

This step involves the triangulation of data wherein our team analyses the interview transcripts, online survey responses and observation of on filed participants. The below mentioned chart should give a better understanding of the part 1 of the primary interview.

Primary Research

Part 2: In this part of primary research the data collected via secondary research and the part 1 of the primary research is validated with the interviews from individual consultants and subject matter experts.

Consultants are those set of people who have at least 12 years of experience and expertise within the industry whereas Subject Matter Experts are those with at least 15 years of experience behind their back within the same space. The data with the help of two main processes i.e., FGDs (Focused Group Discussions) and IDs (Individual Discussions). This gives us a 3rd party nonbiased primary view of the market scenario making it a more dependable one while collation of the data pointers.

Step 3: Data Bank Validation

Once all the information is collected via primary and secondary sources, we run that information for data validation. At our intelligence centre our research heads track a lot of information related to the market which includes the quarterly reports, the daily stock prices, and other relevant information. Our data bank server gets updated every fortnight and that is how the information which we collected using our primary and secondary information is revalidated in real time.

Data Bank Validation

Step 4: QA/QC Process

After all the data collection and validation our team does a final level of quality check and quality assurance to get rid of any unwanted or undesired mistakes. This might include but not limited to getting rid of the any typos, duplication of numbers or missing of any important information. The people involved in this process include technical content writers, research heads and graphics people. Once this process is completed the title gets uploader on our platform for our clients to read it.

Step 5: Final QC/QA Process:

This is the last process and comes when the client has ordered the study. In this process a final QA/QC is done before the study is emailed to the client. Since we believe in giving our clients a good experience of our research studies, therefore, to make sure that we do not lack at our end in any way humanly possible we do a final round of quality check and then dispatch the study to the client.

Key Segments:

By Model Type

    • Business To Business (B2B)

    • Business To Consumer (B2C)

    • Consumer To Consumer (C2C)

By Product

  • Home Appliances

  • Fashion Products

  • Groceries

  • Books

  • Others

Request for Segment Customization as per your Business Requirement: Segment Customization Request

Regional Coverage:

North America

  • US

  • Canada

  • Mexico

Europe

  • Eastern Europe

    • Poland

    • Romania

    • Hungary

    • Turkey

    • Rest of Eastern Europe

  • Western Europe

    • Germany

    • France

    • UK

    • Italy

    • Spain

    • Netherlands

    • Switzerland

    • Austria

    • Rest of Western Europe

Asia Pacific

  • China

  • India

  • Japan

  • South Korea

  • Vietnam

  • Singapore

  • Australia

  • Rest of Asia Pacific

Middle East & Africa

  • Middle East

    • UAE

    • Egypt

    • Saudi Arabia

    • Qatar

    • Rest of Middle East

  • Africa

    • Nigeria

    • South Africa

    • Rest of Africa

Latin America

  • Brazil

  • Argentina

  • Colombia

  • Rest of Latin America

Request for Country Level Research Report: Country Level Customization Request

Available Customization

With the given market data, SNS Insider offers customization as per the company’s specific needs. The following customization options are available for the report:

  • Detailed Volume Analysis

  • Criss-Cross segment analysis (e.g. Product X Application)

  • Competitive Product Benchmarking

  • Geographic Analysis

  • Additional countries in any of the regions

  • Customized Data Representation

  • Detailed analysis and profiling of additional market players


  •            5000 (33% Discount)


  •            8950 (40% Discount)


  •            3050 (23% Discount)

Start a Conversation

Hi! Click one of our member below to chat on Phone