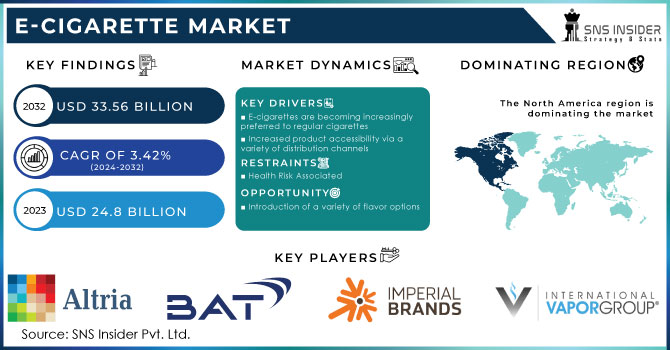
The E-Cigarette Market size was valued at USD 23.28 billion in 2023 and is expected to grow to USD 37.36 billion by 2032 and grow at a CAGR of 5.40 % over the forecast period of 2024-2032. Several trends are pushing this growth, not least of which is changing consumer attitudes, given that many conventional smokers are making the switch to e-cigarettes for reduced health risks and increased convenience. Regulatory impacts are another key player, especially with municipal governments across several regions embracing guidelines that support or limit market growth. In addition, increasing knowledge of disposal and recycling trends is impacting consumer behavior, compelling manufacturers to embrace more sustainable operations. All these points shed light on the taste of the everchanging e-cigarette market, pointing to the necessity brands have to adapt to moving consumer expectations and regulatory structures.
Get E-PDF Sample Report on E-Cigarette Market - Request Sample Report
Drivers:
Flavor Variety as a Catalyst for E-Cigarette Market Growth among Young Consumers.
Flavor variety is a pivotal driver in the e-cigarette market, particularly among younger adults seeking alternatives to traditional tobacco products. Research indicates that the diverse range of flavors significantly enhances e-cigarette appeal, with 84.9% of current users preferring flavored options, particularly fruit and candy flavors. The Centers for Disease Control and Prevention (CDC) reports that a majority of e-cigarette users are adolescents and young adults, with 2.55 million middle and high school students currently using e-cigarettes. The FDA’s 2020 ban on certain flavored products has redirected consumers towards disposable devices, which now dominate sales. Additionally, younger users are more likely to initiate vaping due to appealing flavors, believing fruit-flavored e-cigarettes are less harmful than traditional tobacco flavors. This dynamic underscores the importance of flavor innovation in the e-cigarette market while navigating regulatory challenges to align with consumer preferences.
Restraints:
Consumer confidence in the e-cigarette market is significantly impacted by growing health concerns.
Health concerns are a major constraint in the e-cigarette market, as growing awareness of possible dangers discourages people from using them. Studies emphasize adverse health effects associated with e-cigarette consumption, including nicotine dependency and pulmonary complications. "When young people are using e-cigarettes they can underestimate the addictive nature of nicotine, especially when they are taking a high dose of nicotine in the form of e-cigarette," he said. With reports of respiratory ailments and serious health events related to vaping sounding alarms among public health officials, consumer confidence has slid, too. With prospective users increasingly health and wellness-conscious, many avoid e-cigs, with concerns of addiction and respiratory risks assuredly lurking. As a result, this increased awareness puts pressure on the industry to change for the better, promoting safety and responsible advertising practices in order to restore consumer confidence and promote sustainable growth in the e-cigarette industry.
Opportunities:
Leveraging Market Growth and Consumer Trends in the E-Cigarette Market
Expanding product offerings in the e-cigarette market presents a significant opportunity to attract diverse consumer segments and adapt to changing preferences. Innovative flavors and formulations can engage various demographics, particularly younger adults seeking alternatives to traditional tobacco products. Research shows that flavor variety significantly influences e-cigarette usage, with a notable preference for fruity and dessert flavors among users. As regulations tighten, manufacturers can seize the opportunity to develop compliant products that meet consumer demands while ensuring safety and quality. Retail environments, both physical and online, serve as key advertising platforms for e-cigarettes, significantly impacting youth exposure. Data indicates that 68.6% of young adults reported past 30-day e-cigarette advertising/media exposure—most commonly seen on social media (43.4%) and at retailers (31.7%)—with e-cigarette advertising exposure associated with e-cigarette use. Moreover, young adults most frequently purchased e-cigarettes via vape shops and online, with 68% exposed to advertising at retailers and 41% online. After cigarettes, e-cigarettes are the most highly advertised tobacco product in stores.
Challenges:
Navigating Safety and Quality Challenges in the E-Cigarette Market
Due to the changing nature of regulations, ensuring product safety and quality continues to be a serious challenge for e-cigarette manufacturers. As regulatory bodies are paying more attention to consumer health, challenging compliance requirements are weighing on manufacturers' shoulders while ensuring quality products. Plus, the need to build and keep consumer trust, which is the foundation of customer loyalty and, ultimately, market success. Complaints about poor quality and unsafe products can result in negative publicity and reduced sales. It falls to manufacturers to institute rigorous quality control protocols and clear labeling practices to ensure consumers feel confident in the safety of their products. Furthermore, innovation in the industry is evolving at an unprecedented pace, forcing companies to continuously adapt their processes to comply with new regulations while safeguarding product integrity.
By Product
The rechargeable segment of the e-cigarette market has emerged as a dominant force, accounting for approximately 50% of the market share in 2023. There are various reasons for this growth, such as the increasing consumer demand for sustainability and cost-efficiency. Unlike disposable e-cigarettes, which are thrown away after use, rechargeable e-cigarettes are reusable and more cost-effective, as they enable the use of advanced battery technology and can be used many times. Moreover, such devices tend to offer better specifications, such as improved battery life and settings customization that cater to a wider audience, especially among technology enthusiasts. Increasing awareness of environmental issues has also contributed to the growth of this market, as consumers look to minimize waste generated by single-use consumer goods. As a result, this segment is likely to thrive in the following years.
The modular devices segment of the e-cigarette market is poised for rapid growth during the forecast period from 2024 to 2032. This growth is mainly driven by the growing consumer need for customization and personalization, which allows users to modify device settings and swap out components. For this reason, modular devices allow users to customize their individual vaping experience, which can lead to greater satisfaction and user engagement. In addition, as technology progresses and the performance of security features improves, these devices are increasingly available and attractive to both new and experienced vapers. This advance is projected to spur extensive market growth, making modular devices a major force in the E-Cigarette Market.
By Distribution Channel
The retail segment of the e-cigarette market is the dominant player, accounting for approximately 60% of the total market share in 2023. This substantial presence can be attributed to the widespread availability of e-cigarettes through various retail channels, including convenience stores, specialty vape shops, and online platforms. Retail environments provide consumers with immediate access to a diverse range of products, including different flavors, device types, and nicotine concentrations, catering to a broad spectrum of preferences. Furthermore, retail locations serve as significant venues for advertising, especially among younger demographics, influencing purchase decisions. As regulations evolve and marketing strategies adapt, the retail segment is likely to remain a critical driver of growth in the e-cigarette market, facilitating brand exposure and consumer engagement.
The online segment of the e-cigarette market is poised to experience rapid growth over the forecast period from 2024 to 2032. The industry has experienced this rapid growth due to the growing consumer preference for online shopping, especially among younger generations who value convenience and a broader range of product offerings. The easy availability of multiple e-cigarettes brands, flavors and devices on e-commerce platforms, along with promotional offers and deals, serves to make consumers more appetitive. And the anonymity of ordering online may encourage some who otherwise might be hesitant to buy e-cigarettes in brickand-mortar stores. Increasing internet penetration and growing number of digital payment options will continue to broaden the online segment, as it will capture a significant share in the market, thereby facilitating sales and increasing consumer engagement.
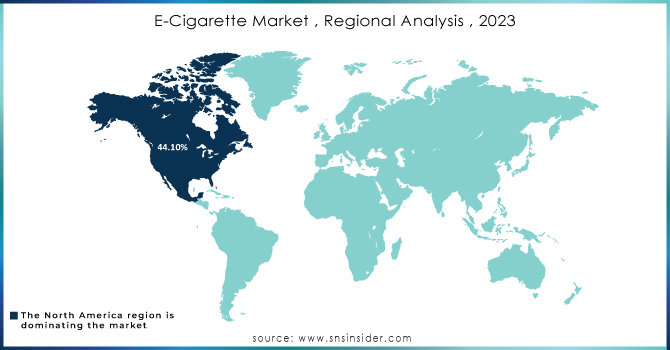
The North America region dominates the E-Cigarette Market, representing approximately 50% of total revenue in 2023. This substantial share is driven by high e-cigarette usage rates among adults, particularly among younger consumers looking for alternatives to traditional tobacco products. A well-established retail infrastructure, including a plethora of vape shops and online platforms, ensures easy access to diverse e-cigarette brands and flavors, further fueling demand. Moreover, innovations in product development, such as modular devices and unique flavor formulations, cater to evolving consumer preferences. Countries like the United States and Canada implement regulations that promote harm reduction, enhancing market growth. The U.S. stands out for its extensive advertising and marketing strategies, significantly boosting awareness and consumption. While regulatory challenges and health concerns regarding e-cigarette use pose potential obstacles, North America's adaptability to changing consumer dynamics will likely sustain its leadership position in the global e-cigarette market.
The Asia Pacific region is poised to be the fastest-growing segment in the E-Cigarette Market during the forecast period from 2024 to 2032. A few factors, such as rapid urbanization, increasing disposable incomes, and growing awareness of alternative nicotine delivery systems in consumers, are responsible for this very rapid growth. Countries such as China, Japan, and India are seeing a major shift toward e-cigarettes as a less damaging alternative to traditional smoking, especially among the youth. In addition, the growth of domestic producers and the release of novel offerings suitable to local tastes are amplifying penetration across the market. E-cigarettes are also becoming ubiquitous as a result of government efforts to curb tobacco use. Thus, the Asia Pacific region is anticipated to witness them taking off considerably in terms of product availability and consumer adoption, cementing the status of the region in the global E-Cigarette Market.
Some of the Major Players in E-Cigarette Market along with their product:
Altria Group, Inc. (USA) - (Tobacco, E-cigarettes)
British American Tobacco (UK) - (Tobacco, E-cigarettes)
Imperial Brands (UK) - (Tobacco, E-cigarettes)
International Vapor Group (USA) - (E-cigarettes)
Japan Tobacco Inc. (Japan) - (Tobacco, E-cigarettes)
NicQuid (USA) - (E-liquids)
JUUL Labs, Inc. (USA) - (E-cigarettes)
Philip Morris International Inc. (USA) - (Tobacco, E-cigarettes)
R.J. Reynolds Vapor Company (USA) - (E-cigarettes)
Shenzhen IVPS Technology Co., Ltd. (China) - (E-cigarettes)
Shenzhen KangerTech Technology Co., Ltd. (China) - (E-cigarettes)
Nicotek LLC (USA) - (E-cigarettes)
NJOY Inc. (USA) - (E-cigarettes)
Reynolds American Inc. (USA) - (Tobacco, E-cigarettes)
ITC Limited (India) - (Tobacco, E-cigarettes)
J WELL France (France) - (E-cigarettes)
List of suppliers that provide raw materials for the e-cigarette market:
Fufeng Group (China)
Dow Chemical Company (USA)
BASF SE (Germany)
Glycerin Technologies (USA)
Alpha Aromatics (USA)
Flavorah (USA)
Capella Flavors (USA)
CigaTech (China)
Pinnacle Flavors (USA)
Huangshan Tianshan Pharmaceutical Co., Ltd. (China)
On June 21, 2024, the U.S. Food and Drug Administration authorized four menthol e-cigarette products from Altria Group Inc. and NJOY Inc., marking the first flavored vapes permitted on the market. The decision indicates that vape makers can demonstrate benefits for adult smokers that outweigh risks to youth.
On November 27, 2024, Philip Morris International Inc. celebrated the 10th anniversary of its IQOS product, which has contributed to a 46% drop in smoking prevalence in Japan since its launch. With over USD10 billion in annual net revenues, IQOS is available in over 70 markets and has helped approximately 22 million adults transition away from traditional cigarettes.
Report Attributes | Details |
Market Size in 2023 | USD 23.28 Billion |
Market Size by 2032 | USD 34.36 Billion |
CAGR | CAGR of 5.40 % From 2024 to 2032 |
Base Year | 2023 |
Forecast Period | 2024-2032 |
Historical Data | 2020-2022 |
Report Scope & Coverage | Market Size, Segments Analysis, Competitive Landscape, Regional Analysis, DROC & SWOT Analysis, Forecast Outlook |
Key Segments | • By Product (Disposable, Rechargeable, Modular Devices) • By Distribution Channel (Online, Retail) |
Regional Analysis/Coverage | North America (US, Canada, Mexico), Europe (Eastern Europe [Poland, Romania, Hungary, Turkey, Rest of Eastern Europe] Western Europe] Germany, France, UK, Italy, Spain, Netherlands, Switzerland, Austria, Rest of Western Europe]), Asia Pacific (China, India, Japan, South Korea, Vietnam, Singapore, Australia, Rest of Asia Pacific), Middle East & Africa (Middle East [UAE, Egypt, Saudi Arabia, Qatar, Rest of Middle East], Africa [Nigeria, South Africa, Rest of Africa], Latin America (Brazil, Argentina, Colombia, Rest of Latin America) |
Company Profiles | Altria Group, Inc. (USA), British American Tobacco (UK), Imperial Brands (UK), International Vapor Group (USA), Japan Tobacco Inc. (Japan), NicQuid (USA), JUUL Labs, Inc. (USA), Philip Morris International Inc. (USA), R.J. Reynolds Vapor Company (USA), Shenzhen IVPS Technology Co., Ltd. (China), Shenzhen KangerTech Technology Co., Ltd. (China), Nicotek LLC (USA), NJOY Inc. (USA), Reynolds American Inc. (USA), ITC Limited (India), J WELL France (France) |
Ans: The E-Cigarette market faces restraints such as increasing regulatory challenges, health concerns over potential risks, intense competition, shifting consumer preferences, and stricter age restrictions due to rising youth use.
Ans: E-cigarettes are becoming increasingly preferred to regular cigarettes and Increased product accessibility via a variety of distribution channels
Ans: North America is dominating the E-Cigarette Market.
Ans: E-Cigarette Market size was valued at USD 23.28 Billion in 2023.
Ans: E-Cigarette Market is anticipated to expand by 5.40% from 2024 to 2032.
Table of Content
1. Introduction
1.1 Market Definition
1.2 Scope (Inclusion and Exclusions)
1.3 Research Assumptions
2. Executive Summary
2.1 Market Overview
2.2 Regional Synopsis
2.3 Competitive Summary
3. Research Methodology
3.1 Top-Down Approach
3.2 Bottom-up Approach
3.3. Data Validation
3.4 Primary Interviews
4. Market Dynamics Impact Analysis
4.1 Market Driving Factors Analysis
4.1.2 Drivers
4.1.2 Restraints
4.1.3 Opportunities
4.1.4 Challenges
4.2 PESTLE Analysis
4.3 Porter’s Five Forces Model
5. Statistical Insights and Trends Reporting
5.1 Consumer Switching Behaviour
5.2 Regulatory Impact Data
5.3 Disposal and Recycling Trends
6. Competitive Landscape
6.1 List of Major Companies, By Region
6.2 Market Share Analysis, By Region
6.3 Product Benchmarking
6.3.1 Product specifications and features
6.3.2 Pricing
6.4 Strategic Initiatives
6.4.1 Marketing and promotional activities
6.4.2 Distribution and supply chain strategies
6.4.3 Expansion plans and new product launches
6.4.4 Strategic partnerships and collaborations
6.5 Technological Advancements
6.6 Market Positioning and Branding
7. E-Cigarette Market Segmentation, by Product
7.1 Chapter Overview
7.2 Disposable
7.2.1 Disposable Market Trends Analysis (2020-2032)
7.2.2 Disposable Market Size Estimates and Forecasts to 2032 (USD Billion)
7.3 Rechargeable
7.3.1 Rechargeable Market Trends Analysis (2020-2032)
7.3.2 Rechargeable Market Size Estimates and Forecasts to 2032 (USD Billion)
7.4 Modular Devices
7.4.1 Modular Devices Market Trends Analysis (2020-2032)
7.4.2 Modular Devices Market Size Estimates and Forecasts to 2032 (USD Billion)
8. E-Cigarette Market Segmentation, by Distribution Channel
8.1 Chapter Overview
8.2 Online
8.2.1 Online Market Trends Analysis (2020-2032)
8.2.2 Online Market Size Estimates and Forecasts to 2032 (USD Billion)
8.3Retail
8.3.1Retail Market Trends Analysis (2020-2032)
8.3.2 Retail Market Size Estimates and Forecasts to 2032 (USD Billion)
8.3.3 Convenience Store
8.3.3.1 Convenience Store Market Trends Analysis (2020-2032)
8.3.3.2 Convenience Store Market Size Estimates and Forecasts to 2032 (USD Billion)
8.3.4 Drug Store
8.3.4.1 Drug Store Market Trends Analysis (2020-2032)
8.3.4.2 Drug Store Market Size Estimates and Forecasts to 2032 (USD Billion)
8.3.5 Newsstand
8.3.5.1 Newsstand Market Trends Analysis (2020-2032)
8.3.5.2 Newsstand Market Size Estimates and Forecasts to 2032 (USD Billion)
8.3.6 Tobacconist Store
8.3.6.1 Tobacconist Store Market Trends Analysis (2020-2032)
8.3.6.2 Tobacconist Store Market Size Estimates and Forecasts to 2032 (USD Billion)
8.3.7 Specialty E-cigarette Store
8.3.7.1 Specialty E-cigarette Store Market Trends Analysis (2020-2032)
8.3.7.2 Specialty E-cigarette Store Market Size Estimates and Forecasts to 2032 (USD Billion)
9. Regional Analysis
9.1 Chapter Overview
9.2 North America
9.2.1 Trends Analysis
9.2.2 North America E-Cigarette Market Estimates and Forecasts, by Country (2020-2032) (USD Billion)
9.2.3 North America E-Cigarette Market Estimates and Forecasts, by Product (2020-2032) (USD Billion)
9.2.4 North America E-Cigarette Market Estimates and Forecasts, by Distribution Channel (2020-2032) (USD Billion)
9.2.5 USA
9.2.5.1 USA E-Cigarette Market Estimates and Forecasts, by Product (2020-2032) (USD Billion)
9.2.5.2 USA E-Cigarette Market Estimates and Forecasts, by Distribution Channel (2020-2032) (USD Billion)
9.2.6 Canada
9.2.6.1 Canada E-Cigarette Market Estimates and Forecasts, by Product (2020-2032) (USD Billion)
9.2.6.2 Canada E-Cigarette Market Estimates and Forecasts, by Distribution Channel (2020-2032) (USD Billion)
9.2.7 Mexico
9.2.7.1 Mexico E-Cigarette Market Estimates and Forecasts, by Product (2020-2032) (USD Billion)
9.2.7.2 Mexico E-Cigarette Market Estimates and Forecasts, by Distribution Channel (2020-2032) (USD Billion)
9.3 Europe
9.3.1 Eastern Europe
9.3.1.1 Trends Analysis
9.3.1.2 Eastern Europe E-Cigarette Market Estimates and Forecasts, by Country (2020-2032) (USD Billion)
9.3.1.3 Eastern Europe E-Cigarette Market Estimates and Forecasts, by Product (2020-2032) (USD Billion)
9.3.1.4 Eastern Europe E-Cigarette Market Estimates and Forecasts, by Distribution Channel (2020-2032) (USD Billion)
9.3.1.5 Poland
9.3.1.5.1 Poland E-Cigarette Market Estimates and Forecasts, by Product (2020-2032) (USD Billion)
9.3.1.5.2 Poland E-Cigarette Market Estimates and Forecasts, by Distribution Channel (2020-2032) (USD Billion)
9.3.1.6 Romania
9.3.1.6.1 Romania E-Cigarette Market Estimates and Forecasts, by Product (2020-2032) (
9.3.1.6.2 Romania E-Cigarette Market Estimates and Forecasts, by Distribution Channel (2020-2032) (USD Billion)
9.3.1.7 Hungary
9.3.1.7.1 Hungary E-Cigarette Market Estimates and Forecasts, by Product (2020-2032) (USD Billion)
9.3.1.7.2 Hungary E-Cigarette Market Estimates and Forecasts, by Distribution Channel (2020-2032) (USD Billion)
9.3.1.8 Turkey
9.3.1.8.1 Turkey E-Cigarette Market Estimates and Forecasts, by Product (2020-2032) (USD Billion)
9.3.1.8.2 Turkey E-Cigarette Market Estimates and Forecasts, by Distribution Channel (2020-2032) (USD Billion)
9.3.1.9 Rest of Eastern Europe
9.3.1.9.1 Rest of Eastern Europe E-Cigarette Market Estimates and Forecasts, by Product (2020-2032) (USD Billion)
9.3.1.9.2 Rest of Eastern Europe E-Cigarette Market Estimates and Forecasts, by Distribution Channel (2020-2032) (USD Billion)
9.3.2 Western Europe
9.3.2.1 Trends Analysis
9.3.2.2 Western Europe E-Cigarette Market Estimates and Forecasts, by Country (2020-2032) (USD Billion)
9.3.2.3 Western Europe E-Cigarette Market Estimates and Forecasts, by Product (2020-2032) (USD Billion)
9.3.2.4 Western Europe E-Cigarette Market Estimates and Forecasts, by Distribution Channel (2020-2032) (USD Billion)
9.3.2.5 Germany
9.3.2.5.1 Germany E-Cigarette Market Estimates and Forecasts, by Product (2020-2032) (USD Billion)
9.3.2.5.2 Germany E-Cigarette Market Estimates and Forecasts, by Distribution Channel (2020-2032) (USD Billion)
9.3.2.6 France
9.3.2.6.1 France E-Cigarette Market Estimates and Forecasts, by Product (2020-2032) (USD Billion)
9.3.2.6.2 France E-Cigarette Market Estimates and Forecasts, by Distribution Channel (2020-2032) (USD Billion)
9.3.2.7 UK
9.3.2.7.1 UK E-Cigarette Market Estimates and Forecasts, by Product (2020-2032) (USD Billion)
9.3.2.7.2 UK E-Cigarette Market Estimates and Forecasts, by Distribution Channel (2020-2032) (USD Billion)
9.3.2.8 Italy
9.3.2.8.1 Italy E-Cigarette Market Estimates and Forecasts, by Product (2020-2032) (USD Billion)
9.3.2.8.2 Italy E-Cigarette Market Estimates and Forecasts, by Distribution Channel (2020-2032) (USD Billion)
9.3.2.9 Spain
9.3.2.9.1 Spain E-Cigarette Market Estimates and Forecasts, by Product (2020-2032) (USD Billion)
9.3.2.9.2 Spain E-Cigarette Market Estimates and Forecasts, by Distribution Channel (2020-2032) (USD Billion)
9.3.2.10 Netherlands
9.3.2.10.1 Netherlands E-Cigarette Market Estimates and Forecasts, by Product (2020-2032) (USD Billion)
9.3.2.10.2 Netherlands E-Cigarette Market Estimates and Forecasts, by Distribution Channel (2020-2032) (USD Billion)
9.3.2.11 Switzerland
9.3.2.11.1 Switzerland E-Cigarette Market Estimates and Forecasts, by Product (2020-2032) (USD Billion)
9.3.2.11.2 Switzerland E-Cigarette Market Estimates and Forecasts, by Distribution Channel (2020-2032) (USD Billion)
9.3.2.12 Austria
9.3.2.12.1 Austria E-Cigarette Market Estimates and Forecasts, by Product (2020-2032) (USD Billion)
9.3.2.12.2 Austria E-Cigarette Market Estimates and Forecasts, by Distribution Channel (2020-2032) (USD Billion)
9.3.2.13 Rest of Western Europe
9.3.2.13.1 Rest of Western Europe E-Cigarette Market Estimates and Forecasts, by Product (2020-2032) (USD Billion)
9.3.2.13.2 Rest of Western Europe E-Cigarette Market Estimates and Forecasts, by Distribution Channel (2020-2032) (USD Billion)
9.4 Asia Pacific
9.4.1 Trends Analysis
9.4.2 Asia Pacific E-Cigarette Market Estimates and Forecasts, by Country (2020-2032) (USD Billion)
9.4.3 Asia Pacific E-Cigarette Market Estimates and Forecasts, by Product (2020-2032) (USD Billion)
9.4.4 Asia Pacific E-Cigarette Market Estimates and Forecasts, by Distribution Channel (2020-2032) (USD Billion)
9.4.5 China
9.4.5.1 China E-Cigarette Market Estimates and Forecasts, by Product (2020-2032) (USD Billion)
9.4.5.2 China E-Cigarette Market Estimates and Forecasts, by Distribution Channel (2020-2032) (USD Billion)
9.4.6 India
9.4.5.1 India E-Cigarette Market Estimates and Forecasts, by Product (2020-2032) (USD Billion)
9.4.5.2 India E-Cigarette Market Estimates and Forecasts, by Distribution Channel (2020-2032) (USD Billion)
9.4.5 Japan
9.4.5.1 Japan E-Cigarette Market Estimates and Forecasts, by Product (2020-2032) (USD Billion)
9.4.5.2 Japan E-Cigarette Market Estimates and Forecasts, by Distribution Channel (2020-2032) (USD Billion)
9.4.6 South Korea
9.4.6.1 South Korea E-Cigarette Market Estimates and Forecasts, by Product (2020-2032) (USD Billion)
9.4.6.2 South Korea E-Cigarette Market Estimates and Forecasts, by Distribution Channel (2020-2032) (USD Billion)
9.4.7 Vietnam
9.4.7.1 Vietnam E-Cigarette Market Estimates and Forecasts, by Product (2020-2032) (USD Billion)
9.2.7.2 Vietnam E-Cigarette Market Estimates and Forecasts, by Distribution Channel (2020-2032) (USD Billion)
9.4.8 Singapore
9.4.8.1 Singapore E-Cigarette Market Estimates and Forecasts, by Product (2020-2032) (USD Billion)
9.4.8.2 Singapore E-Cigarette Market Estimates and Forecasts, by Distribution Channel (2020-2032) (USD Billion)
9.4.9 Australia
9.4.9.1 Australia E-Cigarette Market Estimates and Forecasts, by Product (2020-2032) (USD Billion)
9.4.9.2 Australia E-Cigarette Market Estimates and Forecasts, by Distribution Channel (2020-2032) (USD Billion)
9.4.10 Rest of Asia Pacific
9.4.10.1 Rest of Asia Pacific E-Cigarette Market Estimates and Forecasts, by Product (2020-2032) (USD Billion)
9.4.10.2 Rest of Asia Pacific E-Cigarette Market Estimates and Forecasts, by Distribution Channel (2020-2032) (USD Billion)
9.5 Middle East and Africa
9.5.1 Middle East
9.5.1.1 Trends Analysis
9.5.1.2 Middle East E-Cigarette Market Estimates and Forecasts, by Country (2020-2032) (USD Billion)
9.5.1.3 Middle East E-Cigarette Market Estimates and Forecasts, by Product (2020-2032) (USD Billion)
9.5.1.4 Middle East E-Cigarette Market Estimates and Forecasts, by Distribution Channel (2020-2032) (USD Billion)
9.5.1.5 UAE
9.5.1.5.1 UAE E-Cigarette Market Estimates and Forecasts, by Product (2020-2032) (USD Billion)
9.5.1.5.2 UAE E-Cigarette Market Estimates and Forecasts, by Distribution Channel (2020-2032) (USD Billion)
9.5.1.6 Egypt
9.5.1.6.1 Egypt E-Cigarette Market Estimates and Forecasts, by Product (2020-2032) (USD Billion)
9.5.1.6.2 Egypt E-Cigarette Market Estimates and Forecasts, by Distribution Channel (2020-2032) (USD Billion)
9.5.1.7 Saudi Arabia
9.5.1.7.1 Saudi Arabia E-Cigarette Market Estimates and Forecasts, by Product (2020-2032) (USD Billion)
9.5.1.7.2 Saudi Arabia E-Cigarette Market Estimates and Forecasts, by Distribution Channel (2020-2032) (USD Billion)
9.5.1.8 Qatar
9.5.1.8.1 Qatar E-Cigarette Market Estimates and Forecasts, by Product (2020-2032) (USD Billion)
9.5.1.8.2 Qatar E-Cigarette Market Estimates and Forecasts, by Distribution Channel (2020-2032) (USD Billion)
9.5.1.9 Rest of Middle East
9.5.1.9.1 Rest of Middle East E-Cigarette Market Estimates and Forecasts, by Product (2020-2032) (USD Billion)
9.5.1.9.2 Rest of Middle East E-Cigarette Market Estimates and Forecasts, by Distribution Channel (2020-2032) (USD Billion)
9.5.2 Africa
9.5.2.1 Trends Analysis
9.5.2.2 Africa E-Cigarette Market Estimates and Forecasts, by Country (2020-2032) (USD Billion)
9.5.2.3 Africa E-Cigarette Market Estimates and Forecasts, by Product (2020-2032) (USD Billion)
9.5.2.4 Africa E-Cigarette Market Estimates and Forecasts, by Distribution Channel (2020-2032) (USD Billion)
9.5.2.5 South Africa
9.5.2.5.1 South Africa E-Cigarette Market Estimates and Forecasts, by Product (2020-2032) (USD Billion)
9.5.2.5.2 South Africa E-Cigarette Market Estimates and Forecasts, by Distribution Channel (2020-2032) (USD Billion)
9.5.2.6 Nigeria
9.5.2.6.1 Nigeria E-Cigarette Market Estimates and Forecasts, by Product (2020-2032) (USD Billion)
9.5.2.6.2 Nigeria E-Cigarette Market Estimates and Forecasts, by Distribution Channel (2020-2032) (USD Billion)
9.5.2.7 Rest of Africa
9.5.2.7.1 Rest of Africa E-Cigarette Market Estimates and Forecasts, by Product (2020-2032) (USD Billion)
9.5.2.7.2 Rest of Africa E-Cigarette Market Estimates and Forecasts, by Distribution Channel (2020-2032) (USD Billion)
9.6 Latin America
9.6.1 Trends Analysis
9.6.2 Latin America E-Cigarette Market Estimates and Forecasts, by Country (2020-2032) (USD Billion)
9.6.3 Latin America E-Cigarette Market Estimates and Forecasts, by Product (2020-2032) (USD Billion)
9.6.4 Latin America E-Cigarette Market Estimates and Forecasts, by Distribution Channel (2020-2032) (USD Billion)
9.6.5 Brazil
9.6.5.1 Brazil E-Cigarette Market Estimates and Forecasts, by Product (2020-2032) (USD Billion)
9.6.5.2 Brazil E-Cigarette Market Estimates and Forecasts, by Distribution Channel (2020-2032) (USD Billion)
9.6.6 Argentina
9.6.6.1 Argentina E-Cigarette Market Estimates and Forecasts, by Product (2020-2032) (USD Billion)
9.6.6.2 Argentina E-Cigarette Market Estimates and Forecasts, by Distribution Channel (2020-2032) (USD Billion)
9.6.7 Colombia
9.6.7.1 Colombia E-Cigarette Market Estimates and Forecasts, by Product (2020-2032) (USD Billion)
9.6.7.2 Colombia E-Cigarette Market Estimates and Forecasts, by Distribution Channel (2020-2032) (USD Billion)
9.6.8 Rest of Latin America
9.6.8.1 Rest of Latin America E-Cigarette Market Estimates and Forecasts, by Product (2020-2032) (USD Billion)
9.6.8.2 Rest of Latin America E-Cigarette Market Estimates and Forecasts, by Distribution Channel (2020-2032) (USD Billion)
10. Company Profiles
10.1 Altria Group, Inc.
10.1.1 Company Overview
10.1.2 Financial
10.1.3 Products/ Services Offered
10.1.4 SWOT Analysis
10.2 British American Tobacco
10.2.1 Company Overview
10.2.2 Financial
10.2.3 Products/ Services Offered
10.2.4 SWOT Analysis
10.3 Imperial Brands
10.3.1 Company Overview
10.3.2 Financial
10.3.3 Products/ Services Offered
10.3.4 SWOT Analysis
10.4 International Vapor Group
10.4.1 Company Overview
10.4.2 Financial
10.4.3 Products/ Services Offered
10.4.4 SWOT Analysis
10.5 Japan Tobacco Inc.
10.5.1 Company Overview
10.5.2 Financial
10.5.3 Products/ Services Offered
10.5.4 SWOT Analysis
10.6 NicQuid
10.6.1 Company Overview
10.6.2 Financial
10.6.3 Products/ Services Offered
10.6.4 SWOT Analysis
10.7 JUUL Labs, Inc.
10.7.1 Company Overview
10.7.2 Financial
10.7.3 Products/ Services Offered
10.7.4 SWOT Analysis
10.8 Philip Morris International Inc.
10.8.1 Company Overview
10.8.2 Financial
10.8.3 Products/ Services Offered
10.8.4 SWOT Analysis
10.9 R.J. Reynolds Vapor Company
10.9.1 Company Overview
10.9.2 Financial
10.9.3 Products/ Services Offered
10.9.4 SWOT Analysis
10.10 Shenzhen IVPS Technology Co., Ltd.
10.10.1 Company Overview
10.10.2 Financial
10.10.3 Products/ Services Offered
10.10.4 SWOT Analysis
11. Use Cases and Best Practices
12. Conclusion
FAQ’S
An accurate research report requires proper strategizing as well as implementation. There are multiple factors involved in the completion of good and accurate research report and selecting the best methodology to compete the research is the toughest part. Since the research reports we provide play a crucial role in any company’s decision-making process, therefore we at SNS Insider always believe that we should choose the best method which gives us results closer to reality. This allows us to reach at a stage wherein we can provide our clients best and accurate investment to output ratio.
Each report that we prepare takes a timeframe of 350-400 business hours for production. Starting from the selection of titles through a couple of in-depth brain storming session to the final QC process before uploading our titles on our website we dedicate around 350 working hours. The titles are selected based on their current market cap and the foreseen CAGR and growth.
The 5 steps process:
Step 1: Secondary Research:
Secondary Research or Desk Research is as the name suggests is a research process wherein, we collect data through the readily available information. In this process we use various paid and unpaid databases which our team has access to and gather data through the same. This includes examining of listed companies’ annual reports, Journals, SEC filling etc. Apart from this our team has access to various associations across the globe across different industries. Lastly, we have exchange relationships with various university as well as individual libraries.
Step 2: Primary Research
When we talk about primary research, it is a type of study in which the researchers collect relevant data samples directly, rather than relying on previously collected data. This type of research is focused on gaining content specific facts that can be sued to solve specific problems. Since the collected data is fresh and first hand therefore it makes the study more accurate and genuine.
We at SNS Insider have divided Primary Research into 2 parts.
Part 1 wherein we interview the KOLs of major players as well as the upcoming ones across various geographic regions. This allows us to have their view over the market scenario and acts as an important tool to come closer to the accurate market numbers. As many as 45 paid and unpaid primary interviews are taken from both the demand and supply side of the industry to make sure we land at an accurate judgement and analysis of the market.
This step involves the triangulation of data wherein our team analyses the interview transcripts, online survey responses and observation of on filed participants. The below mentioned chart should give a better understanding of the part 1 of the primary interview.
Part 2: In this part of primary research the data collected via secondary research and the part 1 of the primary research is validated with the interviews from individual consultants and subject matter experts.
Consultants are those set of people who have at least 12 years of experience and expertise within the industry whereas Subject Matter Experts are those with at least 15 years of experience behind their back within the same space. The data with the help of two main processes i.e., FGDs (Focused Group Discussions) and IDs (Individual Discussions). This gives us a 3rd party nonbiased primary view of the market scenario making it a more dependable one while collation of the data pointers.
Step 3: Data Bank Validation
Once all the information is collected via primary and secondary sources, we run that information for data validation. At our intelligence centre our research heads track a lot of information related to the market which includes the quarterly reports, the daily stock prices, and other relevant information. Our data bank server gets updated every fortnight and that is how the information which we collected using our primary and secondary information is revalidated in real time.
Step 4: QA/QC Process
After all the data collection and validation our team does a final level of quality check and quality assurance to get rid of any unwanted or undesired mistakes. This might include but not limited to getting rid of the any typos, duplication of numbers or missing of any important information. The people involved in this process include technical content writers, research heads and graphics people. Once this process is completed the title gets uploader on our platform for our clients to read it.
Step 5: Final QC/QA Process:
This is the last process and comes when the client has ordered the study. In this process a final QA/QC is done before the study is emailed to the client. Since we believe in giving our clients a good experience of our research studies, therefore, to make sure that we do not lack at our end in any way humanly possible we do a final round of quality check and then dispatch the study to the client.
Key Segments:
By Product
Disposable
Rechargeable
Modular Devices
By Distribution Channel
Online
Retail
Convenience Store
Drug Store
Newsstand
Tobacconist Store
Specialty E-cigarette Store
Request for Segment Customization as per your Business Requirement: Segment Customization Request
Regional Coverage:
North America
US
Canada
Mexico
Europe
Eastern Europe
Poland
Romania
Hungary
Turkey
Rest of Eastern Europe
Western Europe
Germany
France
UK
Italy
Spain
Netherlands
Switzerland
Austria
Rest of Western Europe
Asia Pacific
China
India
Japan
South Korea
Vietnam
Singapore
Australia
Rest of Asia Pacific
Middle East & Africa
Middle East
UAE
Egypt
Saudi Arabia
Qatar
Rest of Middle East
Africa
Nigeria
South Africa
Rest of Africa
Latin America
Brazil
Argentina
Colombia
Rest of Latin America
Request for Country Level Research Report: Country Level Customization Request
Available Customization
With the given market data, SNS Insider offers customization as per the company’s specific needs. The following customization options are available for the report:
Detailed Volume Analysis
Criss-Cross segment analysis (e.g. Product X Application)
Competitive Product Benchmarking
Geographic Analysis
Additional countries in any of the regions
Customized Data Representation
Detailed analysis and profiling of additional market players
The MEMS Sensors Market Size was valued at USD 15.15 Billion in 2023 and is expected to grow at a CAGR of 10.3% to reach USD 36.50 Billion by 2032.
The Semiconductor Back-End Equipment Market Size was valued at USD 17.32 Billion in 2023 and is expected to grow at a CAGR of 8.76% by 2032.
The Flexographic Printing Market size was valued at USD 8.8 billion in 2023 and is expected to grow to USD 12.85 billion at a CAGR of 4.3% by 2024-2032
The Photonics Market size was USD 910.70 billion in 2023 to USD 1642.58 billion by 2032 and grow at a CAGR of 6.83% over the forecast period of 2024-2032.
The Parcel Sortation Systems Market size was valued at USD 1.75 Billion in 2023, and expected to reach USD 3.50 Billion by 2032, growing at a CAGR of 8.01 % during 2024-2032.
USB Devices Market Size was valued at USD 32.28 billion in 2023 and is expected to reach USD 79.41 billion by 2032 and grow at a CAGR of 10.52 % by 2032.
Hi! Click one of our member below to chat on Phone