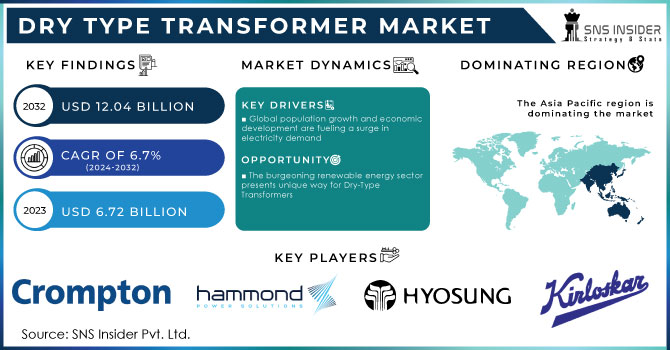
The Dry Type Transformer Market was valued at USD 6.52 billion in 2023 and is projected to reach USD 11.45 billion by 2032, growing at a robust CAGR of 6.45% over the forecast period from 2024 to 2032. This growth is attributed to the growing adoption of transformers across industries due to their safer, more energy-efficient, and environmentally friendly nature compared to oil-filled transformers. The demand in the market is primarily driven by increasing urbanization, modernization of the grid, and integration of renewable energy, especially in the commercial, industrial, and utility sector. The growing obsolescence of aging transformers and the demand for low-maintenance, low fire-risk solutions have been spikes in the global uptake. High-efficiency insulation, Internet of Things (IoT)-enabled monitoring, and smart grid compatibility are increasing the performance metrics of these technologies, providing better energy loss reduction, overload tolerance, and lifespan extension. On the other hand, supply chain constraints such as the rise in raw material prices (copper, aluminum, and insulation resins) along with longer lead times resulting from complexities in manufacturing are impacting market dynamics.However, increased investments in R&D for digitalization, enhanced thermal management, and harmonics reduction are expected to drive innovation, further solidifying the market’s expansion.
Get More Information on Dry Type Transformer Market - Request Sample Report
Drivers:
The rapid growth of cloud computing, AI, and big data analytics is driving an unprecedented expansion of data centers worldwide, raising the need for stable, efficient and low-maintenance power solutions. With regard to server room element, as dry type transformers have fire-resistant oil-free, fireproof design, these transformers are rapidly becoming a favorable option when analyzing safety and reliability in high-density server rooms. For critical infrastructure such as hyperscale and edge data centers, needing continuous, uninterrupted power, these transformers provide low energy losses, improved heat dissipation, and reduced maintenance. Moreover, strict energy efficiency regulations and the growing demand for sustainable power management in data centers are also propelling adoption. With growing AI workloads and high-performance computing, demand for transformers that are compact and high-efficiency will continue, determining the shape of the market in the future.
Restraints:
Dry-type transformers face limitations in handling high-voltage and heavy industrial applications, restricting their use in large-scale power transmission networks. Unlike oil-filled transformers, which can efficiently manage higher voltage levels and large power loads, dry-type transformers rely on air as a cooling medium, making them less effective for high-capacity operations. This limitation restricts their use in long-distance electricity transmission, substations, as well as in heavy-load sectors such as steel, chemical, and heavy manufacturing. Moreover their efficacy diminishes at very high voltages, resulting in greater energy losses, rendering them less applicable for the national grid. It also creates a challenge for these applied in large electrical infrastructures projects, as the technological gap must be addressed in the current context of higher insulation and design performance.
Opportunities
Energy-efficient technologies on a global scale is promoting strong growth opportunities of the dry-type transformer market. The demand for these low-loss high-performance transformers is increasing with nearly 200 countries committing to double the rate of improvement in energy efficiency by 2030. Consequently, to tackle climate change and carbon emissions, governments and sectors are actively pursuing sustainable power solutions, propelling the evolution of dry-type transformers that are environmentally benign, flame proof and require zero maintenance. With the COP28 mandate on stricter carbon reduction policies, industries are being pushed toward energy efficient technology. But as net zero hits the pause button for 2024, the demand for next-gen transformers to make the most of power for all entities is more important than ever new transformers to better distribute energy. The transition to greener grids, intelligent infrastructure, and electrified industry will further drive demand, making dry-type transformers a pivotal technology for meeting global energy-efficiency goals.
Challenges:
Dry-type transformers have less maintenance requirements than oil-filled ones, but dust accumulation and insulation aging can be attacks on their long-term performance. Dry-type transformers have less maintenance requirements than oil-filled ones, but dust accumulation and insulation aging can be attacks on their long-term performance. And because they depend on air cooling, the lack of oil renders them more vulnerable to atmospheric contaminants, dust, and moisture layer depositing on windings. Over time, this can lead to insulation degradation, which can reduce efficiency, as well as increase the risk of overheating or even electrical failures. Thermal cycling and constant exposure to elevated temperatures also contribute to the degradation of insulation materials, compromising the transformer’s operational life. If they are not inspected and cleaned regularly as part of a sound routine, their performance can degrade, leading to premature replacements in the harsh industrial world. As insulation materials and enclosure designs continue to improve, these risks are becoming less prevalent, but maintenance is still a key challenge to ensuring longevity.
By Voltage
In 2023, the medium voltage segment held the largest market share of approximately 57%, to its broad application in commercial, industrial, and utility applications. Once in the medium voltage range, generally between 1 kV and 36 kV, dry-type transformers is the best option since they have more safety, efficiency and reliability, thus suitable for applications like renewable energy integration, urban substations and industrial power distribution. Their resistance to flame and environmentally-friendly design has also led to higher adoption in sectors where sustainable energy solutions are high on the agenda. Moreover, demand add in for smart grids, electric vehicle infrastructure, aggregate centres has been affirmed of demand for medium voltage transformers, proscribing their market share.
The low voltage segment is the fastest-growing in the Dry Type Transformer Market from 2024 to 2032, due to the increasing demand for dry-type transformers in commercial buildings, residential complexes, and industrial automation. Design and Construction These low and medium voltage transformers, usually less than 1 kV, are smaller, safer, and more energy-efficient. Demand is being further propelled by the proliferation of smart homes, electric vehicle charging stations and renewable energy systems. The low voltage segment of the circuit breaker market is poised for accelerated growth driven by an increase in energy efficiency regulations and energy use, along with the growing adoption of distributed power systems.
By End Use
In 2023, the Utilities segment accounted for 45% of the Dry Type Transformer Market revenue, driven by the modernization of power grids and increasing demand for renewable energy integration. Utilities rely on dry-type transformers for substations, distribution networks, and renewable power projects due to their enhanced safety, low maintenance, and eco-friendly design. The push for smart grids, electrification, and reduced carbon emissions is further fueling adoption. As governments and utilities invest in grid resilience and energy efficiency, the demand for dry-type transformers in this segment is expected to remain strong throughout the forecast period.
The industrial segment is projected to be the fastest-growing in The Dry Type Transformer Market from 2024 to 2032, to the increasing industrial automation, electrification, and heightened demand for energy efficiency. Increasing demand from the industries like manufacturing, mining, oil & gas, chemical processing, etc., that require safety, durability, and operations in harsh environments are expected to drive the demand for dry-type transformers across the globe. The transition to renewable energy, smart factories and high-efficiency power distribution is also supporting demand. Moreover, stringent environmental regulations and increasing need for fire resistant and low maintenance solutions are driving adoption, making industrial the key segment in driving market growth.

Get Customized Report as per Your Business Requirement - Request For Customized Report
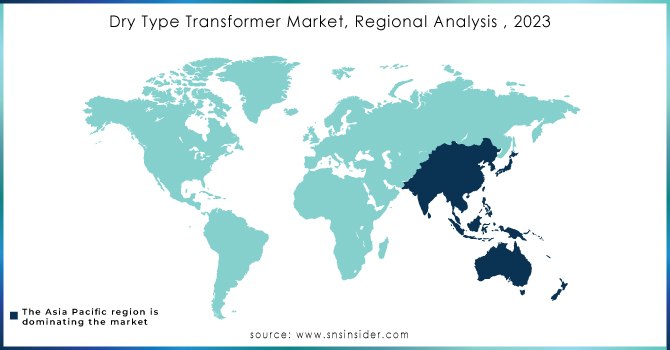
The Asia-Pacific region dominated the dry-type transformer market in 2023, accounting for 45% of total revenue, with the increasing demand for energy due to rapid industrialization and urbanization driving the market growth. Nations like China, India, and Japan are leading the way by investing heavily in power infrastructure, smart grids, and renewable energy initiatives. China, the biggest market, is increasing its transmission and distribution networks whereas India is experiencing rapid growth due to government initiatives such as "Make in India" and rising electrification in rural areas. And Japan’s emphasis on energy efficiency and disaster-resilient grid systems is driving demand. Robust manufacturing capabilities, rising FDI, as well as stringent environmental regulations are also promoting the region’s dominance, by pushing for sustainable power solutions.
Europe is projected to be the fastest-growing region in the dry-type transformer market from 2024 to 2032, due to strict energy efficiency regulations, renewable energy expansion, and modernization of power grids. Germany, France, and the UK were among those who have been investing by the billions into smart grid, industrial and renewable power technology, all aimed at meeting intra EU carbon neutrality goals. Dry-type transformers are also gaining traction due to their higher efficiency and less expensive maintenance costs, partly because of the transition to wind and solar energy. Moreover, Europe's ambitious energy transition, driven in part by the emergence of the electric vehicle (EV) infrastructure and the expansion of data centers located in Nordic countries and Western Europe, is propelling the growth of the market.
Some of the Major Key Players in Dry Type Transformer Market along with product:
Schneider Electric (France) [Energy Management & Automation Solutions]
Siemens Energy (Germany) [Power Transmission & Distribution Equipment]
Eaton (Ireland) [Electrical Power Management Solutions]
Hitachi Ltd. (Japan) [Power Systems & Industrial Equipment]
TOSHIBA CORPORATION (Japan) [Transformers & Power Grids]
General Electric (US) [Power Generation & Grid Solutions]
Fuji Electric Co., Ltd. (Japan) [Industrial & Power Electronics]
CG Power & Industrial Solutions Ltd. (India) [Electrical Equipment & Transformers]
Kirloskar Electric Company (India) [Industrial Electrical Equipment]
HYOSUNG HEAVY INDUSTRIES (South Korea) [Power Transformers & Energy Solutions]
Hammond Power Solutions (US) [Dry-Type Transformers & Power Conditioning]
VOLTAMP (India) [Power & Distribution Transformers]
WEG (Brazil) [Industrial Electrical Solutions]
TMC TRANSFORMERS S.P.A. (Italy) [Medium & Low Voltage Transformers]
Hanley Energy (Republic of Ireland) [Power & Energy Management Systems]
alfanar Group (Germany) [Electrical Engineering & Power Solutions]
Efacec (Portugal) [Energy & Mobility Solutions]
TBEA Co., Ltd. (China) [Power Transformers & Electrical Equipment]
JST Power Equipment, INC. (US) [Power Distribution & Transformer Solutions]
Raychem RPG Private Limited (India) [Power & Insulation Solutions]
RPT Ruhstrat Power Technology GmbH (Germany) [Industrial Power Systems]
Delta Star Power Manufacturing Corp. (Philippines) [Power Transformers & Grid Solutions]
ABB Ltd. (Switzerland) [Electrification & Industrial Automation]
Hyundai Electric & Energy Systems Co. Ltd. (South Korea) [Electrical & Energy Solutions]
List of Suppliers who provide Raw material and component in Dry Type Transformer Market:
Aurubis
Hindalco Industries
Southwire Company
3M
DuPont
Von Roll
Nippon Steel Corporation
POSCO
Thyssenkrupp Electrical Steel
Voestalpine
ArcelorMittal
Baosteel
REA Magnet Wire
Fujikura Ltd.
LS Cable & System
Huntsman Corporation
Elantas
Axalta Coating Systems
Recent Development
July 18, 2024 – Toshiba Transmission and Distribution Systems-India (TTDI), is investing ₹500 crore to increase its transformer production capacity by one and half times by March 2027. The expansion consists of a new center for the custom processing of CRGO steel as well as a manufacturing plant for surge arresters, both designed to enhance India's position as a global T&D equipment hub.
| Report Attributes | Details |
| Market Size in 2023 | USD 6.52 Billion |
| Market Size by 2032 | USD 11.45 Billion |
| CAGR | CAGR of 6.45 % From 2024 to 2032 |
| Base Year | 2023 |
| Forecast Period | 2024-2032 |
| Historical Data | 2020-2022 |
| Report Scope & Coverage | Market Size, Segments Analysis, Competitive Landscape, Regional Analysis, DROC & SWOT Analysis, Forecast Outlook |
| Key Segments | • By voltage (Low Voltage, Medium Voltage, High Voltage) • By End Use (Industrial, Commercial, Utilities, Other End Use) |
| Regional Analysis/Coverage | North America (US, Canada, Mexico), Europe (Eastern Europe [Poland, Romania, Hungary, Turkey, Rest of Eastern Europe] Western Europe] Germany, France, UK, Italy, Spain, Netherlands, Switzerland, Austria, Rest of Western Europe]), Asia Pacific (China, India, Japan, South Korea, Vietnam, Singapore, Australia, Rest of Asia Pacific), Middle East & Africa (Middle East [UAE, Egypt, Saudi Arabia, Qatar, Rest of Middle East], Africa [Nigeria, South Africa, Rest of Africa], Latin America (Brazil, Argentina, Colombia, Rest of Latin America) |
| Company Profiles | Schneider Electric (France), Siemens Energy (Germany), Eaton (Ireland), Hitachi Ltd. (Japan), TOSHIBA CORPORATION (Japan), General Electric (US), Fuji Electric Co., Ltd. (Japan), CG Power & Industrial Solutions Ltd. (India), Kirloskar Electric Company (India), HYOSUNG HEAVY INDUSTRIES (South Korea), Hammond Power Solutions (US), VOLTAMP (India), WEG (Brazil), TMC TRANSFORMERS S.P.A. (Italy), Hanley Energy (Republic of Ireland), alfanar Group (Germany), Efacec (Portugal), TBEA Co., Ltd. (China), JST Power Equipment, INC. (US), Raychem RPG Private Limited (India), RPT Ruhstrat Power Technology GmbH (Germany), Delta Star Power Manufacturing Corp. (Philippines), ABB Ltd. (Switzerland), Hyundai Electric & Energy Systems Co. Ltd. (South Korea). |
Ans: The Dry Type Transformer Market is expected to grow at a CAGR of 6.45%.
Ans: Dry Type Transformer Market size was USD 6.52 billion in 2023 and is expected to Reach USD 11.45 billion by 2032.
Ans: Global population growth and economic development are fueling a surge in electricity demand.
Ans: The dry type Transformer is high in the cost as compared to the oil-filled transformers.
Ans: Ans: Asia- Pacific is the Dominating Region in Dry Type Transformer Market
Table of Content
1. Introduction
1.1 Market Definition
1.2 Scope (Inclusion and Exclusions)
1.3 Research Assumptions
2. Executive Summary
2.1 Market Overview
2.2 Regional Synopsis
2.3 Competitive Summary
3. Research Methodology
3.1 Top-Down Approach
3.2 Bottom-up Approach
3.3. Data Validation
3.4 Primary Interviews
4. Market Dynamics Impact Analysis
4.1 Market Driving Factors Analysis
4.1.2 Drivers
4.1.2 Restraints
4.1.3 Opportunities
4.1.4 Challenges
4.2 PESTLE Analysis
4.3 Porter’s Five Forces Model
5. Statistical Insights and Trends Reporting
5.1 Adoption & Replacement Rate
5.2 Technological & Efficiency Metrics
5.3 Efficiency & Performance Metrics
5.4 Supply Chain & Manufacturing Data
6. Competitive Landscape
6.1 List of Major Companies, By Region
6.2 Market Share Analysis, By Region
6.3 Product Benchmarking
6.3.1 Product specifications and features
6.3.2 Pricing
6.4 Strategic Initiatives
6.4.1 Marketing and promotional activities
6.4.2 Distribution and supply chain strategies
6.4.3 Expansion plans and new product launches
6.4.4 Strategic partnerships and collaborations
6.5 Technological Advancements
6.6 Market Positioning and Branding
7. Dry Type Transformer Market Segmentation, by Voltage
7.1 Chapter Overview
7.2 Low Voltage
7.2.1 Low Voltage Market Trends Analysis (2020-2032)
7.2.2 Low Voltage Market Size Estimates and Forecasts to 2032 (USD Billion)
7.3 Medium Voltage
7.3.1 Medium Voltage Market Trends Analysis (2020-2032)
7.3.2 Medium Voltage Market Size Estimates and Forecasts to 2032 (USD Billion)
7.4 High Voltage
7.4.1 High Voltage Market Trends Analysis (2020-2032)
7.4.2 High Voltage Market Size Estimates and Forecasts to 2032 (USD Billion)
8. Dry Voltage Transformer Market Segmentation, by End Use
8.1 Chapter Overview
8.2 Industrial
8.2.1 Industrial Market Trends Analysis (2020-2032)
8.2.2 Industrial Market Size Estimates and Forecasts to 2032 (USD Billion)
8.3 Commercial
8.3.1 Commercial Market Trends Analysis (2020-2032)
8.3.2 Commercial Market Size Estimates and Forecasts to 2032 (USD Billion)
8.4 Utilities
8.4.1 Utilities Market Trends Analysis (2020-2032)
8.4.2 Utilities Market Size Estimates and Forecasts to 2032 (USD Billion)
8.5 Other End Use
8.5.1 Other End Use Market Trends Analysis (2020-2032)
8.5.2 Other End Use Market Size Estimates and Forecasts to 2032 (USD Billion)
9. Regional Analysis
9.1 Chapter Overview
9.2 North America
9.2.1 Trends Analysis
9.2.2 North America Dry Voltage Transformer Market Estimates and Forecasts, by Country (2020-2032) (USD Billion)
9.2.3 North America Dry Voltage Transformer Market Estimates and Forecasts, by Voltage (2020-2032) (USD Billion)
9.2.4 North America Dry Voltage Transformer Market Estimates and Forecasts, by End Use (2020-2032) (USD Billion)
9.2.5 USA
9.2.5.1 USA Dry Voltage Transformer Market Estimates and Forecasts, by Voltage (2020-2032) (USD Billion)
9.2.5.2 USA Dry Voltage Transformer Market Estimates and Forecasts, by End Use (2020-2032) (USD Billion)
9.2.6 Canada
9.2.6.1 Canada Dry Voltage Transformer Market Estimates and Forecasts, by Voltage (2020-2032) (USD Billion)
9.2.6.2 Canada Dry Voltage Transformer Market Estimates and Forecasts, by End Use (2020-2032) (USD Billion)
9.2.7 Mexico
9.2.7.1 Mexico Dry Voltage Transformer Market Estimates and Forecasts, by Voltage (2020-2032) (USD Billion)
9.2.7.2 Mexico Dry Voltage Transformer Market Estimates and Forecasts, by End Use (2020-2032) (USD Billion)
9.3 Europe
9.3.1 Eastern Europe
9.3.1.1 Trends Analysis
9.3.1.2 Eastern Europe Dry Voltage Transformer Market Estimates and Forecasts, by Country (2020-2032) (USD Billion)
9.3.1.3 Eastern Europe Dry Voltage Transformer Market Estimates and Forecasts, by Voltage (2020-2032) (USD Billion)
9.3.1.4 Eastern Europe Dry Voltage Transformer Market Estimates and Forecasts, by End Use (2020-2032) (USD Billion)
9.3.1.5 Poland
9.3.1.5.1 Poland Dry Voltage Transformer Market Estimates and Forecasts, by Voltage (2020-2032) (USD Billion)
9.3.1.5.2 Poland Dry Voltage Transformer Market Estimates and Forecasts, by End Use (2020-2032) (USD Billion)
9.3.1.6 Romania
9.3.1.6.1 Romania Dry Voltage Transformer Market Estimates and Forecasts, by Voltage (2020-2032) (USD Billion)
9.3.1.6.2 Romania Dry Voltage Transformer Market Estimates and Forecasts, by End Use (2020-2032) (USD Billion)
9.3.1.7 Hungary
9.3.1.7.1 Hungary Dry Voltage Transformer Market Estimates and Forecasts, by Voltage (2020-2032) (USD Billion)
9.3.1.7.2 Hungary Dry Voltage Transformer Market Estimates and Forecasts, by End Use (2020-2032) (USD Billion)
9.3.1.8 Turkey
9.3.1.8.1 Turkey Dry Voltage Transformer Market Estimates and Forecasts, by Voltage (2020-2032) (USD Billion)
9.3.1.8.2 Turkey Dry Voltage Transformer Market Estimates and Forecasts, by End Use (2020-2032) (USD Billion)
9.3.1.9 Rest of Eastern Europe
9.3.1.9.1 Rest of Eastern Europe Dry Voltage Transformer Market Estimates and Forecasts, by Voltage (2020-2032) (USD Billion)
9.3.1.9.2 Rest of Eastern Europe Dry Voltage Transformer Market Estimates and Forecasts, by End Use (2020-2032) (USD Billion)
9.3.2 Western Europe
9.3.2.1 Trends Analysis
9.3.2.2 Western Europe Dry Voltage Transformer Market Estimates and Forecasts, by Country (2020-2032) (USD Billion)
9.3.2.3 Western Europe Dry Voltage Transformer Market Estimates and Forecasts, by Voltage (2020-2032) (USD Billion)
9.3.2.4 Western Europe Dry Voltage Transformer Market Estimates and Forecasts, by End Use (2020-2032) (USD Billion)
9.3.2.5 Germany
9.3.2.5.1 Germany Dry Voltage Transformer Market Estimates and Forecasts, by Voltage (2020-2032) (USD Billion)
9.3.2.5.2 Germany Dry Voltage Transformer Market Estimates and Forecasts, by End Use (2020-2032) (USD Billion)
9.3.2.6 France
9.3.2.6.1 France Dry Voltage Transformer Market Estimates and Forecasts, by Voltage (2020-2032) (USD Billion)
9.3.2.6.2 France Dry Voltage Transformer Market Estimates and Forecasts, by End Use (2020-2032) (USD Billion)
9.3.2.7 UK
9.3.2.7.1 UK Dry Voltage Transformer Market Estimates and Forecasts, by Voltage (2020-2032) (USD Billion)
9.3.2.7.2 UK Dry Voltage Transformer Market Estimates and Forecasts, by End Use (2020-2032) (USD Billion)
9.3.2.8 Italy
9.3.2.8.1 Italy Dry Voltage Transformer Market Estimates and Forecasts, by Voltage (2020-2032) (USD Billion)
9.3.2.8.2 Italy Dry Voltage Transformer Market Estimates and Forecasts, by End Use (2020-2032) (USD Billion)
9.3.2.9 Spain
9.3.2.9.1 Spain Dry Voltage Transformer Market Estimates and Forecasts, by Voltage (2020-2032) (USD Billion)
9.3.2.9.2 Spain Dry Voltage Transformer Market Estimates and Forecasts, by End Use (2020-2032) (USD Billion)
9.3.2.10 Netherlands
9.3.2.10.1 Netherlands Dry Voltage Transformer Market Estimates and Forecasts, by Voltage (2020-2032) (USD Billion)
9.3.2.10.2 Netherlands Dry Voltage Transformer Market Estimates and Forecasts, by End Use (2020-2032) (USD Billion)
9.3.2.11 Switzerland
9.3.2.11.1 Switzerland Dry Voltage Transformer Market Estimates and Forecasts, by Voltage (2020-2032) (USD Billion)
9.3.2.11.2 Switzerland Dry Voltage Transformer Market Estimates and Forecasts, by End Use (2020-2032) (USD Billion)
9.3.2.12 Austria
9.3.2.12.1 Austria Dry Voltage Transformer Market Estimates and Forecasts, by Voltage (2020-2032) (USD Billion)
9.3.2.12.2 Austria Dry Voltage Transformer Market Estimates and Forecasts, by End Use (2020-2032) (USD Billion)
9.3.2.13 Rest of Western Europe
9.3.2.13.1 Rest of Western Europe Dry Voltage Transformer Market Estimates and Forecasts, by Voltage (2020-2032) (USD Billion)
9.3.2.13.2 Rest of Western Europe Dry Voltage Transformer Market Estimates and Forecasts, by End Use (2020-2032) (USD Billion)
9.4 Asia Pacific
9.4.1 Trends Analysis
9.4.2 Asia Pacific Dry Voltage Transformer Market Estimates and Forecasts, by Country (2020-2032) (USD Billion)
9.4.3 Asia Pacific Dry Voltage Transformer Market Estimates and Forecasts, by Voltage (2020-2032) (USD Billion)
9.4.4 Asia Pacific Dry Voltage Transformer Market Estimates and Forecasts, by End Use (2020-2032) (USD Billion)
9.4.5 China
9.4.5.1 China Dry Voltage Transformer Market Estimates and Forecasts, by Voltage (2020-2032) (USD Billion)
9.4.5.2 China Dry Voltage Transformer Market Estimates and Forecasts, by End Use (2020-2032) (USD Billion)
9.4.6 India
9.4.5.1 India Dry Voltage Transformer Market Estimates and Forecasts, by Voltage (2020-2032) (USD Billion)
9.4.5.2 India Dry Voltage Transformer Market Estimates and Forecasts, by End Use (2020-2032) (USD Billion)
9.4.5 Japan
9.4.5.1 Japan Dry Voltage Transformer Market Estimates and Forecasts, by Voltage (2020-2032) (USD Billion)
9.4.5.2 Japan Dry Voltage Transformer Market Estimates and Forecasts, by End Use (2020-2032) (USD Billion)
9.4.6 South Korea
9.4.6.1 South Korea Dry Voltage Transformer Market Estimates and Forecasts, by Voltage (2020-2032) (USD Billion)
9.4.6.2 South Korea Dry Voltage Transformer Market Estimates and Forecasts, by End Use (2020-2032) (USD Billion)
9.4.7 Vietnam
9.4.7.1 Vietnam Dry Voltage Transformer Market Estimates and Forecasts, by Voltage (2020-2032) (USD Billion)
9.2.7.2 Vietnam Dry Voltage Transformer Market Estimates and Forecasts, by End Use (2020-2032) (USD Billion)
9.4.8 Singapore
9.4.8.1 Singapore Dry Voltage Transformer Market Estimates and Forecasts, by Voltage (2020-2032) (USD Billion)
9.4.8.2 Singapore Dry Voltage Transformer Market Estimates and Forecasts, by End Use (2020-2032) (USD Billion)
9.4.9 Australia
9.4.9.1 Australia Dry Voltage Transformer Market Estimates and Forecasts, by Voltage (2020-2032) (USD Billion)
9.4.9.2 Australia Dry Voltage Transformer Market Estimates and Forecasts, by End Use (2020-2032) (USD Billion)
9.4.10 Rest of Asia Pacific
9.4.10.1 Rest of Asia Pacific Dry Voltage Transformer Market Estimates and Forecasts, by Voltage (2020-2032) (USD Billion)
9.4.10.2 Rest of Asia Pacific Dry Voltage Transformer Market Estimates and Forecasts, by End Use (2020-2032) (USD Billion)
9.5 Middle East and Africa
9.5.1 Middle East
9.5.1.1 Trends Analysis
9.5.1.2 Middle East Dry Voltage Transformer Market Estimates and Forecasts, by Country (2020-2032) (USD Billion)
9.5.1.3 Middle East Dry Voltage Transformer Market Estimates and Forecasts, by Voltage (2020-2032) (USD Billion)
9.5.1.4 Middle East Dry Voltage Transformer Market Estimates and Forecasts, by End Use (2020-2032) (USD Billion)
9.5.1.5 UAE
9.5.1.5.1 UAE Dry Voltage Transformer Market Estimates and Forecasts, by Voltage (2020-2032) (USD Billion)
9.5.1.5.2 UAE Dry Voltage Transformer Market Estimates and Forecasts, by End Use (2020-2032) (USD Billion)
9.5.1.6 Egypt
9.5.1.6.1 Egypt Dry Voltage Transformer Market Estimates and Forecasts, by Voltage (2020-2032) (USD Billion)
9.5.1.6.2 Egypt Dry Voltage Transformer Market Estimates and Forecasts, by End Use (2020-2032) (USD Billion)
9.5.1.7 Saudi Arabia
9.5.1.7.1 Saudi Arabia Dry Voltage Transformer Market Estimates and Forecasts, by Voltage (2020-2032) (USD Billion)
9.5.1.7.2 Saudi Arabia Dry Voltage Transformer Market Estimates and Forecasts, by End Use (2020-2032) (USD Billion)
9.5.1.8 Qatar
9.5.1.8.1 Qatar Dry Voltage Transformer Market Estimates and Forecasts, by Voltage (2020-2032) (USD Billion)
9.5.1.8.2 Qatar Dry Voltage Transformer Market Estimates and Forecasts, by End Use (2020-2032) (USD Billion)
9.5.1.9 Rest of Middle East
9.5.1.9.1 Rest of Middle East Dry Voltage Transformer Market Estimates and Forecasts, by Voltage (2020-2032) (USD Billion)
9.5.1.9.2 Rest of Middle East Dry Voltage Transformer Market Estimates and Forecasts, by End Use (2020-2032) (USD Billion)
9.5.2 Africa
9.5.2.1 Trends Analysis
9.5.2.2 Africa Dry Voltage Transformer Market Estimates and Forecasts, by Country (2020-2032) (USD Billion)
9.5.2.3 Africa Dry Voltage Transformer Market Estimates and Forecasts, by Voltage (2020-2032) (USD Billion)
9.5.2.4 Africa Dry Voltage Transformer Market Estimates and Forecasts, by End Use (2020-2032) (USD Billion)
9.5.2.5 South Africa
9.5.2.5.1 South Africa Dry Voltage Transformer Market Estimates and Forecasts, by Voltage (2020-2032) (USD Billion)
9.5.2.5.2 South Africa Dry Voltage Transformer Market Estimates and Forecasts, by End Use (2020-2032) (USD Billion)
9.5.2.6 Nigeria
9.5.2.6.1 Nigeria Dry Voltage Transformer Market Estimates and Forecasts, by Voltage (2020-2032) (USD Billion)
9.5.2.6.2 Nigeria Dry Voltage Transformer Market Estimates and Forecasts, by End Use (2020-2032) (USD Billion)
9.5.2.7 Rest of Africa
9.5.2.7.1 Rest of Africa Dry Voltage Transformer Market Estimates and Forecasts, by Voltage (2020-2032) (USD Billion)
9.5.2.7.2 Rest of Africa Dry Voltage Transformer Market Estimates and Forecasts, by End Use (2020-2032) (USD Billion)
9.6 Latin America
9.6.1 Trends Analysis
9.6.2 Latin America Dry Voltage Transformer Market Estimates and Forecasts, by Country (2020-2032) (USD Billion)
9.6.3 Latin America Dry Voltage Transformer Market Estimates and Forecasts, by Voltage (2020-2032) (USD Billion)
9.6.4 Latin America Dry Voltage Transformer Market Estimates and Forecasts, by End Use (2020-2032) (USD Billion)
9.6.5 Brazil
9.6.5.1 Brazil Dry Voltage Transformer Market Estimates and Forecasts, by Voltage (2020-2032) (USD Billion)
9.6.5.2 Brazil Dry Voltage Transformer Market Estimates and Forecasts, by End Use (2020-2032) (USD Billion)
9.6.6 Argentina
9.6.6.1 Argentina Dry Voltage Transformer Market Estimates and Forecasts, by Voltage (2020-2032) (USD Billion)
9.6.6.2 Argentina Dry Voltage Transformer Market Estimates and Forecasts, by End Use (2020-2032) (USD Billion)
9.6.7 Colombia
9.6.7.1 Colombia Dry Voltage Transformer Market Estimates and Forecasts, by Voltage (2020-2032) (USD Billion)
9.6.7.2 Colombia Dry Voltage Transformer Market Estimates and Forecasts, by End Use (2020-2032) (USD Billion)
9.6.8 Rest of Latin America
9.6.8.1 Rest of Latin America Dry Voltage Transformer Market Estimates and Forecasts, by Voltage (2020-2032) (USD Billion)
9.6.8.2 Rest of Latin America Dry Voltage Transformer Market Estimates and Forecasts, by End Use (2020-2032) (USD Billion)
10. Company Profiles
10.1 Schneider Electric
10.1.1 Company Overview
10.1.2 Financial
10.1.3 Products/ Services Offered
110.1.4 SWOT Analysis
10.2 Siemens Energy
10.2.1 Company Overview
10.2.2 Financial
10.2.3 Products/ Services Offered
10.2.4 SWOT Analysis
10.3 Eaton
10.3.1 Company Overview
10.3.2 Financial
10.3.3 Products/ Services Offered
10.3.4 SWOT Analysis
10.4 Hitachi Ltd.
10.4.1 Company Overview
10.4.2 Financial
10.4.3 Products/ Services Offered
10.4.4 SWOT Analysis
10.5 TOSHIBA CORPORATION
10.5.1 Company Overview
10.5.2 Financial
10.5.3 Products/ Services Offered
10.5.4 SWOT Analysis
10.6 General Electric
10.6.1 Company Overview
10.6.2 Financial
10.6.3 Products/ Services Offered
10.6.4 SWOT Analysis
10.7 Fuji Electric Co., Ltd.
10.7.1 Company Overview
10.7.2 Financial
10.7.3 Products/ Services Offered
10.7.4 SWOT Analysis
10.8 CG Power & Industrial Solutions Ltd.
10.8.1 Company Overview
10.8.2 Financial
10.8.3 Products/ Services Offered
10.8.4 SWOT Analysis
10.9 Kirloskar Electric Company
10.9.1 Company Overview
10.9.2 Financial
10.9.3 Products/ Services Offered
10.9.4 SWOT Analysis
10.10 HYOSUNG HEAVY INDUSTRIES
10.10.1 Company Overview
10.10.2 Financial
10.10.3 Products/ Services Offered
10.10.4 SWOT Analysis
11. Use Cases and Best Practices
12. Conclusion
An accurate research report requires proper strategizing as well as implementation. There are multiple factors involved in the completion of good and accurate research report and selecting the best methodology to compete the research is the toughest part. Since the research reports we provide play a crucial role in any company’s decision-making process, therefore we at SNS Insider always believe that we should choose the best method which gives us results closer to reality. This allows us to reach at a stage wherein we can provide our clients best and accurate investment to output ratio.
Each report that we prepare takes a timeframe of 350-400 business hours for production. Starting from the selection of titles through a couple of in-depth brain storming session to the final QC process before uploading our titles on our website we dedicate around 350 working hours. The titles are selected based on their current market cap and the foreseen CAGR and growth.
The 5 steps process:
Step 1: Secondary Research:
Secondary Research or Desk Research is as the name suggests is a research process wherein, we collect data through the readily available information. In this process we use various paid and unpaid databases which our team has access to and gather data through the same. This includes examining of listed companies’ annual reports, Journals, SEC filling etc. Apart from this our team has access to various associations across the globe across different industries. Lastly, we have exchange relationships with various university as well as individual libraries.

Step 2: Primary Research
When we talk about primary research, it is a type of study in which the researchers collect relevant data samples directly, rather than relying on previously collected data. This type of research is focused on gaining content specific facts that can be sued to solve specific problems. Since the collected data is fresh and first hand therefore it makes the study more accurate and genuine.
We at SNS Insider have divided Primary Research into 2 parts.
Part 1 wherein we interview the KOLs of major players as well as the upcoming ones across various geographic regions. This allows us to have their view over the market scenario and acts as an important tool to come closer to the accurate market numbers. As many as 45 paid and unpaid primary interviews are taken from both the demand and supply side of the industry to make sure we land at an accurate judgement and analysis of the market.
This step involves the triangulation of data wherein our team analyses the interview transcripts, online survey responses and observation of on filed participants. The below mentioned chart should give a better understanding of the part 1 of the primary interview.

Part 2: In this part of primary research the data collected via secondary research and the part 1 of the primary research is validated with the interviews from individual consultants and subject matter experts.
Consultants are those set of people who have at least 12 years of experience and expertise within the industry whereas Subject Matter Experts are those with at least 15 years of experience behind their back within the same space. The data with the help of two main processes i.e., FGDs (Focused Group Discussions) and IDs (Individual Discussions). This gives us a 3rd party nonbiased primary view of the market scenario making it a more dependable one while collation of the data pointers.
Step 3: Data Bank Validation
Once all the information is collected via primary and secondary sources, we run that information for data validation. At our intelligence centre our research heads track a lot of information related to the market which includes the quarterly reports, the daily stock prices, and other relevant information. Our data bank server gets updated every fortnight and that is how the information which we collected using our primary and secondary information is revalidated in real time.

Step 4: QA/QC Process
After all the data collection and validation our team does a final level of quality check and quality assurance to get rid of any unwanted or undesired mistakes. This might include but not limited to getting rid of the any typos, duplication of numbers or missing of any important information. The people involved in this process include technical content writers, research heads and graphics people. Once this process is completed the title gets uploader on our platform for our clients to read it.
Step 5: Final QC/QA Process:
This is the last process and comes when the client has ordered the study. In this process a final QA/QC is done before the study is emailed to the client. Since we believe in giving our clients a good experience of our research studies, therefore, to make sure that we do not lack at our end in any way humanly possible we do a final round of quality check and then dispatch the study to the client.
Key Segments:
By Voltage
Low Voltage
Medium Voltage
High Voltage
By End Use
Industrial
Commercial
Utilities
Other End Use
Request for Segment Customization as per your Business Requirement: Segment Customization Request
Regional Coverage:
North America
US
Canada
Mexico
Europe
Eastern Europe
Poland
Romania
Hungary
Turkey
Rest of Eastern Europe
Western Europe
Germany
France
UK
Italy
Spain
Netherlands
Switzerland
Austria
Rest of Western Europe
Asia Pacific
China
India
Japan
South Korea
Vietnam
Singapore
Australia
Rest of Asia Pacific
Middle East & Africa
Middle East
UAE
Egypt
Saudi Arabia
Qatar
Rest of Middle East
Africa
Nigeria
South Africa
Rest of Africa
Latin America
Brazil
Argentina
Colombia
Rest of Latin America
Request for Country Level Research Report: Country Level Customization Request
Available Customization
With the given market data, SNS Insider offers customization as per the company’s specific needs. The following customization options are available for the report:
Detailed Volume Analysis
Criss-Cross segment analysis (e.g. Product X Application)
Competitive Product Benchmarking
Geographic Analysis
Additional countries in any of the regions
Customized Data Representation
Detailed analysis and profiling of additional market players
The Infrared Detector Market size was valued at USD 538 million in 2023 and is expected to reach USD 980.80 million by 2032 and grow at a CAGR of 6.9% over the forecast period 2024-2032.The Infrared Detector Market size was valued at USD 538 million in 20
The Smart Display Market Size was valued at USD 2.99 Billion in 2023 and is expected to grow at a CAGR of 30.7% to reach USD 33.05 Billion by 2032.
The Liquid Crystal on Silicon (LCoS) Market size was valued at 1.94 Billion in 2023 and is projected to reach USD 3.42 Billion by 2032 with a growing CAGR of 6.49% Over the Forecast Period of 2024-2032.
The Machine-to-Machine (M2M) Market Size was valued at USD 23.62 billion in 2023 and is expected to grow at a CAGR of 4.60% to reach USD 35.40 billion by 2032.
The Portable Battery Market Size was valued at USD 14.4 billion in 2023 and is expected to reach USD 34.79 billion by 2032 and grow at a CAGR of 10.3% over the forecast period 2024-2032.
The Transparent Display Market Size was valued at USD 2.42 Billion in 2023 and is expected to reach USD 56.17 Billion by 2032 and grow at a CAGR of 41.89% over the forecast period 2024-2032

Hi! Click one of our member below to chat on Phone
© 2025 All Rights Reserved by SNS Insider Pvt Ltd


