image

Drilling Lubricants Market Report Scope & Overview:
Drilling Lubricants Market Revenue Analysis

Get More Information on Drilling Lubricants Market - Request Sample Report

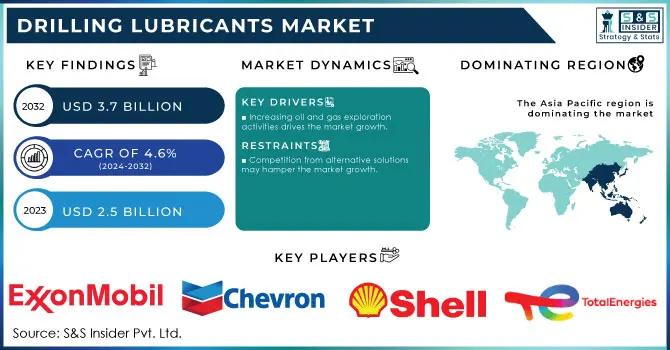
The Drilling Lubricants Market Size was valued at USD 2.5 Billion in 2023 and is expected to reach USD 3.7 Billion by 2032 and grow at a CAGR of 4.6% over the forecast period 2024-2032.

As the global population and industrial activity continue to grow, so does the demand for oil and gas, increasing the need further to expedite drilling. With the current exploration and production activities surging, oil & gas players are becoming aware of adding value to their operations by employing proprietary drilling lubricants to maximize their on-field processes. These lubricants are designed to optimize performance by minimizing friction between the drill bit and wellbore, gaining both drilling efficiencies as well as extending equipment life. These lubricants help reduce maintenance-related operational costs and downtime by reducing wear and tear. The ongoing push to drill deeper and in many cases, into ever more difficult and sensitive environments, means the high-performance 'lubricant component has an even greater role to play in helping companies continue to meet production demands without compromising on safety or environmental objectives.

According to the U.S. Energy Information Administration (EIA), in its 2023 report on oil and natural gas drilling activity, the number of active drilling rigs in the United States increased to 770 in August 2023, representing a 12% rise compared to the same period in 2022. This surge highlights the growing demand for efficient drilling operations in response to rising global oil prices and increased consumption.

Health and safety are increasingly important in the drilling industry as there has been a drive to protect workers and the environment. An increase in understanding of the potential risks related to conventional drilling lubricants that may contain toxic substances is driving operators to find a safer alternative solution. This has led to a major development of non-toxic or low-odor lubricants that suspend the driller efficiency risk for health effects. Not only do these safer formulations conform to the most stringent regulatory standards, but they are also a manifestation of corporate responsibility and environmental stewardship. Say no to accidents, and more ecological footprints in any aspect a company is operating by making use of safe biodegradable lubricant thus not putting worker safety at risk and positive impact on the work base higher than ever. This trend underscores how lubricant innovation must go hand-in-hand with the practicality of manufacturers to roll out products that are both ultra-trend towards health and safety compliance while also driving operational efficiencies.

The U.S. Bureau of Labor Statistics (BLS) reported in its 2022 data that the oil and gas extraction industry had an injury and illness incidence rate of 3.3 cases per 100 full-time workers, which is higher than the national average for all industries (2.7 cases per 100 full-time workers). This statistic emphasizes the ongoing challenges related to health and safety in the drilling sector. To address these issues, regulatory bodies like the Occupational Safety and Health Administration (OSHA) have implemented strict guidelines, prompting companies to adopt safer practices, including the use of non-toxic and low-odor lubricants.

Drilling Lubricants Market Dynamics

Drivers

  • Increasing oil and gas exploration activities drives the market growth.

Oil and gas exploration activities are increasing, which is primarily driving the growth of the drilling lubricants market over the forecast period. With global energy needs growing due to population and industrial growth, oil and gas firms are increasing exploration for new reserves. Higher exploration adoption results in the use of higher-end drilling technologies including but not limited to horizontal and offshore having advanced lubricants operating. High-performance drilling lubricants are urgently needed, as these products reduce friction and increase the speed compared to conventional techniques and prolong the service life of equipment, thereby providing significant cost savings. Furthermore, increasing the drive to explore more hostile environments–such as deepwater and Arctic areas–escalates the requirement for high-end lubricants that can withstand such challenging operating conditions. As a result, the increasing exploration activities in the oil and gas sector are significantly boosting the growth of the drilling lubricants market.

Globally, oil and natural gas production amounted to 4.5 billion barrels per day back in 2022 according to the U.S. Energy Information Administration (EIA) in its latest update for 2023; with an average of nearly 750 active oil and gas rigs positioned within the continental U.S., signaling a continued increase in exploration an output capacity amid growing energy needs on the one hand;

Restrain

  • Competition from alternative solutions may hamper the market growth.

One of the key factors hampering the growth of the global traditional drilling lubricants market is the emergence of alternative drilling technologies as a competition to them. Examples of water-based drilling fluids and lower-lubrication methods are beginning to be adopted as companies aim to optimize efficiency while minimizing the impact on climate. For example, water-based systems can provide sufficient cooling and lubrication and are not reliant on petroleum-based products common in environmentally sensitive locations. Furthermore, with innovation in drilling techniques like air drilling and foam drilling, the requirement for conventional lubricants is diminished altogether which further reduces the market dependence on traditional formulations. As regulators are tightening lubricant controls and corporations are reviewing their sustainability commitments, these alternatives not only strive to maximize drilling performance but also represent an opportunity for change.

Drilling Lubricants Market Segmentation Overview

By Technique

Diamond Drilling held the largest market share around 30% in 2023. In diamond drilling, diamonds are embedded into the drill bit allowing a smooth passage with little wear on the equipment. There is a considerable demand for specialized drilling lubricants that improve performance while protecting the drill bit from excessive heat and friction, owing to their efficiency in mineral exploration and geotechnical investigations. As the diamond drill gives high-quality core samples due to its high precision and accuracy, it adds imperative to the market. With the ever-increasing global mining & resource extraction activities, diamond drilling adoption is also expected to continue rising thus increasing the need for appropriate types of compatible drilling lubricants for optimizing its performance with desired operational safety and efficiency.

By End-Use

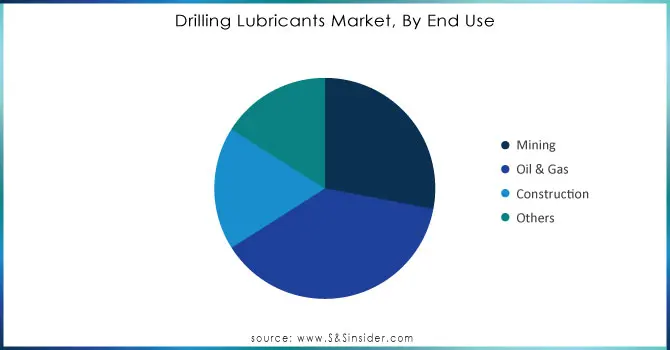
Oil & Gas held the largest market share around 38% in 2023. This is due to its place as one of the key global energy sources and a constant demand for hydrocarbon exploration and extraction. Oil and gas operations are one of the most critical industries across the globe, which is why sophisticated drilling processes require advanced lubricants to help them improve performance, decrease friction, and extend equipment life. The extreme conditions in which drilling often takes place including deepwater environments and high-temperature reservoirs only add complexity to these operations highlighting even more the need for high-performance lubricants capable of enduring such scenarios. Such growth stimulates the consumption of lubricants designed explicitly for oil and gas applications, alongside pushing lubricant formulations to be modified to cater to the changing needs of this vibrant industry. This makes the oil and gas industry a major constituent of the drilling lubricants market, dictating its trends and developments throughout different links in the supply chain.
Drilling-Lubricants-Market-By-End-Use

Need Any Customization Research On Drilling Lubricants Market - Inquiry Now

Drilling Lubricants Market Regional Analysis

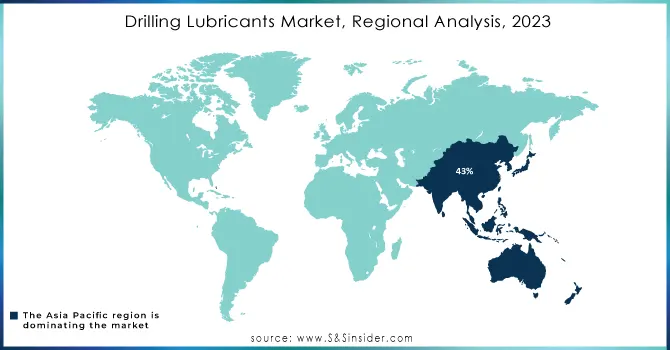
Asia Pacific held the largest market share around 43% in 2023. The region possesses some of the largest oil and gas reserves in the world, with countries like China, India, and Australia being a major driver for exploration and production. In addition, from rapid industrialization and urbanization continue to increase energy demand which supports investment in the sector even more. Further, rising advancements in drilling technology and shift towards cost-effective and sustainable handling has influenced companies to utilize specific type of drilling lubricants for optimum performance while minimizing environment footprint. Such initiatives by the government towards improving energy self-reliance and foreign investments in the oil and gas sector further augment the market growth. Additionally, continuous shale gas and offshore resources development provides considerable potential for drillers to take advantage of in the region, making it a major target for drilling lubricant suppliers who want to get their share from developing market conditions over Asia-Pacific.

According to the International Energy Agency (IEA), Asia-Pacific accounted for approximately 40% of global oil demand in 2022, with China being the largest importer of crude oil, importing over 500 million tons in that year. Additionally, the Australian government’s Department of Industry, Science, Energy and Resources reported a 20% increase in exploration spending in Australia in 2023, highlighting the region's commitment to expanding its oil and gas capabilities.
Drilling-Lubricants-Market-Regional-Analysis-2023

Key Players in Drilling Lubricants Market

  • ExxonMobil Corporation – (Mobil SHC Gear, Mobil DTE 10 Excel)

  • Chevron Corporation – (Chevron Drill Oil, Chevron Rando HD)

  • Royal Dutch Shell plc – (Shell Gadus, Shell Tellus)

  • BP plc – (BP Energrease, BP Vanellus)

  • TotalEnergies SE – (Total Drilfluid, Total Hydrelf)

  • Schlumberger Limited – (MI SWACO Drilling Lubricants, Schlumberger Oil Mud Lubricants)

  • Halliburton Company – (Baroid Bore-Hole Stabilizers, Dril-N Lubricant)

  • Baker Hughes Company – (Baker Hughes Drilling Fluid Lubricants, Drilling Lubes by Baker Hughes)

  • Dow Inc. – (DOWSIL Drilling Additives, Dow Chemical Polyethylene Glycols)

  • BASF SE – (BASF Lubricant Additives, BASF High-Performance Fluid)

  • Croda International Plc – (Croda Lubricant Esters, Croda Drilling Fluid Additives)

  • Lubrizol Corporation – (Lubrizol Performance Fluids, Lubrizol Additive Technology)

  • Newpark Resources Inc. – (Newpark TerraMax, Newpark Evolution Fluid Systems)

  • Petrobras – (Petrobras HDB Fluid, Petrobras Drill Lubes)

  • Clariant AG – (Clariant Lube Additives, Clariant Drilling Additives)

  • Afton Chemical Corporation – (HiTEC Drilling Lubricants, Afton Drilling Fluid Additives)

  • Idemitsu Kosan Co., Ltd. – (Idemitsu Drill Oils, Idemitsu Lubricant Products)

  • Sinopec Limited – (Sinopec Drill Lube, Sinopec Gear Oil)

  • Ashland Global Holdings Inc. – (Aquathol Drilling Fluid Additives, Ashland Lubricant Technology)

  • Calumet Specialty Products Partners, L.P. – (Calumet Versagel, Calumet Royal Drilling Lubricants) 

Recent Development:

  • In 2023, ExxonMobil Corporation Introduced Mobil SHC 600 Series, an advanced line of synthetic drilling lubricants designed for high-temperature applications, offering superior wear protection and thermal stability.

  • In 2023 Chevron Corporation Launched Chevron Drill Oil with enhanced biodegradability, aimed at reducing environmental impact while maintaining performance in drilling operations.

  • In 2022 Royal Dutch Shell plc released shell drilling solutions, a new range of high-performance drilling fluids and lubricants designed to improve efficiency and reduce downtime.

Drilling Lubricants Market Report Scope

Report Attributes Details
Market Size in 2023 US$ 2.5 billion
Market Size by 2032 US$ 3.7 Billion
CAGR CAGR of4.6% From 2024 to 2032
Base Year 2023
Forecast Period 2024-2032
Historical Data 2020-2022
Report Scope & Coverage Market Size, Segments Analysis, Competitive  Landscape, Regional Analysis, DROC & SWOT Analysis, Forecast Outlook
Key Segments • By Technique (Down The Hole Drills (DTH)/Rotary Air Blast Drilling (RAB), Diamond Drilling, Top Hammer Drilling, Reverse Circulation Drilling, Others)
•By End-Use (Mining, Oil & Gas, Construction, Others),
Regional Analysis/Coverage North America (US, Canada, Mexico), Europe (Eastern Europe [Poland, Romania, Hungary, Turkey, Rest of Eastern Europe] Western Europe [Germany, France, UK, Italy, Spain, Netherlands, Switzerland, Austria, Rest of Western Europe]), Asia Pacific (China, India, Japan, South Korea, Vietnam, Singapore, Australia, Rest of Asia Pacific), Middle East & Africa (Middle East [UAE, Egypt, Saudi Arabia, Qatar, Rest of Middle East], Africa [Nigeria, South Africa, Rest of Africa], Latin America (Brazil, Argentina, Colombia, Rest of Latin America)
Company Profiles ExxonMobil Corporation, Chevron Corporation, Royal Dutch Shell plc, BP plc, TotalEnergies SE, Schlumberger Limited, Halliburton Company, Baker Hughes Company, Dow Inc., BASF SE, Croda International Plc, Lubrizol Corporation, Newpark Resources Inc., Petrobras, Clariant AG, Afton Chemical Corporation, Idemitsu Kosan Co., Ltd., Sinopec Limited, Ashland Global Holdings Inc., Calumet Specialty Products Partners, L.P. and others.
Key Drivers • Increasing oil and gas exploration activities drives the market growth. 
RESTRAINTS • Competition from alternative solutions may hamper the market growth. 

Frequently Asked Questions

Ans: The Drilling Lubricants Market was valued at USD 2.5 Billion in 2023.

Ans: The expected CAGR of the global Drilling Lubricants Market during the forecast period is 4.6%.

Ans: The Oil & Gas segment product will grow rapidly in the Drilling Lubricants Market from 2024-2032.

Ans: Increasing oil and gas exploration activities drives the market growth.

Ans: The U.S. led the Drilling Lubricants Market in the North America region with the highest revenue share in 2023.

Table of Content

1. Introduction

1.1 Market Definition

1.2 Scope (Inclusion and Exclusions)

1.3 Research Assumptions

2. Executive Summary

2.1 Market Overview

2.2 Regional Synopsis

2.3 Competitive Summary

3. Research Methodology

3.1 Top-Down Approach

3.2 Bottom-up Approach

3.3. Data Validation

3.4 Primary Interviews

4. Market Dynamics Impact Analysis

3.1 Market Driving Factors Analysis

3.1.2 Drivers

3.1.2 Restraints

3.1.3 Opportunities

3.1.4 Challenges

3.2 PESTLE Analysis

3.3 Porter’s Five Forces Model

5. Statistical Insights and Trends Reporting

5.1 Production Capacity and Utilization, by Country, by Type, 2023

5.2 Feedstock Prices, by Country, by Type, 2023

5.3   Regulatory Impact, by l Country, by Type, 2023.

5.4 Environmental Metrics: Emissions Data, Waste Management Practices, and Sustainability Initiatives, by Region

5.5 Innovation and R&D, by Type, 2023

6. Competitive Landscape

6.1 List of Major Companies, By Region

6.2 Market Share Analysis, By Region

6.3 Product Benchmarking

6.3.1 Product specifications and features

6.3.2 Pricing

6.4 Strategic Initiatives

6.4.1 Marketing and promotional activities

6.4.2 Distribution and supply chain strategies

6.4.3 Expansion plans and new Product launches

6.4.4 Strategic partnerships and collaborations

6.5 Technological Advancements

6.6 Market Positioning and Branding

7. Drilling Lubricants Market Segmentation, by Technique

7.1 Chapter Overview

7.2 Down The Hole Drills (DTH)/ Rotary Air Blast Drilling (RAB)      

       7.2.1 Down The Hole Drills (DTH)/ Rotary Air Blast Drilling (RAB) Market Trends Analysis (2020-2032)

7.2.2 Down The Hole Drills (DTH)/ Rotary Air Blast Drilling (RAB) Market Size Estimates and Forecasts to 2032 (USD Billion)

7.3 Diamond Drilling

       7.3.1 Diamond Drilling Market Trends Analysis (2020-2032)

7.3.2 Diamond Drilling Market Size Estimates and Forecasts to 2032 (USD Billion)

7.4 Top Hammer Drilling

       7.4.1 Top Hammer Drilling Market Trends Analysis (2020-2032)

7.4.2 Top Hammer Drilling Market Size Estimates and Forecasts to 2032 (USD Billion)

7.5 Reverse Circulation Drilling

       7.5.1 Reverse Circulation Drilling Market Trends Analysis (2020-2032)

7.5.2 Reverse Circulation Drilling Market Size Estimates and Forecasts to 2032 (USD Billion)

7.6 Others

       7.6.1 Others Market Trends Analysis (2020-2032)

7.6.2 Others Market Size Estimates and Forecasts to 2032 (USD Billion)

8. Drilling Lubricants Market Segmentation, by End-Use

8.1 Chapter Overview

8.2 Mining        

        8.2.1 Mining Market Trends Analysis (2020-2032)

8.2.2 Mining Market Size Estimates and Forecasts to 2032 (USD Billion)

8.3 Oil & Gas

         8.3. Oil & Gas Market Trends Analysis (2020-2032)

8.3.2 Oil & Gas Market Size Estimates and Forecasts to 2032 (USD Billion)

8.4 Construction        

       8.4.1 Construction Market Trends Analysis (2020-2032)

8.4.2 Construction Market Size Estimates and Forecasts to 2032 (USD Billion)

8.5 Others

8.5.1 Others Market Trends Analysis (2020-2032)

8.5.2 Others Market Size Estimates and Forecasts to 2032 (USD Billion)

9. Regional Analysis

9.1 Chapter Overview

9.2 North America

9.2.1 Trends Analysis

9.2.2 North America Drilling Lubricants Market Estimates and Forecasts, by Country (2020-2032) (USD Billion)

9.2.3 North America Drilling Lubricants Market Estimates and Forecasts, by Technique (2020-2032) (USD Billion)  

9.2.4 North America Drilling Lubricants Market Estimates and Forecasts, by End-Use (2020-2032) (USD Billion)

9.2.5 USA

9.2.5.1 USA Drilling Lubricants Market Estimates and Forecasts, by Technique (2020-2032) (USD Billion)

9.2.5.2 USA Drilling Lubricants Market Estimates and Forecasts, by End-Use (2020-2032) (USD Billion)

9.2.6 Canada

9.2.6.1 Canada Drilling Lubricants Market Estimates and Forecasts, by Technique (2020-2032) (USD Billion)

9.2.6.2 Canada Drilling Lubricants Market Estimates and Forecasts, by End-Use (2020-2032) (USD Billion)

9.2.7 Mexico

9.2.7.1 Mexico Drilling Lubricants Market Estimates and Forecasts, by Technique (2020-2032) (USD Billion)

9.2.7.2 Mexico Drilling Lubricants Market Estimates and Forecasts, by End-Use (2020-2032) (USD Billion)

9.3 Europe

9.3.1 Eastern Europe

9.3.1.1 Trends Analysis

9.3.1.2 Eastern Europe Drilling Lubricants Market Estimates and Forecasts, by Country (2020-2032) (USD Billion)

9.3.1.3 Eastern Europe Drilling Lubricants Market Estimates and Forecasts, by Technique (2020-2032) (USD Billion)  

9.3.1.4 Eastern Europe Drilling Lubricants Market Estimates and Forecasts, by End-Use (2020-2032) (USD Billion)

9.3.1.5 Poland

9.3.1.5.1 Poland Drilling Lubricants Market Estimates and Forecasts, by Technique (2020-2032) (USD Billion)

9.3.1.5.2 Poland Drilling Lubricants Market Estimates and Forecasts, by End-Use (2020-2032) (USD Billion)

9.3.1.6 Romania

9.3.1.6.1 Romania Drilling Lubricants Market Estimates and Forecasts, by Technique (2020-2032) (USD Billion)

9.3.1.6.2 Romania Drilling Lubricants Market Estimates and Forecasts, by End-Use (2020-2032) (USD Billion)

9.3.1.7 Hungary

9.3.1.7.1 Hungary Drilling Lubricants Market Estimates and Forecasts, by Technique (2020-2032) (USD Billion)

9.3.1.7.2 Hungary Drilling Lubricants Market Estimates and Forecasts, by End-Use (2020-2032) (USD Billion)

9.3.1.8 Turkey

9.3.1.8.1 Turkey Drilling Lubricants Market Estimates and Forecasts, by Technique (2020-2032) (USD Billion)

9.3.1.8.2 Turkey Drilling Lubricants Market Estimates and Forecasts, by End-Use (2020-2032) (USD Billion)

9.3.1.9 Rest of Eastern Europe

9.3.1.9.1 Rest of Eastern Europe Drilling Lubricants Market Estimates and Forecasts, by Technique (2020-2032) (USD Billion)

9.3.1.9.2 Rest of Eastern Europe Drilling Lubricants Market Estimates and Forecasts, by End-Use (2020-2032) (USD Billion)

9.3.2 Western Europe

9.3.2.1 Trends Analysis

9.3.2.2 Western Europe Drilling Lubricants Market Estimates and Forecasts, by Country (2020-2032) (USD Billion)

9.3.2.3 Western Europe Drilling Lubricants Market Estimates and Forecasts, by Technique (2020-2032) (USD Billion)  

9.3.2.4 Western Europe Drilling Lubricants Market Estimates and Forecasts, by End-Use (2020-2032) (USD Billion)

9.3.2.5 Germany

9.3.2.5.1 Germany Drilling Lubricants Market Estimates and Forecasts, by Technique (2020-2032) (USD Billion)

9.3.2.5.2 Germany Drilling Lubricants Market Estimates and Forecasts, by End-Use (2020-2032) (USD Billion)

9.3.2.6 France

9.3.2.6.1 France Drilling Lubricants Market Estimates and Forecasts, by Technique (2020-2032) (USD Billion)

9.3.2.6.2 France Drilling Lubricants Market Estimates and Forecasts, by End-Use (2020-2032) (USD Billion)

9.3.2.7 UK

9.3.2.7.1 UK Drilling Lubricants Market Estimates and Forecasts, by Technique (2020-2032) (USD Billion)

9.3.2.7.2 UK Drilling Lubricants Market Estimates and Forecasts, by End-Use (2020-2032) (USD Billion)

9.3.2.8 Italy

9.3.2.8.1 Italy Drilling Lubricants Market Estimates and Forecasts, by Technique (2020-2032) (USD Billion)

9.3.2.8.2 Italy Drilling Lubricants Market Estimates and Forecasts, by End-Use (2020-2032) (USD Billion)

9.3.2.9 Spain

9.3.2.9.1 Spain Drilling Lubricants Market Estimates and Forecasts, by Technique (2020-2032) (USD Billion)

9.3.2.9.2 Spain Drilling Lubricants Market Estimates and Forecasts, by End-Use (2020-2032) (USD Billion)

9.3.2.10 Netherlands

9.3.2.10.1 Netherlands Drilling Lubricants Market Estimates and Forecasts, by Technique (2020-2032) (USD Billion)

9.3.2.10.2 Netherlands Drilling Lubricants Market Estimates and Forecasts, by End-Use (2020-2032) (USD Billion)

9.3.2.11 Switzerland

9.3.2.11.1 Switzerland Drilling Lubricants Market Estimates and Forecasts, by Technique (2020-2032) (USD Billion)

9.3.2.11.2 Switzerland Drilling Lubricants Market Estimates and Forecasts, by End-Use (2020-2032) (USD Billion)

9.3.2.12 Austria

9.3.2.12.1 Austria Drilling Lubricants Market Estimates and Forecasts, by Technique (2020-2032) (USD Billion)

9.3.2.12.2 Austria Drilling Lubricants Market Estimates and Forecasts, by End-Use (2020-2032) (USD Billion)

9.3.2.13 Rest of Western Europe

9.3.2.13.1 Rest of Western Europe Drilling Lubricants Market Estimates and Forecasts, by Technique (2020-2032) (USD Billion)

9.3.2.13.2 Rest of Western Europe Drilling Lubricants Market Estimates and Forecasts, by End-Use (2020-2032) (USD Billion)

9.4 Asia Pacific

9.4.1 Trends Analysis

9.4.2 Asia Pacific Drilling Lubricants Market Estimates and Forecasts, by Country (2020-2032) (USD Billion)

9.4.3 Asia Pacific Drilling Lubricants Market Estimates and Forecasts, by Technique (2020-2032) (USD Billion)  

9.4.4 Asia Pacific Drilling Lubricants Market Estimates and Forecasts, by End-Use (2020-2032) (USD Billion)

9.4.5 China

9.4.5.1 China Drilling Lubricants Market Estimates and Forecasts, by Technique (2020-2032) (USD Billion)

9.4.5.2 China Drilling Lubricants Market Estimates and Forecasts, by End-Use (2020-2032) (USD Billion)

9.4.6 India

9.4.5.1 India Drilling Lubricants Market Estimates and Forecasts, by Technique (2020-2032) (USD Billion)

9.4.5.2 India Drilling Lubricants Market Estimates and Forecasts, by End-Use (2020-2032) (USD Billion)

9.4.5 Japan

9.4.5.1 Japan Drilling Lubricants Market Estimates and Forecasts, by Technique (2020-2032) (USD Billion)

9.4.5.2 Japan Drilling Lubricants Market Estimates and Forecasts, by End-Use (2020-2032) (USD Billion)

9.4.6 South Korea

9.4.6.1 South Korea Drilling Lubricants Market Estimates and Forecasts, by Technique (2020-2032) (USD Billion)

9.4.6.2 South Korea Drilling Lubricants Market Estimates and Forecasts, by End-Use (2020-2032) (USD Billion)

9.4.7 Vietnam

9.4.7.1 Vietnam Drilling Lubricants Market Estimates and Forecasts, by Technique (2020-2032) (USD Billion)

9.2.7.2 Vietnam Drilling Lubricants Market Estimates and Forecasts, by End-Use (2020-2032) (USD Billion)

9.4.8 Singapore

9.4.8.1 Singapore Drilling Lubricants Market Estimates and Forecasts, by Technique (2020-2032) (USD Billion)

9.4.8.2 Singapore Drilling Lubricants Market Estimates and Forecasts, by End-Use (2020-2032) (USD Billion)

9.4.9 Australia

9.4.9.1 Australia Drilling Lubricants Market Estimates and Forecasts, by Technique (2020-2032) (USD Billion)

9.4.9.2 Australia Drilling Lubricants Market Estimates and Forecasts, by End-Use (2020-2032) (USD Billion)

9.4.10 Rest of Asia Pacific

9.4.10.1 Rest of Asia Pacific Drilling Lubricants Market Estimates and Forecasts, by Technique (2020-2032) (USD Billion)

9.4.10.2 Rest of Asia Pacific Drilling Lubricants Market Estimates and Forecasts, by End-Use (2020-2032) (USD Billion)

9.5 Middle East and Africa

9.5.1 Middle East

9.5.1.1 Trends Analysis

9.5.1.2 Middle East Drilling Lubricants Market Estimates and Forecasts, by Country (2020-2032) (USD Billion)

9.5.1.3 Middle East Drilling Lubricants Market Estimates and Forecasts, by Technique (2020-2032) (USD Billion)  

9.5.1.4 Middle East Drilling Lubricants Market Estimates and Forecasts, by End-Use (2020-2032) (USD Billion)

9.5.1.5 UAE

9.5.1.5.1 UAE Drilling Lubricants Market Estimates and Forecasts, by Technique (2020-2032) (USD Billion)

9.5.1.5.2 UAE Drilling Lubricants Market Estimates and Forecasts, by End-Use (2020-2032) (USD Billion)

9.5.1.6 Egypt

9.5.1.6.1 Egypt Drilling Lubricants Market Estimates and Forecasts, by Technique (2020-2032) (USD Billion)

9.5.1.6.2 Egypt Drilling Lubricants Market Estimates and Forecasts, by End-Use (2020-2032) (USD Billion)

9.5.1.7 Saudi Arabia

9.5.1.7.1 Saudi Arabia Drilling Lubricants Market Estimates and Forecasts, by Technique (2020-2032) (USD Billion)

9.5.1.7.2 Saudi Arabia Drilling Lubricants Market Estimates and Forecasts, by End-Use (2020-2032) (USD Billion)

9.5.1.8 Qatar

9.5.1.8.1 Qatar Drilling Lubricants Market Estimates and Forecasts, by Technique (2020-2032) (USD Billion)

9.5.1.8.2 Qatar Drilling Lubricants Market Estimates and Forecasts, by End-Use (2020-2032) (USD Billion)

9.5.1.9 Rest of Middle East

9.5.1.9.1 Rest of Middle East Drilling Lubricants Market Estimates and Forecasts, by Technique (2020-2032) (USD Billion)

9.5.1.9.2 Rest of Middle East Drilling Lubricants Market Estimates and Forecasts, by End-Use (2020-2032) (USD Billion)

9.5.2 Africa

9.5.2.1 Trends Analysis

9.5.2.2 Africa Drilling Lubricants Market Estimates and Forecasts, by Country (2020-2032) (USD Billion)

9.5.2.3 Africa Drilling Lubricants Market Estimates and Forecasts, by Technique (2020-2032) (USD Billion)  

9.5.2.4 Africa Drilling Lubricants Market Estimates and Forecasts, by End-Use (2020-2032) (USD Billion)

9.5.2.5 South Africa

9.5.2.5.1 South Africa Drilling Lubricants Market Estimates and Forecasts, by Technique (2020-2032) (USD Billion)

9.5.2.5.2 South Africa Drilling Lubricants Market Estimates and Forecasts, by End-Use (2020-2032) (USD Billion)

9.5.2.6 Nigeria

9.5.2.6.1 Nigeria Drilling Lubricants Market Estimates and Forecasts, by Technique (2020-2032) (USD Billion)

9.5.2.6.2 Nigeria Drilling Lubricants Market Estimates and Forecasts, by End-Use (2020-2032) (USD Billion)

9.6 Latin America

9.6.1 Trends Analysis

9.6.2 Latin America Drilling Lubricants Market Estimates and Forecasts, by Country (2020-2032) (USD Billion)

9.6.3 Latin America Drilling Lubricants Market Estimates and Forecasts, by Technique (2020-2032) (USD Billion)  

9.6.4 Latin America Drilling Lubricants Market Estimates and Forecasts, by End-Use (2020-2032) (USD Billion)

9.6.5 Brazil

9.6.5.1 Brazil Drilling Lubricants Market Estimates and Forecasts, by Technique (2020-2032) (USD Billion)

9.6.5.2 Brazil Drilling Lubricants Market Estimates and Forecasts, by End-Use (2020-2032) (USD Billion)

9.6.6 Argentina

9.6.6.1 Argentina Drilling Lubricants Market Estimates and Forecasts, by Technique (2020-2032) (USD Billion)

9.6.6.2 Argentina Drilling Lubricants Market Estimates and Forecasts, by End-Use (2020-2032) (USD Billion)

9.6.7 Colombia

9.6.7.1 Colombia Drilling Lubricants Market Estimates and Forecasts, by Technique (2020-2032) (USD Billion)

9.6.7.2 Colombia Drilling Lubricants Market Estimates and Forecasts, by End-Use (2020-2032) (USD Billion)

9.6.8 Rest of Latin America

9.6.8.1 Rest of Latin America Drilling Lubricants Market Estimates and Forecasts, by Technique (2020-2032) (USD Billion)

9.6.8.2 Rest of Latin America Drilling Lubricants Market Estimates and Forecasts, by End-Use (2020-2032) (USD Billion)

10. Company Profiles

           10.1 ExxonMobil Corporation

                          10.1.1 Company Overview

10.1.2 Financial

10.1.3 Products/ Services Offered

10.1.4 SWOT Analysis

           10.2   Chevron Corporation                           

                           10.2.1 Company Overview

10.2.2 Financial

10.2.3 Products/ Services Offered

10.2.4 SWOT Analysis

10.3 Royal Dutch Shell plc

             10.3.1 Company Overview

10.3.2 Financial

10.3.3 Products/ Services Offered

10.3.4 SWOT Analysis

10.4 BP plc

             10.4.1 Company Overview

10.4.2 Financial

10.4.3 Products/ Services Offered

10.4.4 SWOT Analysis

10.5 TotalEnergies SE

             10.5.1 Company Overview

10.5.2 Financial

10.5.3 Products/ Services Offered

10.5.4 SWOT Analysis

10.6 Schlumberger Limited

             10.6.1 Company Overview

10.6.2 Financial

10.6.3 Products/ Services Offered

10.6.4 SWOT Analysis

10.7 Halliburton Company

             10.7.1 Company Overview

10.7.2 Financial

10.7.3 Products/ Services Offered

10.7.4 SWOT Analysis

10.8 Baker Hughes Company

             10.8.1 Company Overview

10.8.2 Financial

10.8.3 Products/ Services Offered

10.8.4 SWOT Analysis

10.9 Dow Inc.

             10.9.1 Company Overview

10.9.2 Financial

10.9.3 Products/ Services Offered

10.9.4 SWOT Analysis

10.10 BASF SE

             10.10.1 Company Overview

10.10.2 Financial

10.10.3 Products/ Services Offered

10.10.4 SWOT Analysis

11. Use Cases and Best Practices

12. Conclusion

An accurate research report requires proper strategizing as well as implementation. There are multiple factors involved in the completion of good and accurate research report and selecting the best methodology to compete the research is the toughest part. Since the research reports we provide play a crucial role in any company’s decision-making process, therefore we at SNS Insider always believe that we should choose the best method which gives us results closer to reality. This allows us to reach at a stage wherein we can provide our clients best and accurate investment to output ratio.

Each report that we prepare takes a timeframe of 350-400 business hours for production. Starting from the selection of titles through a couple of in-depth brain storming session to the final QC process before uploading our titles on our website we dedicate around 350 working hours. The titles are selected based on their current market cap and the foreseen CAGR and growth.


The 5 steps process:

Step 1: Secondary Research:

Secondary Research or Desk Research is as the name suggests is a research process wherein, we collect data through the readily available information. In this process we use various paid and unpaid databases which our team has access to and gather data through the same. This includes examining of listed companies’ annual reports, Journals, SEC filling etc. Apart from this our team has access to various associations across the globe across different industries. Lastly, we have exchange relationships with various university as well as individual libraries.

Secondary Research

Step 2: Primary Research

When we talk about primary research, it is a type of study in which the researchers collect relevant data samples directly, rather than relying on previously collected data.  This type of research is focused on gaining content specific facts that can be sued to solve specific problems. Since the collected data is fresh and first hand therefore it makes the study more accurate and genuine.

We at SNS Insider have divided Primary Research into 2 parts.

Part 1 wherein we interview the KOLs of major players as well as the upcoming ones across various geographic regions. This allows us to have their view over the market scenario and acts as an important tool to come closer to the accurate market numbers. As many as 45 paid and unpaid primary interviews are taken from both the demand and supply side of the industry to make sure we land at an accurate judgement and analysis of the market.

This step involves the triangulation of data wherein our team analyses the interview transcripts, online survey responses and observation of on filed participants. The below mentioned chart should give a better understanding of the part 1 of the primary interview.

Primary Research

Part 2: In this part of primary research the data collected via secondary research and the part 1 of the primary research is validated with the interviews from individual consultants and subject matter experts.

Consultants are those set of people who have at least 12 years of experience and expertise within the industry whereas Subject Matter Experts are those with at least 15 years of experience behind their back within the same space. The data with the help of two main processes i.e., FGDs (Focused Group Discussions) and IDs (Individual Discussions). This gives us a 3rd party nonbiased primary view of the market scenario making it a more dependable one while collation of the data pointers.

Step 3: Data Bank Validation

Once all the information is collected via primary and secondary sources, we run that information for data validation. At our intelligence centre our research heads track a lot of information related to the market which includes the quarterly reports, the daily stock prices, and other relevant information. Our data bank server gets updated every fortnight and that is how the information which we collected using our primary and secondary information is revalidated in real time.

Data Bank Validation

Step 4: QA/QC Process

After all the data collection and validation our team does a final level of quality check and quality assurance to get rid of any unwanted or undesired mistakes. This might include but not limited to getting rid of the any typos, duplication of numbers or missing of any important information. The people involved in this process include technical content writers, research heads and graphics people. Once this process is completed the title gets uploader on our platform for our clients to read it.

Step 5: Final QC/QA Process:

This is the last process and comes when the client has ordered the study. In this process a final QA/QC is done before the study is emailed to the client. Since we believe in giving our clients a good experience of our research studies, therefore, to make sure that we do not lack at our end in any way humanly possible we do a final round of quality check and then dispatch the study to the client.

Key Segments:

By Product Type

  • Baker’s

  • Brewer’s

By Application

  • Food

  • Animal Feed

  • Biofuel

  • Cleaning & Disinfection

  • Other

Request for Segment Customization as per your Business Requirement: Segment Customization Request

Regional Coverage:

North America

  • US

  • Canada

  • Mexico

Europe

  • Eastern Europe

    • Poland

    • Romania

    • Hungary

    • Turkey

    • Rest of Eastern Europe

  • Western Europe

    • Germany

    • France

    • UK

    • Italy

    • Spain

    • Netherlands

    • Switzerland

    • Austria

    • Rest of Western Europe

Asia Pacific

  • China

  • India

  • Japan

  • South Korea

  • Vietnam

  • Singapore

  • Australia

  • Rest of Asia Pacific

Middle East & Africa

  • Middle East

    • UAE

    • Egypt

    • Saudi Arabia

    • Qatar

    • Rest of Middle East

  • Africa

    • Nigeria

    • South Africa

    • Rest of Africa

  • Latin America

  • Brazil

  • Argentina

  • Colombia

  • Rest of Latin America

Request for Country Level Research Report: Country Level Customization Request

Available Customization

With the given market data, SNS Insider offers customization as per the company’s specific needs. The following customization options are available for the report:

  • Product Analysis

  • Criss-Cross segment analysis (e.g. Product X Application)

  • Product Matrix which gives a detailed comparison of product portfolio of each company

  • Geographic Analysis

  • Additional countries in any of the regions

  • Company Information

  • Detailed analysis and profiling of additional market players (Up to five)


  •            5000 (33% Discount)


  •            8950 (40% Discount)


  •            3050 (23% Discount)

Start a Conversation

Hi! Click one of our member below to chat on Phone