Get More Information on District Heating Market - Request Sample Report
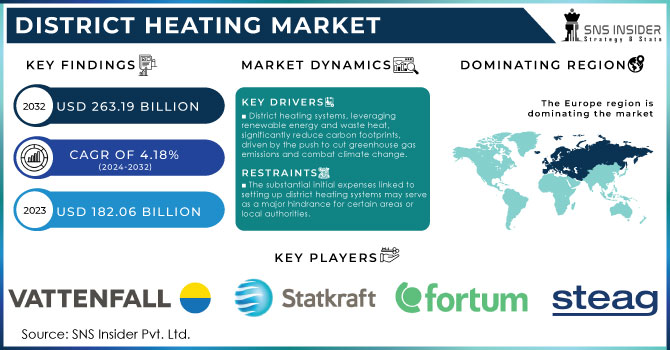
The District Heating Market Size was valued at USD 182.06 Billion in 2023 and is now anticipated to grow USD 263.19 Billion by 2032, displaying a compound annual growth rate (CAGR) of 4.18% during the forecast Period 2024-2032.
The growing district heating market is having a big impact on the equipment market as cities and communities aim to improve energy efficiency and lower carbon emissions, leading to increased popularity of district heating systems. The demand for particular equipment components is being fueled by this change. There is a strong demand for boilers, heat exchangers, and heat pumps to help with effective heat production and distribution. District heating production stayed comparable to 2022 levels, fulfilling approximately 9% of the worldwide heating demand in buildings and industry. The top-performing networks have shown that district heating has significant potential for effectively, affordably, and flexibly incorporating low-emission energy sources into the heating energy mix on a large scale. Nevertheless, the potential for reducing carbon emissions in district heating systems has not been fully realized, with fossil fuels accounting for around 90% of heat production in district networks worldwide, particularly in China and Russia, the two leading markets.
The power consumption in the U.S. saw a 2.6% increase in 2022 however, projections indicate a 0.6% decline in demand for 2023, followed by an average rise of 1.2% in 2024 and 2025. Throughout this forecasted period, the escalating power demand in the U.S. is expected to drive heat meter. As energy consumption rises, accurate measurement and management of heat usage become increasingly vital, especially in applications like residential and commercial heating systems. The district heating allows customers to precisely control over heating and providing flexibility and customization to adapt to consumer needs. Individual heating systems suffer from inconsistencies related to heat loss. Furthermore, district heating has a centralized heat generation and uses a mix of renewable energy sources, waste heat recovery there by is very flexible in implementation making a key factor in highly adopting the heater.
In April 2023: the European Union provided EUR 401 million in support for the Czech green district heating scheme.
In March 2023: the Energy Security Bill in the UK implemented a heat networks regulation to allow for heat zoning. The Climate Change Committee predicts that by 2050, heat networks could provide approximately 18% of the United Kingdom's heat consumption.
MARKET DYNAMICS
DRIVER
The increasing focus on decreasing greenhouse gas emissions and addressing climate change is a major motivator, since district heating systems have the ability to significantly decrease carbon footprints by utilizing renewable energy sources and waste heat.
The increasing focus on reducing greenhouse gas emissions and addressing climate change is a major factor driving the uptake of district heating systems. These systems can greatly decrease carbon footprints by using sources of renewable energy like biomass, geothermal, and solar energy, in addition to utilizing waste heat from industrial processes and power generation. District heating reduces dependence on fossil fuels and significantly lowers carbon dioxide and other greenhouse gas emissions by incorporating clean energy sources. This change not just aids in achieving worldwide climate aims but also improves energy efficiency and sustainability in cities. Governments and policymakers are showing more support for district heating by offering incentives and regulations, understanding its ability to help achieve a low-carbon future. As a result, the district heating sector is seeing strong expansion, in line with broader environmental goals and the critical need to address the impacts of climate change.
District heating systems generally offer better energy efficiency compared to individual heating systems, leading to cost savings for consumers and lower overall energy usage.
District heating systems are more energy efficient than individual heating systems because they use centralized heat production and distribution. This method enables the incorporation of very effective combined heat and power (CHP) facilities and the utilization of renewable energy sources like biomass and geothermal. District heating reduces energy loss by generating heat in one place and distributing it through an insulated network of pipes instead of using multiple individual systems. Moreover, the cost savings for consumers are substantial due to the operational and maintenance costs being reduced through the economies of scale achieved in district heating. Efficient use of energy helps to decrease overall energy consumption, aiding sustainability efforts and reducing carbon footprints. District heating offers economic and environmental advantages, making it an appealing solution for urban areas.
RESTRAIN
The substantial initial expenses linked to setting up district heating systems may serve as a major hindrance for certain areas or local authorities.
The significant obstacle for numerous regions and municipalities is the considerable initial expenses associated with setting up district heating infrastructure. The financial challenge arises from the significant investment needed to build the network of pipes, centralized heating plants, and related systems. The costs at the beginning cover more than just the physical structure; they also include the planning, permits, and possible disturbances to current city landscapes during setup. Smaller towns or areas with restricted finances may struggle to allocate the required funds. Moreover, obtaining funding for these extensive initiatives can pose challenges, with potential investors showing reluctance because of the extended repayment schedules and uncertainties surrounding future energy needs. As a result, even though district heating offers long-term environmental and economic advantages, the large upfront cost can discourage communities from using this sustainable heating option, impeding the wider adoption and incorporation of district heating systems.
The efficiency of district heating systems is reduced by heat loss through the pipe network, as thermal energy escapes before reaching end-users.
Heat escaping through the pipes reduces the effectiveness of district heating systems by letting thermal energy leak before reaching the final users. This loss of heat leads to greater energy usage because additional fuel is needed to make up for the lost heat, causing higher operating expenses and a greater impact on the environment. The insulation of pipes reduces some heat loss but may not fully prevent it, especially over long distances or in old infrastructure. As a result, users experience temperatures lower than what was expected, which decreases the efficiency of the heating system and may cause discomfort or require additional heating sources. Improving insulation, consistently servicing the network, and incorporating modern materials and technologies may decrease these losses, but fully eliminating them is difficult. Hence, reducing heat loss is essential for optimizing energy efficiency, cutting expenses, and maintaining the dependability of district heating systems.
KEY SEGMENTATION ANALYSIS
By Plant Type
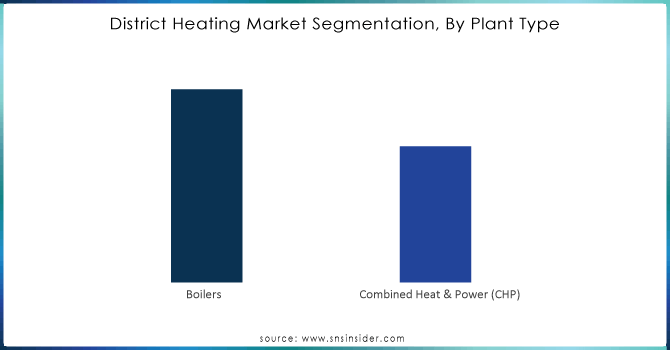
The Combined Heat & Power (CHP) are leading the market with a 61% market share in 2023, because they can produce both electricity and heat from one fuel source simultaneously, such as biomass, natural gas, or waste heat. The generated electricity is either utilized locally or sent to the grid, and the extra heat is distributed through district heating to supply space heating and hot water to consumers.
Get Customized Report as per your Business Requirement - Request For Customized Report
By Heat Source
In 2023, the market is mostly controlled by Natural Gas as a heat source, making up 30.40% of the market share. In regions with established gas infrastructure, natural gas is frequently utilized as a primary source of heat for district heating systems. Boilers or combined heat and power (CHP) plants use natural gas to generate heat that is distributed to different buildings through pipelines. Natural gas heating offers the benefits of reduced carbon emissions, increased efficiency, and versatility. However, it also comes with drawbacks such as expensive prices, dependency on gas availability, and the release of methane.
By Application
The industrial segment held the largest market share of more than 38% in 2023, the district heating market by application, driven by the substantial demand for reliable and cost-effective heat in various industrial processes. District heating systems provide an efficient means of supplying thermal energy to industrial zones, contributing to enhanced energy efficiency and reduced operational costs. The centralized nature of district heating aligns well with the concentrated heating needs of industrial facilities, offering a practical solution for large-scale heat requirements.
KEY REGIONAL ANALYSIS
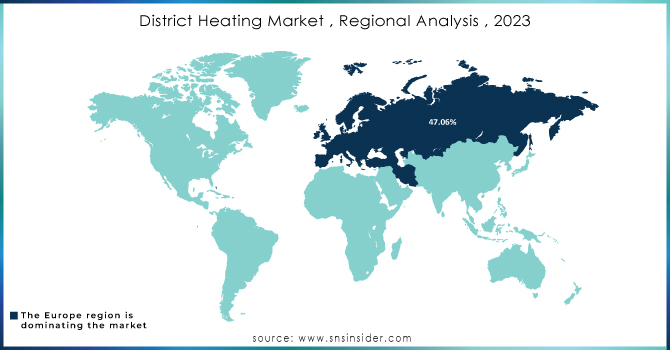
The Europe Region is dominating the market with a share of 47.06% of the total market because the region has low temperature for most of the year. Europe has a huge and established network throughout the region creating a robust foundation for its adoption of district heaters. The growth of this market is based on de-carbonization (removal or reduction of carbon dioxide from the atmosphere) and the transition to renewable energy sources.
The major key players are Vattenfall, Statkraft, Fortum, STEAG, Goteborg Energi, Shinryo Corporation, RWE, NRG Energy, Korea District Heating Corporation, Ørsted and others.
RECENT DEVELOPMENT
In February 2024: Evonik and Uniper formally launched the Technical Options for Thermal Energy Recovery (TORTE) project in Gelsenkirchen. The TORTE project will deliver industrial waste heat from isophorone generation into the district heating network. Over 1,000 homes in the Ruhr region will be delivered by the end of 2024.
In April 2023: Danfoss Group announced the new options for OEMs as it expands the Z-design range of Micro Plate Heat Exchangers; where the latest addition to the range C262L-EZD is a dual-circuit evaporator that's ideal for scroll chillers. These robust and reliable units extend the range's capability with cooling capacities now covering up to 300 kW in single circuits and up to 800 kW in dual circuits.
Report Attributes | Details |
---|---|
Market Size in 2023 | US$ 182.06 Billion |
Market Size by 2032 | US$ 263.19 Billion |
CAGR | CAGR of 4.18% From 2024 to 2032 |
Base Year | 2023 |
Forecast Period | 2024-2032 |
Historical Data | 2020-2022 |
Report Scope & Coverage | Market Size, Segments Analysis, Competitive Landscape, Regional Analysis, DROC & SWOT Analysis, Forecast Outlook |
Key Segments | • By Plant Type (Boilers, Combined Heat & Power) • By Heat Source (Coal, Natural Gas, Renewables, Oil & Petroleum Products, Geothermal) • By Application (Residential, Commercial, Industrial) |
Regional Analysis/Coverage | North America (US, Canada, Mexico), Europe (Eastern Europe [Poland, Romania, Hungary, Turkey, Rest of Eastern Europe] Western Europe] Germany, France, UK, Italy, Spain, Netherlands, Switzerland, Austria, Rest of Western Europe]), Asia Pacific (China, India, Japan, South Korea, Vietnam, Singapore, Australia, Rest of Asia Pacific), Middle East & Africa (Middle East [UAE, Egypt, Saudi Arabia, Qatar, Rest of Middle East], Africa [Nigeria, South Africa, Rest of Africa], Latin America (Brazil, Argentina, Colombia, Rest of Latin America) |
Company Profiles | Vattenfall, Statkraft, Fortum, STEAG, Goteborg Energi, Shinryo Corporation, RWE, NRG Energy, Korea District Heating Corporation, Ørsted |
Key Drivers | • The increasing focus on decreasing greenhouse gas emissions and addressing climate change is a major motivator, since district heating systems have the ability to significantly decrease carbon footprints by utilizing renewable energy sources and waste heat.
• District heating systems generally offer better energy efficiency compared to individual heating systems, leading to cost savings for consumers and lower overall energy usage. |
Restrain | • The substantial initial expenses linked to setting up district heating systems may serve as a major hindrance for certain areas or local authorities.
• The efficiency of district heating systems is reduced by heat loss through the pipe network, as thermal energy escapes before reaching end-users. |
Ans: The District Heating Market is expected to grow at a CAGR of 4.18%.
Ans: District Heating Market size was USD 182.06 Billion in 2023 and is expected to Reach USD 263.19 Billion by 2032.
Ans: Combined Heat & Power (CHP) is the dominant segment by plant type in the district heating market.
Ans: District heating systems generally offer better energy efficiency compared to individual heating systems, leading to cost savings for consumers and lower overall energy usage.
Ans: Europe is the dominant region in the district heating market.
Table of Content
1. Introduction
1.1 Market Definition
1.2 Scope (Inclusion and Exclusions)
1.3 Research Assumptions
2. Executive Summary
2.1 Market Overview
2.2 Regional Synopsis
2.3 Competitive Summary
3. Research Methodology
3.1 Top-Down Approach
3.2 Bottom-up Approach
3.3. Data Validation
3.4 Primary Interviews
4. Market Dynamics Impact Analysis
4.1 Market Driving Factors Analysis
4.1.1 Drivers
4.1.2 Restraints
4.1.3 Opportunities
4.1.4 Challenges
4.2 PESTLE Analysis
4.3 Porter’s Five Forces Model
5. Statistical Insights and Trends Reporting
5.1 Manufacturing Output, by Region, (2020-2023)
5.2 Utilization Rates, by Region, (2020-2023)
5.3 Maintenance and Downtime Metrix
5.4 Technological Adoption Rates, by Region
5.5 Export/Import Data, by Region (2023)
6. Competitive Landscape
6.1 List of Major Companies, By Region
6.2 Market Share Analysis, By Region
6.3 Product Benchmarking
6.3.1 Product specifications and features
6.3.2 Pricing
6.4 Strategic Initiatives
6.4.1 Marketing and promotional activities
6.4.2 Distribution and supply chain strategies
6.4.3 Expansion plans and new product launches
6.4.4 Strategic partnerships and collaborations
6.5 Technological Advancements
6.6 Market Positioning and Branding
7. District Heating Market Segmentation, by Plant Type
7.1 Chapter Overview
7.2 Boilers
7.2.1 Boilers Market Trends Analysis (2020-2032)
7.2.2 Boilers Market Size Estimates and Forecasts to 2032 (USD Billion)
7.3 Combined Heat & Power (CHP)
7.3.1 Combined Heat & Power (CHP) Market Trends Analysis (2020-2032)
7.3.2 Combined Heat & Power (CHP) Market Size Estimates and Forecasts to 2032 (USD Billion)
8. District Heating Market Segmentation, by Heat Source
8.1 Chapter Overview
8.2 Coal
8.2.1 Coal Market Trends Analysis (2020-2032)
8.2.2 Coal Market Size Estimates and Forecasts to 2032 (USD Billion)
8.3 Natural Gas
8.3.1 Natural Gas Market Trends Analysis (2020-2032)
8.3.2 Natural Gas Market Size Estimates and Forecasts to 2032 (USD Billion)
8.3.2.1 Renewables Market Trends Analysis (2020-2032)
8.3.2.2 Renewables Market Size Estimates and Forecasts to 2032 (USD Billion)
8.3.2.3 Geothermal Market Trends Analysis (2020-2032)
8.3.2.4 Geothermal Market Size Estimates and Forecasts to 2032 (USD Billion)
8.3.2.5 Biomass & Biofuel Market Trends Analysis (2020-2032)
8.3.2.6 Biomass & Biofuel Market Size Estimates and Forecasts to 2032 (USD Billion)
8.3.2.7 Others Market Trends Analysis (2020-2032)
8.3.2.8 Others Market Size Estimates and Forecasts to 2032 (USD Billion)
8.4 Oil & Petroleum Products Market
8.4.1 Oil & Petroleum Products Market Trends Analysis (2020-2032)
8.4.2 Oil & Petroleum Products Market Size Estimates and Forecasts to 2032 (USD Billion)
8.5 Geothermal
8.4.1 Geothermal Market Trends Analysis (2020-2032)
8.4.2 Geothermal Market Size Estimates and Forecasts to 2032 (USD Billion)
9. District Heating Market Segmentation, by Application
9.1 Chapter Overview
9.2 Residential
9.2.1 Residential Market Trends Analysis (2020-2032)
9.2.2 Residential Market Size Estimates and Forecasts to 2032 (USD Billion)
9.3 Commercial
9.3.1 Commercial Market Trends Analysis (2020-2032)
9.3.2 Commercial Market Size Estimates and Forecasts to 2032 (USD Billion)
9.4 Industrial
9.4.1 Industrial Market Trends Analysis (2020-2032)
9.4.2 Industrial Market Size Estimates and Forecasts to 2032 (USD Billion)
10. Regional Analysis
10.1 Chapter Overview
10.2 North America
10.2.1 Trends Analysis
10.2.2 North America District Heating Market Estimates and Forecasts, by Country (2020-2032) (USD Billion)
10.2.3 North America District Heating Market Estimates and Forecasts, by Plant Type (2020-2032) (USD Billion)
10.2.4 North America District Heating Market Estimates and Forecasts, by Heat Source (2020-2032) (USD Billion)
10.2.5 North America District Heating Market Estimates and Forecasts, by Application (2020-2032) (USD Billion)
10.2.6 USA
10.2.6.1 USA District Heating Market Estimates and Forecasts, by Plant Type (2020-2032) (USD Billion)
10.2.6.2 USA District Heating Market Estimates and Forecasts, by Heat Source (2020-2032) (USD Billion)
10.2.6.3 USA District Heating Market Estimates and Forecasts, by Application (2020-2032) (USD Billion)
10.2.7 Canada
10.2.7.1 Canada District Heating Market Estimates and Forecasts, by Plant Type (2020-2032) (USD Billion)
10.2.7.2 Canada District Heating Market Estimates and Forecasts, by Heat Source (2020-2032) (USD Billion)
10.2.7.3 Canada District Heating Market Estimates and Forecasts, by Application (2020-2032) (USD Billion)
10.2.8 Mexico
10.2.8.1 Mexico District Heating Market Estimates and Forecasts, by Plant Type (2020-2032) (USD Billion)
10.2.8.2 Mexico District Heating Market Estimates and Forecasts, by Heat Source (2020-2032) (USD Billion)
10.2.8.3 Mexico District Heating Market Estimates and Forecasts, by Application (2020-2032) (USD Billion)
10.3 Europe
10.3.1 Eastern Europe
10.3.1.1 Trends Analysis
10.3.1.2 Eastern Europe District Heating Market Estimates and Forecasts, by Country (2020-2032) (USD Billion)
10.3.1.3 Eastern Europe District Heating Market Estimates and Forecasts, by Plant Type (2020-2032) (USD Billion)
10.3.1.4 Eastern Europe District Heating Market Estimates and Forecasts, by Heat Source (2020-2032) (USD Billion)
10.3.1.5 Eastern Europe District Heating Market Estimates and Forecasts, by Application (2020-2032) (USD Billion)
10.3.1.6 Poland
10.3.1.6.1 Poland District Heating Market Estimates and Forecasts, by Plant Type (2020-2032) (USD Billion)
10.3.1.6.2 Poland District Heating Market Estimates and Forecasts, by Heat Source (2020-2032) (USD Billion)
10.3.1.6.3 Poland District Heating Market Estimates and Forecasts, by Application (2020-2032) (USD Billion)
10.3.1.7 Romania
10.3.1.7.1 Romania District Heating Market Estimates and Forecasts, by Plant Type (2020-2032) (USD Billion)
10.3.1.7.2 Romania District Heating Market Estimates and Forecasts, by Heat Source (2020-2032) (USD Billion)
10.3.1.7.3 Romania District Heating Market Estimates and Forecasts, by Application (2020-2032) (USD Billion)
10.3.1.8 Hungary
10.3.1.8.1 Hungary District Heating Market Estimates and Forecasts, by Plant Type (2020-2032) (USD Billion)
10.3.1.8.2 Hungary District Heating Market Estimates and Forecasts, by Heat Source (2020-2032) (USD Billion)
10.3.1.8.3 Hungary District Heating Market Estimates and Forecasts, by Application (2020-2032) (USD Billion)
10.3.1.9 Turkey
10.3.1.9.1 Turkey District Heating Market Estimates and Forecasts, by Plant Type (2020-2032) (USD Billion)
10.3.1.9.2 Turkey District Heating Market Estimates and Forecasts, by Heat Source (2020-2032) (USD Billion)
10.3.1.9.3 Turkey District Heating Market Estimates and Forecasts, by Application (2020-2032) (USD Billion)
10.3.1.10 Rest of Eastern Europe
10.3.1.10.1 Rest of Eastern Europe District Heating Market Estimates and Forecasts, by Plant Type (2020-2032) (USD Billion)
10.3.1.10.2 Rest of Eastern Europe District Heating Market Estimates and Forecasts, by Heat Source (2020-2032) (USD Billion)
10.3.1.10.3 Rest of Eastern Europe District Heating Market Estimates and Forecasts, by Application (2020-2032) (USD Billion)
10.3.2 Western Europe
10.3.2.1 Trends Analysis
10.3.2.2 Western Europe District Heating Market Estimates and Forecasts, by Country (2020-2032) (USD Billion)
10.3.2.3 Western Europe District Heating Market Estimates and Forecasts, by Plant Type (2020-2032) (USD Billion)
10.3.2.4 Western Europe District Heating Market Estimates and Forecasts, by Heat Source (2020-2032) (USD Billion)
10.3.2.5 Western Europe District Heating Market Estimates and Forecasts, by Application (2020-2032) (USD Billion)
10.3.2.6 Germany
10.3.2.6.1 Germany District Heating Market Estimates and Forecasts, by Plant Type (2020-2032) (USD Billion)
10.3.2.6.2 Germany District Heating Market Estimates and Forecasts, by Heat Source (2020-2032) (USD Billion)
10.3.2.6.3 Germany District Heating Market Estimates and Forecasts, by Application (2020-2032) (USD Billion)
10.3.2.7 France
10.3.2.7.1 France District Heating Market Estimates and Forecasts, by Plant Type (2020-2032) (USD Billion)
10.3.2.7.2 France District Heating Market Estimates and Forecasts, by Heat Source (2020-2032) (USD Billion)
10.3.2.7.3 France District Heating Market Estimates and Forecasts, by Application (2020-2032) (USD Billion)
10.3.2.8 UK
10.3.2.8.1 UK District Heating Market Estimates and Forecasts, by Plant Type (2020-2032) (USD Billion)
10.3.2.8.2 UK District Heating Market Estimates and Forecasts, by Heat Source (2020-2032) (USD Billion)
10.3.2.8.3 UK District Heating Market Estimates and Forecasts, by Application (2020-2032) (USD Billion)
10.3.2.9 Italy
10.3.2.9.1 Italy District Heating Market Estimates and Forecasts, by Plant Type (2020-2032) (USD Billion)
10.3.2.9.2 Italy District Heating Market Estimates and Forecasts, by Heat Source (2020-2032) (USD Billion)
10.3.2.9.3 Italy District Heating Market Estimates and Forecasts, by Application (2020-2032) (USD Billion)
10.3.2.10 Spain
10.3.2.10.1 Spain District Heating Market Estimates and Forecasts, by Plant Type (2020-2032) (USD Billion)
10.3.2.10.2 Spain District Heating Market Estimates and Forecasts, by Heat Source (2020-2032) (USD Billion)
10.3.2.10.3 Spain District Heating Market Estimates and Forecasts, by Application (2020-2032) (USD Billion)
10.3.2.11 Netherlands
10.3.2.11.1 Netherlands District Heating Market Estimates and Forecasts, by Plant Type (2020-2032) (USD Billion)
10.3.2.11.2 Netherlands District Heating Market Estimates and Forecasts, by Heat Source (2020-2032) (USD Billion)
10.3.2.11.3 Netherlands District Heating Market Estimates and Forecasts, by Application (2020-2032) (USD Billion)
10.3.2.12 Switzerland
10.3.2.12.1 Switzerland District Heating Market Estimates and Forecasts, by Plant Type (2020-2032) (USD Billion)
10.3.2.12.2 Switzerland District Heating Market Estimates and Forecasts, by Heat Source (2020-2032) (USD Billion)
10.3.2.12.3 Switzerland District Heating Market Estimates and Forecasts, by Application (2020-2032) (USD Billion)
10.3.2.13 Austria
10.3.2.13.1 Austria District Heating Market Estimates and Forecasts, by Plant Type (2020-2032) (USD Billion)
10.3.2.13.2 Austria District Heating Market Estimates and Forecasts, by Heat Source (2020-2032) (USD Billion)
10.3.2.13.3 Austria District Heating Market Estimates and Forecasts, by Application (2020-2032) (USD Billion)
10.3.2.14 Rest of Western Europe
10.3.2.14.1 Rest of Western Europe District Heating Market Estimates and Forecasts, by Plant Type (2020-2032) (USD Billion)
10.3.2.14.2 Rest of Western Europe District Heating Market Estimates and Forecasts, by Heat Source (2020-2032) (USD Billion)
10.3.2.14.3 Rest of Western Europe District Heating Market Estimates and Forecasts, by Application (2020-2032) (USD Billion)
10.4 Asia Pacific
10.4.1 Trends Analysis
10.4.2 Asia Pacific District Heating Market Estimates and Forecasts, by Country (2020-2032) (USD Billion)
10.4.3 Asia Pacific District Heating Market Estimates and Forecasts, by Plant Type (2020-2032) (USD Billion)
10.4.4 Asia Pacific District Heating Market Estimates and Forecasts, by Heat Source (2020-2032) (USD Billion)
10.4.5 Asia Pacific District Heating Market Estimates and Forecasts, by Application (2020-2032) (USD Billion)
10.4.6 China
10.4.6.1 China District Heating Market Estimates and Forecasts, by Plant Type (2020-2032) (USD Billion)
10.4.6.2 China District Heating Market Estimates and Forecasts, by Heat Source (2020-2032) (USD Billion)
10.4.6.3 China District Heating Market Estimates and Forecasts, by Application (2020-2032) (USD Billion)
10.4.7 India
10.4.7.1 India District Heating Market Estimates and Forecasts, by Plant Type (2020-2032) (USD Billion)
10.4.7.2 India District Heating Market Estimates and Forecasts, by Heat Source (2020-2032) (USD Billion)
10.4.7.3 India District Heating Market Estimates and Forecasts, by Application (2020-2032) (USD Billion)
10.4.8 Japan
10.4.8.1 Japan District Heating Market Estimates and Forecasts, by Plant Type (2020-2032) (USD Billion)
10.4.8.2 Japan District Heating Market Estimates and Forecasts, by Heat Source (2020-2032) (USD Billion)
10.4.8.3 Japan District Heating Market Estimates and Forecasts, by Application (2020-2032) (USD Billion)
10.4.9 South Korea
10.4.9.1 South Korea District Heating Market Estimates and Forecasts, by Plant Type (2020-2032) (USD Billion)
10.4.9.2 South Korea District Heating Market Estimates and Forecasts, by Heat Source (2020-2032) (USD Billion)
10.4.9.3 South Korea District Heating Market Estimates and Forecasts, by Application (2020-2032) (USD Billion)
10.4.10 Vietnam
10.4.10.1 Vietnam District Heating Market Estimates and Forecasts, by Plant Type (2020-2032) (USD Billion)
10.4.10.2 Vietnam District Heating Market Estimates and Forecasts, by Heat Source (2020-2032) (USD Billion)
10.4.10.3 Vietnam District Heating Market Estimates and Forecasts, by Application (2020-2032) (USD Billion)
10.4.11 Singapore
10.4.11.1 Singapore District Heating Market Estimates and Forecasts, by Plant Type (2020-2032) (USD Billion)
10.4.11.2 Singapore District Heating Market Estimates and Forecasts, by Heat Source (2020-2032) (USD Billion)
10.4.11.3 Singapore District Heating Market Estimates and Forecasts, by Application (2020-2032) (USD Billion)
10.4.12 Australia
10.4.12.1 Australia District Heating Market Estimates and Forecasts, by Plant Type (2020-2032) (USD Billion)
10.4.12.2 Australia District Heating Market Estimates and Forecasts, by Heat Source (2020-2032) (USD Billion)
10.4.12.3 Australia District Heating Market Estimates and Forecasts, by Application (2020-2032) (USD Billion)
10.4.13 Rest of Asia Pacific
10.4.13.1 Rest of Asia Pacific District Heating Market Estimates and Forecasts, by Plant Type (2020-2032) (USD Billion)
10.4.13.2 Rest of Asia Pacific District Heating Market Estimates and Forecasts, by Heat Source (2020-2032) (USD Billion)
10.4.13.3 Rest of Asia Pacific District Heating Market Estimates and Forecasts, by Application (2020-2032) (USD Billion)
10.5 Middle East and Africa
10.5.1 Middle East
10.5.1.1 Trends Analysis
10.5.1.2 Middle East District Heating Market Estimates and Forecasts, by Country (2020-2032) (USD Billion)
10.5.1.3 Middle East District Heating Market Estimates and Forecasts, by Plant Type (2020-2032) (USD Billion)
10.5.1.4 Middle East District Heating Market Estimates and Forecasts, by Heat Source (2020-2032) (USD Billion)
10.5.1.5 Middle East District Heating Market Estimates and Forecasts, by Application (2020-2032) (USD Billion)
10.5.1.6 UAE
10.5.1.6.1 UAE District Heating Market Estimates and Forecasts, by Plant Type (2020-2032) (USD Billion)
10.5.1.6.2 UAE District Heating Market Estimates and Forecasts, by Heat Source (2020-2032) (USD Billion)
10.5.1.6.3 UAE District Heating Market Estimates and Forecasts, by Application (2020-2032) (USD Billion)
10.5.1.7 Egypt
10.5.1.7.1 Egypt District Heating Market Estimates and Forecasts, by Plant Type (2020-2032) (USD Billion)
10.5.1.7.2 Egypt District Heating Market Estimates and Forecasts, by Heat Source (2020-2032) (USD Billion)
10.5.1.7.3 Egypt District Heating Market Estimates and Forecasts, by Application (2020-2032) (USD Billion)
10.5.1.8 Saudi Arabia
10.5.1.8.1 Saudi Arabia District Heating Market Estimates and Forecasts, by Plant Type (2020-2032) (USD Billion)
10.5.1.8.2 Saudi Arabia District Heating Market Estimates and Forecasts, by Heat Source (2020-2032) (USD Billion)
10.5.1.8.3 Saudi Arabia District Heating Market Estimates and Forecasts, by Application (2020-2032) (USD Billion)
10.5.1.9 Qatar
10.5.1.9.1 Qatar District Heating Market Estimates and Forecasts, by Plant Type (2020-2032) (USD Billion)
10.5.1.9.2 Qatar District Heating Market Estimates and Forecasts, by Heat Source (2020-2032) (USD Billion)
10.5.1.9.3 Qatar District Heating Market Estimates and Forecasts, by Application (2020-2032) (USD Billion)
10.5.1.10 Rest of Middle East
10.5.1.10.1 Rest of Middle East District Heating Market Estimates and Forecasts, by Plant Type (2020-2032) (USD Billion)
10.5.1.10.2 Rest of Middle East District Heating Market Estimates and Forecasts, by Heat Source (2020-2032) (USD Billion)
10.5.1.10.3 Rest of Middle East District Heating Market Estimates and Forecasts, by Application (2020-2032) (USD Billion)
10.5.2 Africa
10.5.2.1 Trends Analysis
10.5.2.2 Africa District Heating Market Estimates and Forecasts, by Country (2020-2032) (USD Billion)
10.5.2.3 Africa District Heating Market Estimates and Forecasts, by Plant Type (2020-2032) (USD Billion)
10.5.2.4 Africa District Heating Market Estimates and Forecasts, by Heat Source (2020-2032) (USD Billion)
10.5.2.5 Africa District Heating Market Estimates and Forecasts, by Application (2020-2032) (USD Billion)
10.5.2.6 South Africa
10.5.2.6.1 South Africa District Heating Market Estimates and Forecasts, by Plant Type (2020-2032) (USD Billion)
10.5.2.6.2 South Africa District Heating Market Estimates and Forecasts, by Heat Source (2020-2032) (USD Billion)
10.5.2.6.3 South Africa District Heating Market Estimates and Forecasts, by Application (2020-2032) (USD Billion)
10.5.2.7 Nigeria
10.5.2.7.1 Nigeria District Heating Market Estimates and Forecasts, by Plant Type (2020-2032) (USD Billion)
10.5.2.7.2 Nigeria District Heating Market Estimates and Forecasts, by Heat Source (2020-2032) (USD Billion)
10.5.2.7.3 Nigeria District Heating Market Estimates and Forecasts, by Application (2020-2032) (USD Billion)
10.5.2.8 Rest of Africa
10.5.2.8.1 Rest of Africa District Heating Market Estimates and Forecasts, by Plant Type (2020-2032) (USD Billion)
10.5.2.8.2 Rest of Africa District Heating Market Estimates and Forecasts, by Heat Source (2020-2032) (USD Billion)
10.5.2.8.3 Rest of Africa District Heating Market Estimates and Forecasts, by Application (2020-2032) (USD Billion)
10.6 Latin America
10.6.1 Trends Analysis
10.6.2 Latin America District Heating Market Estimates and Forecasts, by Country (2020-2032) (USD Billion)
10.6.3 Latin America District Heating Market Estimates and Forecasts, by Plant Type (2020-2032) (USD Billion)
10.6.4 Latin America District Heating Market Estimates and Forecasts, by Heat Source (2020-2032) (USD Billion)
10.6.5 Latin America District Heating Market Estimates and Forecasts, by Application (2020-2032) (USD Billion)
10.6.6 Brazil
10.6.6.1 Brazil District Heating Market Estimates and Forecasts, by Plant Type (2020-2032) (USD Billion)
10.6.6.2 Brazil District Heating Market Estimates and Forecasts, by Heat Source (2020-2032) (USD Billion)
10.6.6.3 Brazil District Heating Market Estimates and Forecasts, by Application (2020-2032) (USD Billion)
10.6.7 Argentina
10.6.7.1 Argentina District Heating Market Estimates and Forecasts, by Plant Type (2020-2032) (USD Billion)
10.6.7.2 Argentina District Heating Market Estimates and Forecasts, by Heat Source (2020-2032) (USD Billion)
10.6.7.3 Argentina District Heating Market Estimates and Forecasts, by Application (2020-2032) (USD Billion)
10.6.8 Colombia
10.6.8.1 Colombia District Heating Market Estimates and Forecasts, by Plant Type (2020-2032) (USD Billion)
10.6.8.2 Colombia District Heating Market Estimates and Forecasts, by Heat Source (2020-2032) (USD Billion)
10.6.8.3 Colombia District Heating Market Estimates and Forecasts, by Application (2020-2032) (USD Billion)
10.6.9 Rest of Latin America
10.6.9.1 Rest of Latin America District Heating Market Estimates and Forecasts, by Plant Type (2020-2032) (USD Billion)
10.6.9.2 Rest of Latin America District Heating Market Estimates and Forecasts, by Heat Source (2020-2032) (USD Billion)
10.6.9.3 Rest of Latin America District Heating Market Estimates and Forecasts, by Application (2020-2032) (USD Billion)
11. Company Profiles
11.1 Danfoss Group
11.1.1 Company Overview
11.1.2 Financial
11.1.3 Products/ Services Offered
11.1.4 SWOT Analysis
11.2 Ramboll
11.2.1 Company Overview
11.2.2 Financial
11.2.3 Products/ Services Offered
11.2.4 SWOT Analysis
11.3 Dall Energy
11.3.1 Company Overview
11.3.2 Financial
11.3.3 Products/ Services Offered
11.3.4 SWOT Analysis
11.4 Veolia
11.4.1 Company Overview
11.4.2 Financial
11.4.3 Products/ Services Offered
11.4.4 SWOT Analysis
11.5 Helen
11.5.1 Company Overview
11.5.2 Financial
11.5.3 Products/ Services Offered
11.5.4 SWOT Analysis
11.6 Alfa Level
11.6.1 Company Overview
11.6.2 Financial
11.6.3 Products/ Services Offered
11.6.4 SWOT Analysis
11.7 GE
11.7.1 Company Overview
11.7.2 Financial
11.7.3 Products/ Services Offered
11.7.4 SWOT Analysis
11.8 Statkraft
11.8.1 Company Overview
11.8.2 Financial
11.8.3 Products/ Services Offered
11.8.4 SWOT Analysis
11.9 Uniper
11.9.1 Company Overview
11.9.2 Financial
11.9.3 Products/ Services Offered
11.9.4 SWOT Analysis
11.10 ENGIE
11.10.1 Company Overview
11.10.2 Financial
11.10.3 Products/ Services Offered
11.10.4 SWOT Analysis
12. Use Cases and Best Practices
13. Conclusion
An accurate research report requires proper strategizing as well as implementation. There are multiple factors involved in the completion of good and accurate research report and selecting the best methodology to compete the research is the toughest part. Since the research reports we provide play a crucial role in any company’s decision-making process, therefore we at SNS Insider always believe that we should choose the best method which gives us results closer to reality. This allows us to reach at a stage wherein we can provide our clients best and accurate investment to output ratio.
Each report that we prepare takes a timeframe of 350-400 business hours for production. Starting from the selection of titles through a couple of in-depth brain storming session to the final QC process before uploading our titles on our website we dedicate around 350 working hours. The titles are selected based on their current market cap and the foreseen CAGR and growth.
The 5 steps process:
Step 1: Secondary Research:
Secondary Research or Desk Research is as the name suggests is a research process wherein, we collect data through the readily available information. In this process we use various paid and unpaid databases which our team has access to and gather data through the same. This includes examining of listed companies’ annual reports, Journals, SEC filling etc. Apart from this our team has access to various associations across the globe across different industries. Lastly, we have exchange relationships with various university as well as individual libraries.
Step 2: Primary Research
When we talk about primary research, it is a type of study in which the researchers collect relevant data samples directly, rather than relying on previously collected data. This type of research is focused on gaining content specific facts that can be sued to solve specific problems. Since the collected data is fresh and first hand therefore it makes the study more accurate and genuine.
We at SNS Insider have divided Primary Research into 2 parts.
Part 1 wherein we interview the KOLs of major players as well as the upcoming ones across various geographic regions. This allows us to have their view over the market scenario and acts as an important tool to come closer to the accurate market numbers. As many as 45 paid and unpaid primary interviews are taken from both the demand and supply side of the industry to make sure we land at an accurate judgement and analysis of the market.
This step involves the triangulation of data wherein our team analyses the interview transcripts, online survey responses and observation of on filed participants. The below mentioned chart should give a better understanding of the part 1 of the primary interview.
Part 2: In this part of primary research the data collected via secondary research and the part 1 of the primary research is validated with the interviews from individual consultants and subject matter experts.
Consultants are those set of people who have at least 12 years of experience and expertise within the industry whereas Subject Matter Experts are those with at least 15 years of experience behind their back within the same space. The data with the help of two main processes i.e., FGDs (Focused Group Discussions) and IDs (Individual Discussions). This gives us a 3rd party nonbiased primary view of the market scenario making it a more dependable one while collation of the data pointers.
Step 3: Data Bank Validation
Once all the information is collected via primary and secondary sources, we run that information for data validation. At our intelligence centre our research heads track a lot of information related to the market which includes the quarterly reports, the daily stock prices, and other relevant information. Our data bank server gets updated every fortnight and that is how the information which we collected using our primary and secondary information is revalidated in real time.
Step 4: QA/QC Process
After all the data collection and validation our team does a final level of quality check and quality assurance to get rid of any unwanted or undesired mistakes. This might include but not limited to getting rid of the any typos, duplication of numbers or missing of any important information. The people involved in this process include technical content writers, research heads and graphics people. Once this process is completed the title gets uploader on our platform for our clients to read it.
Step 5: Final QC/QA Process:
This is the last process and comes when the client has ordered the study. In this process a final QA/QC is done before the study is emailed to the client. Since we believe in giving our clients a good experience of our research studies, therefore, to make sure that we do not lack at our end in any way humanly possible we do a final round of quality check and then dispatch the study to the client.
Key Segments
By Plant Type
Boilers
Combined Heat & Power (CHP)
By Heat Source
Coal
Natural Gas
Renewables
Geothermal
Biomass & Biofuel
Others
Oil & Petroleum Products
Geothermal
By Application
Residential
Commercial
Industrial
Request for Segment Customization as per your Business Requirement: Segment Customization Request
Regional Coverage
North America
US
Canada
Mexico
Europe
Eastern Europe
Poland
Romania
Hungary
Turkey
Rest of Eastern Europe
Western Europe
Germany
France
UK
Italy
Spain
Netherlands
Switzerland
Austria
Rest of Western Europe
Asia Pacific
China
India
Japan
South Korea
Vietnam
Singapore
Australia
Rest of Asia Pacific
Middle East & Africa
Middle East
UAE
Egypt
Saudi Arabia
Qatar
Rest of the Middle East
Africa
Nigeria
South Africa
Rest of Africa
Latin America
Brazil
Argentina
Colombia
Rest of Latin America
Request for Country Level Research Report: Country Level Customization Request
Available Customization
With the given market data, SNS Insider offers customization as per the company’s specific needs. The following customization options are available for the report:
Product Analysis
Criss-Cross segment analysis (e.g. Product X Application)
Product Matrix which gives a detailed comparison of product portfolio of each company
Geographic Analysis
Additional countries in any of the regions
Company Information
Detailed analysis and profiling of additional market players (Up to five)
The Thermoelectric Generators Market Size was esteemed at USD 854.56 million in 2023 and is supposed to arrive at USD 1792.25 million by 2031 and develop at a CAGR of 9.7% over the forecast period 2024-2031.
The Woodworking Machinery Market size was estimated at USD 4.87 billion in 2023 and is expected to reach USD 7.42 billion by 2032 at a CAGR of 4.8% during the forecast period of 2024-2032.
The Pipeline Monitoring System Market Size was USD 15.85 Billion in 2023 and will reach USD 31.05 Billion by 2032 and grow at a CAGR of 7.80% by 2024-2032.
The Gate Openers Market size was valued at USD 2.91 Billion in 2023 and is now anticipated to grow to USD 5.30 Billion by 2032, & CAGR of 6.9% by 2024-2032
The ISO container Market size is expected to value at USD 268.49 Million in 2023 and is estimated to reach USD 566.72 Million by 2032 with a growing CAGR of 8.69% over the forecast period 2024-2032.
The Metal Shredder Machine Market size was estimated at USD 958.0 Million in 2022 and is expected to reach USD 1387.31 million by 2030 at a CAGR of 4.2% during the forecast period of 2023-2030.
Hi! Click one of our member below to chat on Phone