To Get More Information on Distribution Automation Market - Request Sample Report
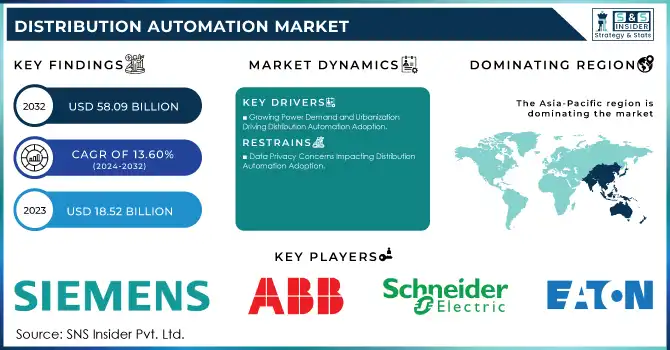
The Distribution Automation Market was valued at USD 18.52 billion in 2023 and is expected to reach USD 58.09 billion by 2032, growing at a CAGR of 13.60% from 2024-2032.
The Distribution Automation market is experiencing substantial growth, driven by the increasing need for reliable, efficient, and cost-effective energy distribution systems. Global renewable energy consumption reached 90.23 EJ, and as energy consumption rises and grid complexity grows, utilities are increasingly turning to automation solutions to ensure the stability and reliability of their infrastructure. This shift is further fueled by advancements in technologies such as smart meters, sensors, and automated control systems, which allow for more efficient power distribution management. These technologies are essential for reducing downtime, minimizing outages, and enhancing service continuity, making them integral to modern grid operations. For Instance, In October 2024, Itron launched distribution automation solutions to improve grid reliability and efficiency, further supporting the growing integration of renewable energy sources and accelerating the demand for advanced distribution automation systems.
As utilities continue to face increasing pressure to improve operational efficiency and reliability, the demand for DA systems is expected to grow even further. By the end of 2023, 1.06 billion smart meters have been installed worldwide, reflecting the growing adoption of digital solutions. With the global push toward digitalization, utilities are adopting smart grids and IoT-based technologies that enable real-time monitoring, predictive maintenance, and better load management. This shift toward automation enhances grid performance and enables utilities to optimize resources and reduce costs in the long run. Moreover, with regulatory pressures on reducing carbon footprints and improving energy efficiency, adopting DA solutions is becoming increasingly critical. In December 2024, DigiKey partnered with MediaTek to distribute power-efficient systems-on-chip supporting IoT applications, which further enhance automation solutions and grid efficiency.
Looking to the future, the Distribution Automation market holds immense opportunities driven by technological advancements. Emerging technologies like artificial intelligence, machine learning, and big data analytics are set to elevate DA systems through predictive analytics, real-time fault detection, and automated decision-making. For instance, In December 2024, Kirin Holdings introduced Sigma Synx, an AI-controlled system developed by Mitsubishi Heavy Industries, designed to reduce logistics workforce requirements by up to 50%, highlighting AI’s potential. These innovations will enhance DA systems’ capabilities and support efficient energy management, especially in sectors like electric vehicle infrastructure. The market will play a pivotal role in shaping smarter, sustainable energy systems worldwide.
Market Dynamics
Drivers
Growing Power Demand and Urbanization Driving Distribution Automation Adoption
The rapid urbanization and rising power demand, especially in emerging economies, are driving the need for smarter and more scalable grid solutions. As cities expand and populations grow, the demand for electricity surges, placing greater pressure on traditional power distribution systems. Distribution automation plays a crucial role in managing this increased demand by enabling real-time monitoring, fault detection, and adaptive energy management. With DA systems, utilities can optimize energy distribution, reduce outages, and ensure reliable power supply to densely populated urban areas. Moreover, as urban centers increasingly adopt smart technologies, DA solutions help integrate renewable energy sources and improve grid flexibility, meeting the evolving energy needs of growing cities. This shift toward automation is essential to support sustainable urban development and ensure efficient energy consumption in the face of rising demand.
Technological Innovations Driving the Advancement of Distribution Automation
Innovations in sensors, communication networks, data analytics, and artificial intelligence are transforming distribution automation, enabling smarter, more efficient grid management. IoT-based sensors provide real-time data collection, offering granular insights into grid performance and energy consumption. Advanced metering infrastructure enhances the ability to monitor and control the grid remotely, improving response times and decision-making processes. Meanwhile, AI algorithms can predict energy demand, identify potential issues, and optimize grid performance with minimal human intervention. Generative AI is also revolutionizing distribution automation by optimizing logistics, inventory management, and customer service, helping companies reduce lead times by up to 30%. These advancements allow utilities to better manage distribution networks, reduce operational costs, and enhance system reliability, offering greater scalability, flexibility, and efficiency in managing modern energy grids.
Restraints
High Initial Investment Costs in Distribution Automation Adoption
The deployment of distribution automation systems requires substantial upfront investment in advanced technologies, infrastructure upgrades, and specialized equipment. These costs can be a significant barrier, particularly for utilities in developing regions with limited budgets or competing priorities. For instance, In October 2024, METRO Inc. launched a new automated distribution center in Toronto, completing a nearly USD 1 billion supply chain modernization project, highlighting the significant investments needed for such technological advancements. The need to purchase new automation devices, sensors, communication networks, and software systems, along with the potential costs of integrating these into existing infrastructure, can create financial strain. For many utilities, the capital expenditure required for DA may outweigh the perceived short-term benefits, slowing adoption.
Data Privacy Concerns Impacting Distribution Automation Adoption
The integration of distribution automation systems relies heavily on the collection and analysis of vast amounts of data, including information from consumers and grid operations. This raises significant concerns about data privacy, ownership, and sharing. The sensitive nature of this data ranging from consumer energy usage patterns to grid performance metrics may be vulnerable to unauthorized access or misuse. Utilities and consumers alike may be hesitant to adopt DA technologies due to fears of data breaches or the loss of control over personal and operational information. In regions with strict data protection laws, utilities may face regulatory hurdles or legal challenges when implementing DA systems. As a result, these privacy concerns can slow the widespread adoption of distribution automation technologies, hindering their full potential.
By Component
In 2023, the software segment dominated the distribution automation market with the highest revenue share of approximately 44%. This dominance can be attributed to the increasing demand for advanced software solutions that enable real-time monitoring, data analytics, and automation control in grid systems. These software platforms provide utilities with the ability to optimize energy distribution, improve reliability, and enhance decision-making capabilities, making them essential in modernizing the electrical grid and driving efficiency.
The field devices segment is expected to grow at the fastest CAGR of around 14.44% from 2024 to 2032. This growth is primarily driven by the rising need for smart sensors, circuit breakers, and switches that play a critical role in automating grid operations. As the demand for more precise, real-time data collection and fault detection increases, field devices become indispensable in supporting automation systems. The growing adoption of IoT and smart grid technologies further fuels this rapid expansion, enhancing grid resilience and operational efficiency.
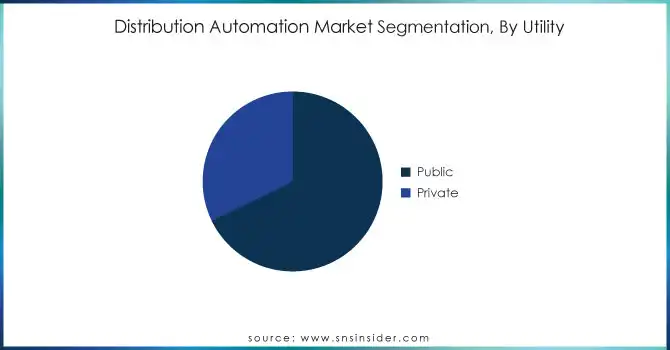
By Utility
In 2023, the public segment dominated the distribution automation market, capturing the highest revenue share of approximately 68%. This dominance stems from the substantial investments made by government utilities in modernizing electrical grids and ensuring enhanced energy distribution efficiency. Public sector entities are increasingly focusing on upgrading aging infrastructure, implementing smart grid solutions, and complying with regulatory mandates for sustainability, making them the primary adopters of distribution automation technologies.
The private segment is poised to grow at the fastest CAGR of about 15.35% from 2024 to 2032. The rapid adoption of advanced distribution automation systems by private companies is driven by the need for improved operational efficiency, cost savings, and greater flexibility. With private sector utilities focusing on innovations, reduced downtime, and more dynamic grid management, the demand for automation solutions is expected to surge, fueling significant growth in this segment over the coming years.
By Communication Technology
In 2023, the wired communication technology segment dominated the distribution automation market, accounting for approximately 67% of the revenue share. This dominance can be attributed to the established reliability and robustness of wired networks, which are critical for secure and stable communication in grid automation. Wired systems, including fiber optics and copper cables, provide high data transfer rates and minimal interference, making them ideal for large-scale, long-term infrastructure projects where consistent and secure connectivity is essential for utilities to manage energy distribution efficiently.
The wireless communication technology segment is expected to grow at the fastest CAGR of about 15.23% from 2024 to 2032. The rapid shift toward wireless solutions is driven by their flexibility, scalability, and ease of deployment. Wireless technologies, such as 5G and LoRaWAN, enable real-time data transmission across vast, distributed networks without the limitations of physical wiring. This growing demand for more agile and cost-effective solutions for smart grids and remote monitoring is positioning wireless communication as the future of distribution automation, fueling its rapid expansion.
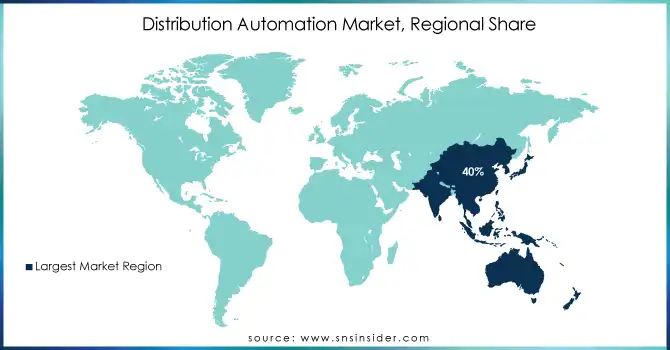
Regional Analysis
In 2023, Asia Pacific dominated the distribution automation market, holding the highest revenue share of about 40%. This dominance is largely due to the region's rapid urbanization, growing industrialization, and increasing demand for reliable electricity. Countries like China and India are heavily investing in smart grid infrastructure and grid modernization projects to improve efficiency, reduce losses, and meet the rising energy needs of their expanding populations. These initiatives, coupled with government support for sustainability and renewable energy integration, have driven the widespread adoption of distribution automation technologies in the region.
North America is expected to grow at the fastest CAGR of around 15.05% from 2024 to 2032. This growth is fueled by ongoing investments in smart grid systems, technological advancements, and a strong focus on enhancing grid resilience. The region's utilities are increasingly adopting distribution automation to address the challenges of aging infrastructure, integrate renewable energy, and improve operational efficiency. With favorable government policies and a growing emphasis on sustainability, North America is poised for rapid expansion in the distribution automation market in the coming years.
Do You Need any Customization Research on Distribution Automation Market - Enquire Now
Siemens AG (SICAM A8000, Ruggedcom Switches)
ABB (Relion Protection Relays, Grid Automation Controllers)
General Electric Company (GE) (Multilin Relays, Grid IQ Solutions)
Schneider Electric SE (Easergy T300, EcoStruxure Grid)
Landis+Gyr (Gridstream Advanced Metering, Load Control Switches)
Power System Engineering (Distribution System Studies, DER Integration Services)
S&C Electric Company (TripSaver II Reclosers, IntelliRupter Fault Interrupters)
Cisco Systems, Inc. (Industrial Ethernet 5000 Series, Catalyst 9300 Switches)
Xylem Inc. (Sensus Stratus Meters, AMI Solutions)
Eaton (Cooper Form 6 Recloser Controls, Yukon Feeder Automation)
Itron Inc. (OpenWay Riva, CENTRON Meters)
Hubbell (Quazite Underground Enclosures, Power Systems Reclosers)
CE Power Engineered Services (Protection Relay Testing, Substation Automation Solutions)
G&W Electric (Vista Underground Distribution Switchgear, Lazer Automation Solutions)
Beckwith Electric (M-7679 Tapchanger Control, M-6200A Recloser Control)
Toshiba (Distribution Transformers, Gridstream Metering Solutions)
Mitsubishi Electric (Digital Substation Automation Systems, Static Var Compensators (SVC))
Minsait ACS (PRISM SCADA, Centrix Feeder Automation)
Ingeteam (INGEPAC EF Protective Relays, Distribution Automation Systems)
Kalkitech (SYNC Gateways, Grid Automation Solutions)
Trilliant Holdings (Smart Metering Solutions, SecureMesh WAN)
Recent Developments:
In 2024, Siemens launched the SICAM Enhanced Grid Sensor (EGS), a solution designed to improve transparency and efficiency in power distribution networks. It enhances grid monitoring and supports the integration of renewable energy, advancing distribution automation efforts.
In December 2024, ABB opened a Technology Hub in London to showcase its smart power distribution and building automation solutions, offering interactive demonstrations to enhance customer engagement and technical training.
In February 2024, GE Vernova secured multi-million dollar orders from Power Grid Corporation of India (PGCIL) for 765 kV Shunt Reactors, supporting India's energy transition and renewable integration goals.
Report Attributes | Details |
---|---|
Market Size in 2023 | USD 18.52 Billion |
Market Size by 2032 | USD 58.09 Billion |
CAGR | CAGR of 13.60% From 2024 to 2032 |
Base Year | 2023 |
Forecast Period | 2024-2032 |
Historical Data | 2020-2022 |
Report Scope & Coverage | Market Size, Segments Analysis, Competitive Landscape, Regional Analysis, DROC & SWOT Analysis, Forecast Outlook |
Key Segments | • By Component (Software, Hardware, Field Devices) • By Communication Technology (Wired, Wireless) • By Utility (Public, Private) |
Regional Analysis/Coverage | North America (US, Canada, Mexico), Europe (Eastern Europe [Poland, Romania, Hungary, Turkey, Rest of Eastern Europe] Western Europe] Germany, France, UK, Italy, Spain, Netherlands, Switzerland, Austria, Rest of Western Europe]), Asia Pacific (China, India, Japan, South Korea, Vietnam, Singapore, Australia, Rest of Asia Pacific), Middle East & Africa (Middle East [UAE, Egypt, Saudi Arabia, Qatar, Rest of Middle East], Africa [Nigeria, South Africa, Rest of Africa], Latin America (Brazil, Argentina, Colombia, Rest of Latin America) |
Company Profiles | Siemens AG, ABB, General Electric Company (GE), Schneider Electric SE, Landis+Gyr, Power System Engineering, S&C Electric Company, Cisco Systems, Inc., Xylem Inc., Eaton, Itron Inc., Hubbell, CE Power Engineered Services, G&W Electric, Beckwith Electric, Toshiba, Mitsubishi Electric, Minsait ACS, Ingeteam, Kalkitech, Trilliant Holdings |
Key Drivers | • Growing Power Demand and Urbanization Driving Distribution Automation Adoption • Technological Innovations Driving the Advancement of Distribution Automation |
RESTRAINTS | • High Initial Investment Costs in Distribution Automation Adoption • Data Privacy Concerns Impacting Distribution Automation Adoption |
Ans: Distribution Automation Market was valued at USD 18.52 billion in 2023 and is expected to reach USD 58.09 billion by 2032, growing at a CAGR of 13.60% from 2024-2032.
Ans: The field devices segment is expected to grow at the fastest CAGR of around 14.44% from 2024 to 2032.
Ans: Asia Pacific dominated the market, holding the highest market share of about 40%.
Ans: Generative AI is optimizing logistics, inventory management, and customer service, helping companies reduce lead times by up to 30%.
Ans: North America is expected to grow at the fastest CAGR of around 15.05% from 2024 to 2032.
Table of Contents
1. Introduction
1.1 Market Definition
1.2 Scope (Inclusion and Exclusions)
1.3 Research Assumptions
2. Executive Summary
2.1 Market Overview
2.2 Regional Synopsis
2.3 Competitive Summary
3. Research Methodology
3.1 Top-Down Approach
3.2 Bottom-up Approach
3.3. Data Validation
3.4 Primary Interviews
4. Market Dynamics Impact Analysis
4.1 Market Driving Factors Analysis
4.1.1 Drivers
4.1.2 Restraints
4.2 PESTLE Analysis
4.3 Porter’s Five Forces Model
5. Statistical Insights and Trends Reporting
5.1 Adoption Rates of Emerging Technologies
5.2 Network Infrastructure Expansion, by Region
5.3 Impact of AI on Operational Efficiency
5.4 Technological Integration in Distribution Systems
6. Competitive Landscape
6.1 List of Major Companies, By Region
6.2 Market Share Analysis, By Region
6.3 Product Benchmarking
6.3.1 Product specifications and features
6.3.2 Pricing
6.4 Strategic Initiatives
6.4.1 Marketing and promotional activities
6.4.2 Distribution and supply chain strategies
6.4.3 Expansion plans and new product launches
6.4.4 Strategic partnerships and collaborations
6.5 Technological Advancements
6.6 Market Positioning and Branding
7. Distribution Automation Market Segmentation, By Component
7.1 Chapter Overview
7.2 Software
7.2.1 Software Market Trends Analysis (2020-2032)
7.2.2 Software Market Size Estimates and Forecasts to 2032 (USD Billion)
7.3 Hardware
7.3.1 Hardware Market Trends Analysis (2020-2032)
7.3.2 Hardware Market Size Estimates and Forecasts to 2032 (USD Billion)
7.4 Field Devices
7.4.1 Field Devices Market Trends Analysis (2020-2032)
7.4.2 Field Devices Market Size Estimates and Forecasts to 2032 (USD Billion)
8. Distribution Automation Market Segmentation, By Communication Technology
8.1 Chapter Overview
8.2 Wired
8.2.1 Wired Market Trends Analysis (2020-2032)
8.2.2 Wired Market Size Estimates and Forecasts to 2032 (USD Billion)
8.3 Wireless
8.3.1 Wireless Market Trends Analysis (2020-2032)
8.3.2 Wireless Market Size Estimates and Forecasts to 2032 (USD Billion)
9. Distribution Automation Market Segmentation, By Utility
9.1 Chapter Overview
9.2 Public
9.2.1 Public Market Trends Analysis (2020-2032)
9.2.2 Public Market Size Estimates and Forecasts to 2032 (USD Billion)
9.3 Private
9.3.1 Private Market Trends Analysis (2020-2032)
9.3.2 Private Market Size Estimates and Forecasts to 2032 (USD Billion)
10. Regional Analysis
10.1 Chapter Overview
10.2 North America
10.2.1 Trends Analysis
10.2.2 North America Distribution Automation Market Estimates and Forecasts, by Country (2020-2032) (USD Billion)
10.2.3 North America Distribution Automation Market Estimates and Forecasts, By Component (2020-2032) (USD Billion)
10.2.4 North America Distribution Automation Market Estimates and Forecasts, By Communication Technology (2020-2032) (USD Billion)
10.2.5 North America Distribution Automation Market Estimates and Forecasts, By Utility (2020-2032) (USD Billion)
10.2.6 USA
10.2.6.1 USA Distribution Automation Market Estimates and Forecasts, By Component (2020-2032) (USD Billion)
10.2.6.2 USA Distribution Automation Market Estimates and Forecasts, By Communication Technology (2020-2032) (USD Billion)
10.2.6.3 USA Distribution Automation Market Estimates and Forecasts, By Utility (2020-2032) (USD Billion)
10.2.7 Canada
10.2.7.1 Canada Distribution Automation Market Estimates and Forecasts, By Component (2020-2032) (USD Billion)
10.2.7.2 Canada Distribution Automation Market Estimates and Forecasts, By Communication Technology (2020-2032) (USD Billion)
10.2.7.3 Canada Distribution Automation Market Estimates and Forecasts, By Utility (2020-2032) (USD Billion)
10.2.8 Mexico
10.2.8.1 Mexico Distribution Automation Market Estimates and Forecasts, By Component (2020-2032) (USD Billion)
10.2.8.2 Mexico Distribution Automation Market Estimates and Forecasts, By Communication Technology (2020-2032) (USD Billion)
10.2.8.3 Mexico Distribution Automation Market Estimates and Forecasts, By Utility (2020-2032) (USD Billion)
10.3 Europe
10.3.1 Eastern Europe
10.3.1.1 Trends Analysis
10.3.1.2 Eastern Europe Distribution Automation Market Estimates and Forecasts, by Country (2020-2032) (USD Billion)
10.3.1.3 Eastern Europe Distribution Automation Market Estimates and Forecasts, By Component (2020-2032) (USD Billion)
10.3.1.4 Eastern Europe Distribution Automation Market Estimates and Forecasts, By Communication Technology (2020-2032) (USD Billion)
10.3.1.5 Eastern Europe Distribution Automation Market Estimates and Forecasts, By Utility (2020-2032) (USD Billion)
10.3.1.6 Poland
10.3.1.6.1 Poland Distribution Automation Market Estimates and Forecasts, By Component (2020-2032) (USD Billion)
10.3.1.6.2 Poland Distribution Automation Market Estimates and Forecasts, By Communication Technology (2020-2032) (USD Billion)
10.3.1.6.3 Poland Distribution Automation Market Estimates and Forecasts, By Utility (2020-2032) (USD Billion)
10.3.1.7 Romania
10.3.1.7.1 Romania Distribution Automation Market Estimates and Forecasts, By Component (2020-2032) (USD Billion)
10.3.1.7.2 Romania Distribution Automation Market Estimates and Forecasts, By Communication Technology (2020-2032) (USD Billion)
10.3.1.7.3 Romania Distribution Automation Market Estimates and Forecasts, By Utility (2020-2032) (USD Billion)
10.3.1.8 Hungary
10.3.1.8.1 Hungary Distribution Automation Market Estimates and Forecasts, By Component (2020-2032) (USD Billion)
10.3.1.8.2 Hungary Distribution Automation Market Estimates and Forecasts, By Communication Technology (2020-2032) (USD Billion)
10.3.1.8.3 Hungary Distribution Automation Market Estimates and Forecasts, By Utility (2020-2032) (USD Billion)
10.3.1.9 Turkey
10.3.1.9.1 Turkey Distribution Automation Market Estimates and Forecasts, By Component (2020-2032) (USD Billion)
10.3.1.9.2 Turkey Distribution Automation Market Estimates and Forecasts, By Communication Technology (2020-2032) (USD Billion)
10.3.1.9.3 Turkey Distribution Automation Market Estimates and Forecasts, By Utility (2020-2032) (USD Billion)
10.3.1.10 Rest of Eastern Europe
10.3.1.10.1 Rest of Eastern Europe Distribution Automation Market Estimates and Forecasts, By Component (2020-2032) (USD Billion)
10.3.1.10.2 Rest of Eastern Europe Distribution Automation Market Estimates and Forecasts, By Communication Technology (2020-2032) (USD Billion)
10.3.1.10.3 Rest of Eastern Europe Distribution Automation Market Estimates and Forecasts, By Utility (2020-2032) (USD Billion)
10.3.2 Western Europe
10.3.2.1 Trends Analysis
10.3.2.2 Western Europe Distribution Automation Market Estimates and Forecasts, by Country (2020-2032) (USD Billion)
10.3.2.3 Western Europe Distribution Automation Market Estimates and Forecasts, By Component (2020-2032) (USD Billion)
10.3.2.4 Western Europe Distribution Automation Market Estimates and Forecasts, By Communication Technology (2020-2032) (USD Billion)
10.3.2.5 Western Europe Distribution Automation Market Estimates and Forecasts, By Utility (2020-2032) (USD Billion)
10.3.2.6 Germany
10.3.2.6.1 Germany Distribution Automation Market Estimates and Forecasts, By Component (2020-2032) (USD Billion)
10.3.2.6.2 Germany Distribution Automation Market Estimates and Forecasts, By Communication Technology (2020-2032) (USD Billion)
10.3.2.6.3 Germany Distribution Automation Market Estimates and Forecasts, By Utility (2020-2032) (USD Billion)
10.3.2.7 France
10.3.2.7.1 France Distribution Automation Market Estimates and Forecasts, By Component (2020-2032) (USD Billion)
10.3.2.7.2 France Distribution Automation Market Estimates and Forecasts, By Communication Technology (2020-2032) (USD Billion)
10.3.2.7.3 France Distribution Automation Market Estimates and Forecasts, By Utility (2020-2032) (USD Billion)
10.3.2.8 UK
10.3.2.8.1 UK Distribution Automation Market Estimates and Forecasts, By Component (2020-2032) (USD Billion)
10.3.2.8.2 UK Distribution Automation Market Estimates and Forecasts, By Communication Technology (2020-2032) (USD Billion)
10.3.2.8.3 UK Distribution Automation Market Estimates and Forecasts, By Utility (2020-2032) (USD Billion)
10.3.2.9 Italy
10.3.2.9.1 Italy Distribution Automation Market Estimates and Forecasts, By Component (2020-2032) (USD Billion)
10.3.2.9.2 Italy Distribution Automation Market Estimates and Forecasts, By Communication Technology (2020-2032) (USD Billion)
10.3.2.9.3 Italy Distribution Automation Market Estimates and Forecasts, By Utility (2020-2032) (USD Billion)
10.3.2.10 Spain
10.3.2.10.1 Spain Distribution Automation Market Estimates and Forecasts, By Component (2020-2032) (USD Billion)
10.3.2.10.2 Spain Distribution Automation Market Estimates and Forecasts, By Communication Technology (2020-2032) (USD Billion)
10.3.2.10.3 Spain Distribution Automation Market Estimates and Forecasts, By Utility (2020-2032) (USD Billion)
10.3.2.11 Netherlands
10.3.2.11.1 Netherlands Distribution Automation Market Estimates and Forecasts, By Component (2020-2032) (USD Billion)
10.3.2.11.2 Netherlands Distribution Automation Market Estimates and Forecasts, By Communication Technology (2020-2032) (USD Billion)
10.3.2.11.3 Netherlands Distribution Automation Market Estimates and Forecasts, By Utility (2020-2032) (USD Billion)
10.3.2.12 Switzerland
10.3.2.12.1 Switzerland Distribution Automation Market Estimates and Forecasts, By Component (2020-2032) (USD Billion)
10.3.2.12.2 Switzerland Distribution Automation Market Estimates and Forecasts, By Communication Technology (2020-2032) (USD Billion)
10.3.2.12.3 Switzerland Distribution Automation Market Estimates and Forecasts, By Utility (2020-2032) (USD Billion)
10.3.2.13 Austria
10.3.2.13.1 Austria Distribution Automation Market Estimates and Forecasts, By Component (2020-2032) (USD Billion)
10.3.2.13.2 Austria Distribution Automation Market Estimates and Forecasts, By Communication Technology (2020-2032) (USD Billion)
10.3.2.13.3 Austria Distribution Automation Market Estimates and Forecasts, By Utility (2020-2032) (USD Billion)
10.3.2.14 Rest of Western Europe
10.3.2.14.1 Rest of Western Europe Distribution Automation Market Estimates and Forecasts, By Component (2020-2032) (USD Billion)
10.3.2.14.2 Rest of Western Europe Distribution Automation Market Estimates and Forecasts, By Communication Technology (2020-2032) (USD Billion)
10.3.2.14.3 Rest of Western Europe Distribution Automation Market Estimates and Forecasts, By Utility (2020-2032) (USD Billion)
10.4 Asia Pacific
10.4.1 Trends Analysis
10.4.2 Asia Pacific Distribution Automation Market Estimates and Forecasts, by Country (2020-2032) (USD Billion)
10.4.3 Asia Pacific Distribution Automation Market Estimates and Forecasts, By Component (2020-2032) (USD Billion)
10.4.4 Asia Pacific Distribution Automation Market Estimates and Forecasts, By Communication Technology (2020-2032) (USD Billion)
10.4.5 Asia Pacific Distribution Automation Market Estimates and Forecasts, By Utility (2020-2032) (USD Billion)
10.4.6 China
10.4.6.1 China Distribution Automation Market Estimates and Forecasts, By Component (2020-2032) (USD Billion)
10.4.6.2 China Distribution Automation Market Estimates and Forecasts, By Communication Technology (2020-2032) (USD Billion)
10.4.6.3 China Distribution Automation Market Estimates and Forecasts, By Utility (2020-2032) (USD Billion)
10.4.7 India
10.4.7.1 India Distribution Automation Market Estimates and Forecasts, By Component (2020-2032) (USD Billion)
10.4.7.2 India Distribution Automation Market Estimates and Forecasts, By Communication Technology (2020-2032) (USD Billion)
10.4.7.3 India Distribution Automation Market Estimates and Forecasts, By Utility (2020-2032) (USD Billion)
10.4.8 Japan
10.4.8.1 Japan Distribution Automation Market Estimates and Forecasts, By Component (2020-2032) (USD Billion)
10.4.8.2 Japan Distribution Automation Market Estimates and Forecasts, By Communication Technology (2020-2032) (USD Billion)
10.4.8.3 Japan Distribution Automation Market Estimates and Forecasts, By Utility (2020-2032) (USD Billion)
10.4.9 South Korea
10.4.9.1 South Korea Distribution Automation Market Estimates and Forecasts, By Component (2020-2032) (USD Billion)
10.4.9.2 South Korea Distribution Automation Market Estimates and Forecasts, By Communication Technology (2020-2032) (USD Billion)
10.4.9.3 South Korea Distribution Automation Market Estimates and Forecasts, By Utility (2020-2032) (USD Billion)
10.4.10 Vietnam
10.4.10.1 Vietnam Distribution Automation Market Estimates and Forecasts, By Component (2020-2032) (USD Billion)
10.4.10.2 Vietnam Distribution Automation Market Estimates and Forecasts, By Communication Technology (2020-2032) (USD Billion)
10.4.10.3 Vietnam Distribution Automation Market Estimates and Forecasts, By Utility (2020-2032) (USD Billion)
10.4.11 Singapore
10.4.11.1 Singapore Distribution Automation Market Estimates and Forecasts, By Component (2020-2032) (USD Billion)
10.4.11.2 Singapore Distribution Automation Market Estimates and Forecasts, By Communication Technology (2020-2032) (USD Billion)
10.4.11.3 Singapore Distribution Automation Market Estimates and Forecasts, By Utility (2020-2032) (USD Billion)
10.4.12 Australia
10.4.12.1 Australia Distribution Automation Market Estimates and Forecasts, By Component (2020-2032) (USD Billion)
10.4.12.2 Australia Distribution Automation Market Estimates and Forecasts, By Communication Technology (2020-2032) (USD Billion)
10.4.12.3 Australia Distribution Automation Market Estimates and Forecasts, By Utility (2020-2032) (USD Billion)
10.4.13 Rest of Asia Pacific
10.4.13.1 Rest of Asia Pacific Distribution Automation Market Estimates and Forecasts, By Component (2020-2032) (USD Billion)
10.4.13.2 Rest of Asia Pacific Distribution Automation Market Estimates and Forecasts, By Communication Technology (2020-2032) (USD Billion)
10.4.13.3 Rest of Asia Pacific Distribution Automation Market Estimates and Forecasts, By Utility (2020-2032) (USD Billion)
10.5 Middle East and Africa
10.5.1 Middle East
10.5.1.1 Trends Analysis
10.5.1.2 Middle East Distribution Automation Market Estimates and Forecasts, by Country (2020-2032) (USD Billion)
10.5.1.3 Middle East Distribution Automation Market Estimates and Forecasts, By Component (2020-2032) (USD Billion)
10.5.1.4 Middle East Distribution Automation Market Estimates and Forecasts, By Communication Technology (2020-2032) (USD Billion)
10.5.1.5 Middle East Distribution Automation Market Estimates and Forecasts, By Utility (2020-2032) (USD Billion)
10.5.1.6 UAE
10.5.1.6.1 UAE Distribution Automation Market Estimates and Forecasts, By Component (2020-2032) (USD Billion)
10.5.1.6.2 UAE Distribution Automation Market Estimates and Forecasts, By Communication Technology (2020-2032) (USD Billion)
10.5.1.6.3 UAE Distribution Automation Market Estimates and Forecasts, By Utility (2020-2032) (USD Billion)
10.5.1.7 Egypt
10.5.1.7.1 Egypt Distribution Automation Market Estimates and Forecasts, By Component (2020-2032) (USD Billion)
10.5.1.7.2 Egypt Distribution Automation Market Estimates and Forecasts, By Communication Technology (2020-2032) (USD Billion)
10.5.1.7.3 Egypt Distribution Automation Market Estimates and Forecasts, By Utility (2020-2032) (USD Billion)
10.5.1.8 Saudi Arabia
10.5.1.8.1 Saudi Arabia Distribution Automation Market Estimates and Forecasts, By Component (2020-2032) (USD Billion)
10.5.1.8.2 Saudi Arabia Distribution Automation Market Estimates and Forecasts, By Communication Technology (2020-2032) (USD Billion)
10.5.1.8.3 Saudi Arabia Distribution Automation Market Estimates and Forecasts, By Utility (2020-2032) (USD Billion)
10.5.1.9 Qatar
10.5.1.9.1 Qatar Distribution Automation Market Estimates and Forecasts, By Component (2020-2032) (USD Billion)
10.5.1.9.2 Qatar Distribution Automation Market Estimates and Forecasts, By Communication Technology (2020-2032) (USD Billion)
10.5.1.9.3 Qatar Distribution Automation Market Estimates and Forecasts, By Utility (2020-2032) (USD Billion)
10.5.1.10 Rest of Middle East
10.5.1.10.1 Rest of Middle East Distribution Automation Market Estimates and Forecasts, By Component (2020-2032) (USD Billion)
10.5.1.10.2 Rest of Middle East Distribution Automation Market Estimates and Forecasts, By Communication Technology (2020-2032) (USD Billion)
10.5.1.10.3 Rest of Middle East Distribution Automation Market Estimates and Forecasts, By Utility (2020-2032) (USD Billion)
10.5.2 Africa
10.5.2.1 Trends Analysis
10.5.2.2 Africa Distribution Automation Market Estimates and Forecasts, by Country (2020-2032) (USD Billion)
10.5.2.3 Africa Distribution Automation Market Estimates and Forecasts, By Component (2020-2032) (USD Billion)
10.5.2.4 Africa Distribution Automation Market Estimates and Forecasts, By Communication Technology (2020-2032) (USD Billion)
10.5.2.5 Africa Distribution Automation Market Estimates and Forecasts, By Utility (2020-2032) (USD Billion)
10.5.2.6 South Africa
10.5.2.6.1 South Africa Distribution Automation Market Estimates and Forecasts, By Component (2020-2032) (USD Billion)
10.5.2.6.2 South Africa Distribution Automation Market Estimates and Forecasts, By Communication Technology (2020-2032) (USD Billion)
10.5.2.6.3 South Africa Distribution Automation Market Estimates and Forecasts, By Utility (2020-2032) (USD Billion)
10.5.2.7 Nigeria
10.5.2.7.1 Nigeria Distribution Automation Market Estimates and Forecasts, By Component (2020-2032) (USD Billion)
10.5.2.7.2 Nigeria Distribution Automation Market Estimates and Forecasts, By Communication Technology (2020-2032) (USD Billion)
10.5.2.7.3 Nigeria Distribution Automation Market Estimates and Forecasts, By Utility (2020-2032) (USD Billion)
10.5.2.8 Rest of Africa
10.5.2.8.1 Rest of Africa Distribution Automation Market Estimates and Forecasts, By Component (2020-2032) (USD Billion)
10.5.2.8.2 Rest of Africa Distribution Automation Market Estimates and Forecasts, By Communication Technology (2020-2032) (USD Billion)
10.5.2.8.3 Rest of Africa Distribution Automation Market Estimates and Forecasts, By Utility (2020-2032) (USD Billion)
10.6 Latin America
10.6.1 Trends Analysis
10.6.2 Latin America Distribution Automation Market Estimates and Forecasts, by Country (2020-2032) (USD Billion)
10.6.3 Latin America Distribution Automation Market Estimates and Forecasts, By Component (2020-2032) (USD Billion)
10.6.4 Latin America Distribution Automation Market Estimates and Forecasts, By Communication Technology (2020-2032) (USD Billion)
10.6.5 Latin America Distribution Automation Market Estimates and Forecasts, By Utility (2020-2032) (USD Billion)
10.6.6 Brazil
10.6.6.1 Brazil Distribution Automation Market Estimates and Forecasts, By Component (2020-2032) (USD Billion)
10.6.6.2 Brazil Distribution Automation Market Estimates and Forecasts, By Communication Technology (2020-2032) (USD Billion)
10.6.6.3 Brazil Distribution Automation Market Estimates and Forecasts, By Utility (2020-2032) (USD Billion)
10.6.7 Argentina
10.6.7.1 Argentina Distribution Automation Market Estimates and Forecasts, By Component (2020-2032) (USD Billion)
10.6.7.2 Argentina Distribution Automation Market Estimates and Forecasts, By Communication Technology (2020-2032) (USD Billion)
10.6.7.3 Argentina Distribution Automation Market Estimates and Forecasts, By Utility (2020-2032) (USD Billion)
10.6.8 Colombia
10.6.8.1 Colombia Distribution Automation Market Estimates and Forecasts, By Component (2020-2032) (USD Billion)
10.6.8.2 Colombia Distribution Automation Market Estimates and Forecasts, By Communication Technology (2020-2032) (USD Billion)
10.6.8.3 Colombia Distribution Automation Market Estimates and Forecasts, By Utility (2020-2032) (USD Billion)
10.6.9 Rest of Latin America
10.6.9.1 Rest of Latin America Distribution Automation Market Estimates and Forecasts, By Component (2020-2032) (USD Billion)
10.6.9.2 Rest of Latin America Distribution Automation Market Estimates and Forecasts, By Communication Technology (2020-2032) (USD Billion)
10.6.9.3 Rest of Latin America Distribution Automation Market Estimates and Forecasts, By Utility (2020-2032) (USD Billion)
11. Company Profiles
11.1 Siemens AG
11.1.1 Company Overview
11.1.2 Financial
11.1.3 Products/ Services Offered
11.1.4 SWOT Analysis
11.2 ABB
11.2.1 Company Overview
11.2.2 Financial
11.2.3 Products/ Services Offered
11.2.4 SWOT Analysis
11.3 General Electric Company (GE)
11.3.1 Company Overview
11.3.2 Financial
11.3.3 Products/ Services Offered
11.3.4 SWOT Analysis
11.4 Schneider Electric SE
11.4.1 Company Overview
11.4.2 Financial
11.4.3 Products/ Services Offered
11.4.4 SWOT Analysis
11.5 Landis+Gyr
11.5.1 Company Overview
11.5.2 Financial
11.5.3 Products/ Services Offered
11.5.4 SWOT Analysis
11.6 Power System Engineering
11.6.1 Company Overview
11.6.2 Financial
11.6.3 Products/ Services Offered
11.6.4 SWOT Analysis
11.7 S&C Electric Company
11.7.1 Company Overview
11.7.2 Financial
11.7.3 Products/ Services Offered
11.7.4 SWOT Analysis
11.8 Cisco Systems, Inc.
11.8.1 Company Overview
11.8.2 Financial
11.8.3 Products/ Services Offered
11.8.4 SWOT Analysis
11.9 Xylem Inc.
11.9.1 Company Overview
11.9.2 Financial
11.9.3 Products/ Services Offered
11.9.4 SWOT Analysis
11.10 Eaton
11.10.1 Company Overview
11.10.2 Financial
11.10.3 Products/ Services Offered
11.10.4 SWOT Analysis
12. Use Cases and Best Practices
13. Conclusion
An accurate research report requires proper strategizing as well as implementation. There are multiple factors involved in the completion of good and accurate research report and selecting the best methodology to compete the research is the toughest part. Since the research reports we provide play a crucial role in any company’s decision-making process, therefore we at SNS Insider always believe that we should choose the best method which gives us results closer to reality. This allows us to reach at a stage wherein we can provide our clients best and accurate investment to output ratio.
Each report that we prepare takes a timeframe of 350-400 business hours for production. Starting from the selection of titles through a couple of in-depth brain storming session to the final QC process before uploading our titles on our website we dedicate around 350 working hours. The titles are selected based on their current market cap and the foreseen CAGR and growth.
The 5 steps process:
Step 1: Secondary Research:
Secondary Research or Desk Research is as the name suggests is a research process wherein, we collect data through the readily available information. In this process we use various paid and unpaid databases which our team has access to and gather data through the same. This includes examining of listed companies’ annual reports, Journals, SEC filling etc. Apart from this our team has access to various associations across the globe across different industries. Lastly, we have exchange relationships with various university as well as individual libraries.
Step 2: Primary Research
When we talk about primary research, it is a type of study in which the researchers collect relevant data samples directly, rather than relying on previously collected data. This type of research is focused on gaining content specific facts that can be sued to solve specific problems. Since the collected data is fresh and first hand therefore it makes the study more accurate and genuine.
We at SNS Insider have divided Primary Research into 2 parts.
Part 1 wherein we interview the KOLs of major players as well as the upcoming ones across various geographic regions. This allows us to have their view over the market scenario and acts as an important tool to come closer to the accurate market numbers. As many as 45 paid and unpaid primary interviews are taken from both the demand and supply side of the industry to make sure we land at an accurate judgement and analysis of the market.
This step involves the triangulation of data wherein our team analyses the interview transcripts, online survey responses and observation of on filed participants. The below mentioned chart should give a better understanding of the part 1 of the primary interview.
Part 2: In this part of primary research the data collected via secondary research and the part 1 of the primary research is validated with the interviews from individual consultants and subject matter experts.
Consultants are those set of people who have at least 12 years of experience and expertise within the industry whereas Subject Matter Experts are those with at least 15 years of experience behind their back within the same space. The data with the help of two main processes i.e., FGDs (Focused Group Discussions) and IDs (Individual Discussions). This gives us a 3rd party nonbiased primary view of the market scenario making it a more dependable one while collation of the data pointers.
Step 3: Data Bank Validation
Once all the information is collected via primary and secondary sources, we run that information for data validation. At our intelligence centre our research heads track a lot of information related to the market which includes the quarterly reports, the daily stock prices, and other relevant information. Our data bank server gets updated every fortnight and that is how the information which we collected using our primary and secondary information is revalidated in real time.
Step 4: QA/QC Process
After all the data collection and validation our team does a final level of quality check and quality assurance to get rid of any unwanted or undesired mistakes. This might include but not limited to getting rid of the any typos, duplication of numbers or missing of any important information. The people involved in this process include technical content writers, research heads and graphics people. Once this process is completed the title gets uploader on our platform for our clients to read it.
Step 5: Final QC/QA Process:
This is the last process and comes when the client has ordered the study. In this process a final QA/QC is done before the study is emailed to the client. Since we believe in giving our clients a good experience of our research studies, therefore, to make sure that we do not lack at our end in any way humanly possible we do a final round of quality check and then dispatch the study to the client.
Key Segments:
By Component
Software
Hardware
Field Devices
By Communication Technology
Wired
Wireless
By Utility
Public
Private
Request for Segment Customization as per your Business Requirement: Segment Customization Request
Regional Coverage:
North America
US
Canada
Mexico
Europe
Eastern Europe
Poland
Romania
Hungary
Turkey
Rest of Eastern Europe
Western Europe
Germany
France
UK
Italy
Spain
Netherlands
Switzerland
Austria
Rest of Western Europe
Asia Pacific
China
India
Japan
South Korea
Vietnam
Singapore
Australia
Rest of Asia Pacific
Middle East & Africa
Middle East
UAE
Egypt
Saudi Arabia
Qatar
Rest of the Middle East
Africa
Nigeria
South Africa
Rest of Africa
Latin America
Brazil
Argentina
Colombia
Rest of Latin America
Request for Country Level Research Report: Country Level Customization Request
Available Customization
With the given market data, SNS Insider offers customization as per the company’s specific needs. The following customization options are available for the report:
Product Analysis
Criss-Cross segment analysis (e.g. Product X Application)
Product Matrix which gives a detailed comparison of the product portfolio of each company
Geographic Analysis
Additional countries in any of the regions
Company Information
Detailed analysis and profiling of additional market players (Up to five)
The Non-Fungible Token Market was valued at USD 27.45 Billion in 2023 and is expected to reach USD 390.26 Billion by 2032, growing at a CAGR of 34.32% over the forecast period 2024-2032.
The Online Tutoring Services Market was valued at USD 8.51 billion in 2023 and will reach USD 28.87 billion by 2032, growing at a CAGR of 14.59% by 2032.
Intrusion Detection System Market Size was USD 5.71 Billion in 2023 and will reach USD 11.43 bn by 2032 and grow at a CAGR of 8.0% by 2024-2032.
The IoT Connectivity Market was USD 8.43 billion in 2023 and is expected to reach USD 51.51 billion by 2032, growing at a CAGR of 22.33% by 2024-2032.
The Public Cloud Market size was USD 607.55 Billion in 2023 and is expected to Reach USD 1800 Billion by 2032 and grow at a CAGR of 12.83% by 2032.
The DataOps Platform Market was valued at USD 4.0 Billion in 2023 and is expected to reach USD 24.5 Billion by 2032, growing at a CAGR of 22.20% from 2024-2032.
Hi! Click one of our member below to chat on Phone