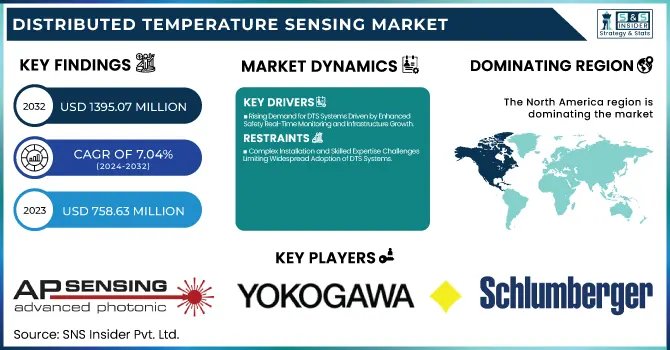
The Distributed Temperature Sensing Market was valued at USD 758.63 million in 2023 and is expected to reach USD 1395.07 million by 2032, growing at a CAGR of 7.04% over the forecast period 2024-2032. DTS market drivers are related to the improvement in various parameters which will boost the performance of the system. Operational efficiency metrics are all about responsiveness to problems, avoidance of outages and incidents, and interoperability with industrial automation. The performance and accuracy metrics, while stressing high spatial resolution, accurate temperature measurement, and stable data output in constantly changing environments. Performs various tests of fiber optics for attenuation rates, bend loss, and clear signals, all necessary for solid data transmission. And, data analysis and precision metrics are on accurate temperature profiling, low latency reporting, and higher signal-to-noise ratio results to provide DTS systems with meaningful results for better safety and asset protection.
Key Drivers:
Rising Demand for DTS Systems Driven by Enhanced Safety Real-Time Monitoring and Infrastructure Growth
The increasing demand for advanced monitoring solutions in the oil and gas, power transmission, and fire detection industries is one of the major drivers. Remote real-time temperature data provided by DTS systems ensures early detection of any temperature aberration and possible hazards. Increasing demand due to the need for efficient pipeline monitoring over long distances, and in remote and hazardous environments. Moreover, increasing investments in infrastructure projects such as smart grids and power distribution networks are anticipated for cable temperature monitoring utilizing DTS over the forecast period. Due to their increased safety over traditional sensor systems, reliability, and cost-effectiveness, integration of DTS systems in industrial applications is growing quickly.
Restrain:
Complex Installation and Skilled Expertise Challenges Limiting Widespread Adoption of DTS Systems
The installation and integration of systems are complex, which is a major hurdle. DTS systems, in particular, require accurate placement such as oil rigs, power plants, or large industrial plants. If the installation is not done properly, it will yield wrong data readings which will result in ineffective use of the system. Moreover, the requirement for specialized technical knowledge to manage, calibrate, and interpret DTS data becomes a hurdle for various companies that do not have skilled personnel. Such complexity makes it time-consuming to deploy and limits adoption within industries.
Opportunity:
Expanding DTS Opportunities Driven by IoT Integration Environmental Monitoring and Clean Energy Projects
A key opportunity in the DTS market is the increasing use of fiber optic sensing technology in environmental monitoring and smart city projects. With industries moving towards digitalization and automation, there is a growing use of DTS systems as a part of IoT platforms to enable real-time analysis and predictive maintenance. An additional opportunity for expansion arises with the increasing focus on clean energy developments such as wind and solar plants. Emerging opportunities have positioned companies that provide innovative DTS solutions with a higher level of accuracy and remote monitoring on the bright side of the sun as we can say.
Challenges:
Overcoming Environmental Vulnerabilities and Data Interpretation Challenges for Reliable DTS System Performance
DTS systems also face a broader challenge in their newfound vulnerability to the environment and mechanics. Fiber optic cables while sturdy are prone to mishaps when being installed, and industrial environments often expose the cable to a harsher level of operating conditions. Signal integrity and performance of the system can be compromised due to vibration, bending stress, chemical exposure, etc. In addition, difficulties may also occur with interpreting the data, especially when measuring small variations in temperature in moving settings. Organizations need to invest in high-quality data analytics tools and skilled professionals to ensure the DTS systems provide perfect insights. Eliminating these technical hurdles is essential for harnessing the completeness of DTS technology in many fields.
By Operating Principle
The DTS market was dominated by Optical Time Domain Reflectometry with a market share of 76.2% in 2023. OTDR is the entire fault detection function, locating the breakpoints and long-distance accurate tests, which stand over the power. It has strengthened its market position due to its extensive applications in the oil & gas, power transmission, and fire detection industries.
Optical Frequency Domain Reflectometry (OFDR) is expected to show the fastest CAGR from 2024 to 2032. Its outstanding accuracy, high spatial resolution, and detection of small temperature changes in a shorter span of distance are the main driving factors for OFDR market growth. The growing need of industries for advanced monitoring solutions of critical infrastructure is expected to drive substantial demand for OFDR, particularly in the research, aerospace, and manufacturing sectors.
By Fiber
Single-mode Fiber held the highest share of the Distributed Temperature Sensing (DTS) market in 2023, accounting for 64.4% market share. It is this superiority that is responsible for the domination of long-distance sensing applications, high signal integrity, and low attenuation rates. Single-mode fiber is widely used for long-range temperature measurements in key industries like oil & gas, power transmission, and infrastructure.
Multi-mode Fiber is expected to witness the fastest CAGR from 2024 to 2032. The temporal phase unwrapping technique has gained popularity due to its cost-efficient nature, ease of installation, and the ability to be utilized in short to medium-length sensing applications. Multi-mode fiber is anticipated to witness high growth in the forthcoming years owing to the increasing localization of temperature monitoring and asset protection with consideration to the expansion from industry segments.
By Application
The Oil and Gas sector accounted for the largest share of the Distributed Temperature Sensing (DTS) market 38.7% in 2023. The ease of use of distributed temperature sensing especially for downhole monitoring, pipeline integrity management, and wellbore temperature profiling has led to the dominance of DTS systems in the segment. Due to the strong industry focus on safety and monitoring pipelines in remote and unsafe locations in real-time, DTS solutions also have obtained rapid penetration within the industry.
The Process & Pipeline Monitoring segment is projected to witness the fastest CAGR from 2024 to 2032. This growth is driven by the growing need to implement process control, asset protection, and thermal management more efficiently within various industrial facilities. There will also most likely be a huge increase in the adoption of DTS in this segment, as industries take note of predictive maintenance and operational efficiency.
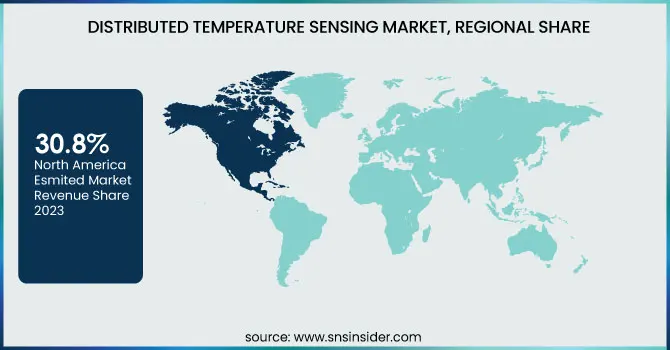
North America held the largest share of the Distributed Temperature Sensing (DTS) market at 30.8% in 2023. The leadership position is attributed to the oil & gas, power transmission, and fire detection sectors present across the region. In the United States, DTS has been widely institutionalized in shale gas exploration, pipeline monitoring, and power cable detection. Some big energy infrastructure projects, such as the Permian Basin oil fields in Texas, are highly dependent on DTS systems to directly monitor downhole temperature in real-time, to make the operations safer, and more efficient. Moreover, the rise in building fire detection systems based on DTS, particularly in commercial and industrial establishments, is likely to bolster market growth in the region.
Asia-Pacific is estimated to be the fastest-growing region with the highest CAGR throughout the forecast period (2024-2032) owing to rising rapid industrialization urbanization and rising infrastructure development. China, India, Japan, and many other countries are on the move to invest in smart city projects and renewable resources that propel the DTS needs. Examples include Thermal Detection Solutions (DTS) integrated into China expanding high-voltage power grid networks and pipeline infrastructure projects in India for thermal monitoring and fault detection. As such, Asia-Pacific is anticipated to emerge as a prominent growth region for the DTS market in the years ahead.
Some of the major players in the Distributed Temperature Sensing Market are:
AP Sensing (Linear Heat Detection System),
Yokogawa Electric Corporation (DTSX200 Distributed Temperature Sensor),
Schlumberger Limited (FIBREWATCH DTS),
Halliburton (FiberWatch DTS),
Weatherford International (SureView® DTS),
Omnisens SA (DiTeSt DTS),
Sumitomo Electric Industries (SOR2 DTS System),
Bandweaver Technology (FireLaser DTS),
NKT Photonics (LIOS DE.TECT DTS),
Silixa Ltd. (iDAS DTS),
Sensornet Ltd. (Halo DTS),
OFS Fitel, LLC (TrueSense DTS),
AGL Construction (SmartTracer DTS),
Luna Innovations Incorporated (ODiSI DTS),
Brugg Kabel AG (Brugg DTS System).
In January 2024, AP Sensing partnered with STS Group to deploy a four-channel DTS system, enabling real-time temperature monitoring across a two km range per channel for enhanced data center safety.
Report Attributes | Details |
---|---|
Market Size in 2023 | USD 758.63 Million |
Market Size by 2032 | USD 1395.07 Million |
CAGR | CAGR of 7.04% From 2024 to 2032 |
Base Year | 2023 |
Forecast Period | 2024-2032 |
Historical Data | 2020-2022 |
Report Scope & Coverage | Market Size, Segments Analysis, Competitive Landscape, Regional Analysis, DROC & SWOT Analysis, Forecast Outlook |
Key Segments | • By Operating Principle (Optical Time Domain Reflectometry (OTDR), Optical Frequency Domain Reflectometry (OFDR)) • By Fiber (Single-mode Fiber, Multi-mode Fiber) • By Application (Oil and Gas, Power Cable Monitoring, Fire Detection, Process & Pipeline Monitoring, Environmental Monitoring, Others) |
Regional Analysis/Coverage | North America (US, Canada, Mexico), Europe (Eastern Europe [Poland, Romania, Hungary, Turkey, Rest of Eastern Europe] Western Europe] Germany, France, UK, Italy, Spain, Netherlands, Switzerland, Austria, Rest of Western Europe]), Asia Pacific (China, India, Japan, South Korea, Vietnam, Singapore, Australia, Rest of Asia Pacific), Middle East & Africa (Middle East [UAE, Egypt, Saudi Arabia, Qatar, Rest of Middle East], Africa [Nigeria, South Africa, Rest of Africa], Latin America (Brazil, Argentina, Colombia, Rest of Latin America) |
Company Profiles | AP Sensing, Yokogawa Electric Corporation, Schlumberger Limited, Halliburton, Weatherford International, Omnisens SA, Sumitomo Electric Industries, Bandweaver Technology, NKT Photonics, Silixa Ltd., Sensornet Ltd., OFS Fitel, LLC, AGL Construction, Luna Innovations Incorporated, Brugg Kabel AG. |
Ans: The Distributed Temperature Sensing Market is expected to grow at a CAGR of 7.04% during 2024-2032.
Ans: Distributed Temperature Sensing Market size was USD 758.63 million in 2023 and is expected to Reach USD 1395.07 million by 2032.
Ans: The major growth factor of the Distributed Temperature Sensing (DTS) market is the increasing demand for real-time, precise temperature monitoring in critical industries such as oil & gas, power transmission, and fire detection.
Ans: The Optical Time Domain Reflectometry (OTDR) segment dominated the Distributed Temperature Sensing Market in 2023.
Ans: North America dominated the Distributed Temperature Sensing Market in 2023.
Table of Content
1. Introduction
1.1 Market Definition
1.2 Scope (Inclusion and Exclusions)
1.3 Research Assumptions
2. Executive Summary
2.1 Market Overview
2.2 Regional Synopsis
2.3 Competitive Summary
3. Research Methodology
3.1 Top-Down Approach
3.2 Bottom-up Approach
3.3. Data Validation
3.4 Primary Interviews
4. Market Dynamics Impact Analysis
4.1 Market Driving Factors Analysis
4.1.1 Drivers
4.1.2 Restraints
4.1.3 Opportunities
4.1.4 Challenges
4.2 PESTLE Analysis
4.3 Porter’s Five Forces Model
5. Statistical Insights and Trends Reporting
5.1 Operational Efficiency Metrics
5.2 Performance and Accuracy Metrics
5.3 Fiber Optic Performance Metrics
5.4 Data Analysis and Precision Metrics
6. Competitive Landscape
6.1 List of Major Companies, By Region
6.2 Market Share Analysis, By Region
6.3 Product Benchmarking
6.3.1 Product specifications and features
6.3.2 Pricing
6.4 Strategic Initiatives
6.4.1 Marketing and Promotional Activities
6.4.2 Distribution and Supply Chain Strategies
6.4.3 Expansion plans and new product launches
6.4.4 Strategic partnerships and collaborations
6.5 Technological Advancements
6.6 Market Positioning and Branding
7. Distributed Temperature Sensing Market Segmentation, By Operating Principle
7.1 Chapter Overview
7.2 Optical Time Domain Reflectometry (OTDR)
7.2.1 Optical Time Domain Reflectometry (OTDR) Market Trends Analysis (2020-2032)
7.2.2 Optical Time Domain Reflectometry (OTDR) Market Size Estimates and Forecasts to 2032 (USD Million)
7.3 Optical Frequency Domain Reflectometry (OFDR)
7.3.1 Optical Frequency Domain Reflectometry (OFDR) Market Trends Analysis (2020-2032)
7.3.2 Optical Frequency Domain Reflectometry (OFDR) Market Size Estimates and Forecasts to 2032 (USD Million)
8. Distributed Temperature Sensing Market Segmentation, By Fiber
8.1 Chapter Overview
8.2 Single-mode Fiber
8.2.1 Single-mode Fiber Market Trends Analysis (2020-2032)
8.2.2 Single-mode Fiber Market Size Estimates and Forecasts to 2032 (USD Million)
8.3 Multi-mode Fiber
8.3.1 Multi-mode Fiber Market Trends Analysis (2020-2032)
8.3.2 Multi-mode Fiber Market Size Estimates and Forecasts to 2032 (USD Million)
9. Distributed Temperature Sensing Market Segmentation, By Application
9.1 Chapter Overview
9.2 Oil and Gas
9.2.1 Oil and Gas Market Trends Analysis (2020-2032)
9.2.2 Oil and Gas Market Size Estimates and Forecasts to 2032 (USD Million)
9.3 Power Cable Monitoring
9.3.1 Power Cable Monitoring Market Trends Analysis (2020-2032)
9.3.2 Power Cable Monitoring Market Size Estimates and Forecasts to 2032 (USD Million)
9.4 Fire Detection
9.4.1 Fire Detection Market Trends Analysis (2020-2032)
9.4.2 Fire Detection Market Size Estimates and Forecasts to 2032 (USD Million)
9.5 Process & Pipeline Monitoring
9.5.1 Process & Pipeline Monitoring Market Trends Analysis (2020-2032)
9.5.2 Process & Pipeline Monitoring Market Size Estimates and Forecasts to 2032 (USD Million)
9.6 Environmental Monitoring
9.6.1 Environmental Monitoring Market Trends Analysis (2020-2032)
9.6.2 Environmental Monitoring Market Size Estimates and Forecasts to 2032 (USD Million)
9.7 Others
9.7.1 Others Market Trends Analysis (2020-2032)
9.7.2 Others Market Size Estimates and Forecasts to 2032 (USD Million)
10. Regional Analysis
10.1 Chapter Overview
10.2 North America
10.2.1 Trends Analysis
10.2.2 North America Distributed Temperature Sensing Market Estimates and Forecasts, by Country (2020-2032) (USD Million)
10.2.3 North America Distributed Temperature Sensing Market Estimates and Forecasts, By Operating Principle (2020-2032) (USD Million)
10.2.4 North America Distributed Temperature Sensing Market Estimates and Forecasts, By Fiber (2020-2032) (USD Million)
10.2.5 North America Distributed Temperature Sensing Market Estimates and Forecasts, By Application (2020-2032) (USD Million)
10.2.6 USA
10.2.6.1 USA Distributed Temperature Sensing Market Estimates and Forecasts, By Operating Principle (2020-2032) (USD Million)
10.2.6.2 USA Distributed Temperature Sensing Market Estimates and Forecasts, By Fiber (2020-2032) (USD Million)
10.2.6.3 USA Distributed Temperature Sensing Market Estimates and Forecasts, By Application (2020-2032) (USD Million)
10.2.7 Canada
10.2.7.1 Canada Distributed Temperature Sensing Market Estimates and Forecasts, By Operating Principle (2020-2032) (USD Million)
10.2.7.2 Canada Distributed Temperature Sensing Market Estimates and Forecasts, By Fiber (2020-2032) (USD Million)
10.2.7.3 Canada Distributed Temperature Sensing Market Estimates and Forecasts, By Application (2020-2032) (USD Million)
10.2.8 Mexico
10.2.8.1 Mexico Distributed Temperature Sensing Market Estimates and Forecasts, By Operating Principle (2020-2032) (USD Million)
10.2.8.2 Mexico Distributed Temperature Sensing Market Estimates and Forecasts, By Fiber (2020-2032) (USD Million)
10.2.8.3 Mexico Distributed Temperature Sensing Market Estimates and Forecasts, By Application (2020-2032) (USD Million)
10.3 Europe
10.3.1 Eastern Europe
10.3.1.1 Trends Analysis
10.3.1.2 Eastern Europe Distributed Temperature Sensing Market Estimates and Forecasts, by Country (2020-2032) (USD Million)
10.3.1.3 Eastern Europe Distributed Temperature Sensing Market Estimates and Forecasts, By Operating Principle (2020-2032) (USD Million)
10.3.1.4 Eastern Europe Distributed Temperature Sensing Market Estimates and Forecasts, By Fiber (2020-2032) (USD Million)
10.3.1.5 Eastern Europe Distributed Temperature Sensing Market Estimates and Forecasts, By Application (2020-2032) (USD Million)
10.3.1.6 Poland
10.3.1.6.1 Poland Distributed Temperature Sensing Market Estimates and Forecasts, By Operating Principle (2020-2032) (USD Million)
10.3.1.6.2 Poland Distributed Temperature Sensing Market Estimates and Forecasts, By Fiber (2020-2032) (USD Million)
10.3.1.6.3 Poland Distributed Temperature Sensing Market Estimates and Forecasts, By Application (2020-2032) (USD Million)
10.3.1.7 Romania
10.3.1.7.1 Romania Distributed Temperature Sensing Market Estimates and Forecasts, By Operating Principle (2020-2032) (USD Million)
10.3.1.7.2 Romania Distributed Temperature Sensing Market Estimates and Forecasts, By Fiber (2020-2032) (USD Million)
10.3.1.7.3 Romania Distributed Temperature Sensing Market Estimates and Forecasts, By Application (2020-2032) (USD Million)
10.3.1.8 Hungary
10.3.1.8.1 Hungary Distributed Temperature Sensing Market Estimates and Forecasts, By Operating Principle (2020-2032) (USD Million)
10.3.1.8.2 Hungary Distributed Temperature Sensing Market Estimates and Forecasts, By Fiber (2020-2032) (USD Million)
10.3.1.8.3 Hungary Distributed Temperature Sensing Market Estimates and Forecasts, By Application (2020-2032) (USD Million)
10.3.1.9 Turkey
10.3.1.9.1 Turkey Distributed Temperature Sensing Market Estimates and Forecasts, By Operating Principle (2020-2032) (USD Million)
10.3.1.9.2 Turkey Distributed Temperature Sensing Market Estimates and Forecasts, By Fiber (2020-2032) (USD Million)
10.3.1.9.3 Turkey Distributed Temperature Sensing Market Estimates and Forecasts, By Application (2020-2032) (USD Million)
10.3.1.10 Rest of Eastern Europe
10.3.1.10.1 Rest of Eastern Europe Distributed Temperature Sensing Market Estimates and Forecasts, By Operating Principle (2020-2032) (USD Million)
10.3.1.10.2 Rest of Eastern Europe Distributed Temperature Sensing Market Estimates and Forecasts, By Fiber (2020-2032) (USD Million)
10.3.1.10.3 Rest of Eastern Europe Distributed Temperature Sensing Market Estimates and Forecasts, By Application (2020-2032) (USD Million)
10.3.2 Western Europe
10.3.2.1 Trends Analysis
10.3.2.2 Western Europe Distributed Temperature Sensing Market Estimates and Forecasts, by Country (2020-2032) (USD Million)
10.3.2.3 Western Europe Distributed Temperature Sensing Market Estimates and Forecasts, By Operating Principle (2020-2032) (USD Million)
10.3.2.4 Western Europe Distributed Temperature Sensing Market Estimates and Forecasts, By Fiber (2020-2032) (USD Million)
10.3.2.5 Western Europe Distributed Temperature Sensing Market Estimates and Forecasts, By Application (2020-2032) (USD Million)
10.3.2.6 Germany
10.3.2.6.1 Germany Distributed Temperature Sensing Market Estimates and Forecasts, By Operating Principle (2020-2032) (USD Million)
10.3.2.6.2 Germany Distributed Temperature Sensing Market Estimates and Forecasts, By Fiber (2020-2032) (USD Million)
10.3.2.6.3 Germany Distributed Temperature Sensing Market Estimates and Forecasts, By Application (2020-2032) (USD Million)
10.3.2.7 France
10.3.2.7.1 France Distributed Temperature Sensing Market Estimates and Forecasts, By Operating Principle (2020-2032) (USD Million)
10.3.2.7.2 France Distributed Temperature Sensing Market Estimates and Forecasts, By Fiber (2020-2032) (USD Million)
10.3.2.7.3 France Distributed Temperature Sensing Market Estimates and Forecasts, By Application (2020-2032) (USD Million)
10.3.2.8 UK
10.3.2.8.1 UK Distributed Temperature Sensing Market Estimates and Forecasts, By Operating Principle (2020-2032) (USD Million)
10.3.2.8.2 UK Distributed Temperature Sensing Market Estimates and Forecasts, By Fiber (2020-2032) (USD Million)
10.3.2.8.3 UK Distributed Temperature Sensing Market Estimates and Forecasts, By Application (2020-2032) (USD Million)
10.3.2.9 Italy
10.3.2.9.1 Italy Distributed Temperature Sensing Market Estimates and Forecasts, By Operating Principle (2020-2032) (USD Million)
10.3.2.9.2 Italy Distributed Temperature Sensing Market Estimates and Forecasts, By Fiber (2020-2032) (USD Million)
10.3.2.9.3 Italy Distributed Temperature Sensing Market Estimates and Forecasts, By Application (2020-2032) (USD Million)
10.3.2.10 Spain
10.3.2.10.1 Spain Distributed Temperature Sensing Market Estimates and Forecasts, By Operating Principle (2020-2032) (USD Million)
10.3.2.10.2 Spain Distributed Temperature Sensing Market Estimates and Forecasts, By Fiber (2020-2032) (USD Million)
10.3.2.10.3 Spain Distributed Temperature Sensing Market Estimates and Forecasts, By Application (2020-2032) (USD Million)
10.3.2.11 Netherlands
10.3.2.11.1 Netherlands Distributed Temperature Sensing Market Estimates and Forecasts, By Operating Principle (2020-2032) (USD Million)
10.3.2.11.2 Netherlands Distributed Temperature Sensing Market Estimates and Forecasts, By Fiber (2020-2032) (USD Million)
10.3.2.11.3 Netherlands Distributed Temperature Sensing Market Estimates and Forecasts, By Application (2020-2032) (USD Million)
10.3.2.12 Switzerland
10.3.2.12.1 Switzerland Distributed Temperature Sensing Market Estimates and Forecasts, By Operating Principle (2020-2032) (USD Million)
10.3.2.12.2 Switzerland Distributed Temperature Sensing Market Estimates and Forecasts, By Fiber (2020-2032) (USD Million)
10.3.2.12.3 Switzerland Distributed Temperature Sensing Market Estimates and Forecasts, By Application (2020-2032) (USD Million)
10.3.2.13 Austria
10.3.2.13.1 Austria Distributed Temperature Sensing Market Estimates and Forecasts, By Operating Principle (2020-2032) (USD Million)
10.3.2.13.2 Austria Distributed Temperature Sensing Market Estimates and Forecasts, By Fiber (2020-2032) (USD Million)
10.3.2.13.3 Austria Distributed Temperature Sensing Market Estimates and Forecasts, By Application (2020-2032) (USD Million)
10.3.2.14 Rest of Western Europe
10.3.2.14.1 Rest of Western Europe Distributed Temperature Sensing Market Estimates and Forecasts, By Operating Principle (2020-2032) (USD Million)
10.3.2.14.2 Rest of Western Europe Distributed Temperature Sensing Market Estimates and Forecasts, By Fiber (2020-2032) (USD Million)
10.3.2.14.3 Rest of Western Europe Distributed Temperature Sensing Market Estimates and Forecasts, By Application (2020-2032) (USD Million)
10.4 Asia Pacific
10.4.1 Trends Analysis
10.4.2 Asia Pacific Distributed Temperature Sensing Market Estimates and Forecasts, by Country (2020-2032) (USD Million)
10.4.3 Asia Pacific Distributed Temperature Sensing Market Estimates and Forecasts, By Operating Principle (2020-2032) (USD Million)
10.4.4 Asia Pacific Distributed Temperature Sensing Market Estimates and Forecasts, By Fiber (2020-2032) (USD Million)
10.4.5 Asia Pacific Distributed Temperature Sensing Market Estimates and Forecasts, By Application (2020-2032) (USD Million)
10.4.6 China
10.4.6.1 China Distributed Temperature Sensing Market Estimates and Forecasts, By Operating Principle (2020-2032) (USD Million)
10.4.6.2 China Distributed Temperature Sensing Market Estimates and Forecasts, By Fiber (2020-2032) (USD Million)
10.4.6.3 China Distributed Temperature Sensing Market Estimates and Forecasts, By Application (2020-2032) (USD Million)
10.4.7 India
10.4.7.1 India Distributed Temperature Sensing Market Estimates and Forecasts, By Operating Principle (2020-2032) (USD Million)
10.4.7.2 India Distributed Temperature Sensing Market Estimates and Forecasts, By Fiber (2020-2032) (USD Million)
10.4.7.3 India Distributed Temperature Sensing Market Estimates and Forecasts, By Application (2020-2032) (USD Million)
10.4.8 Japan
10.4.8.1 Japan Distributed Temperature Sensing Market Estimates and Forecasts, By Operating Principle (2020-2032) (USD Million)
10.4.8.2 Japan Distributed Temperature Sensing Market Estimates and Forecasts, By Fiber (2020-2032) (USD Million)
10.4.8.3 Japan Distributed Temperature Sensing Market Estimates and Forecasts, By Application (2020-2032) (USD Million)
10.4.9 South Korea
10.4.9.1 South Korea Distributed Temperature Sensing Market Estimates and Forecasts, By Operating Principle (2020-2032) (USD Million)
10.4.9.2 South Korea Distributed Temperature Sensing Market Estimates and Forecasts, By Fiber (2020-2032) (USD Million)
10.4.9.3 South Korea Distributed Temperature Sensing Market Estimates and Forecasts, By Application (2020-2032) (USD Million)
10.4.10 Vietnam
10.4.10.1 Vietnam Distributed Temperature Sensing Market Estimates and Forecasts, By Operating Principle (2020-2032) (USD Million)
10.4.10.2 Vietnam Distributed Temperature Sensing Market Estimates and Forecasts, By Fiber (2020-2032) (USD Million)
10.4.10.3 Vietnam Distributed Temperature Sensing Market Estimates and Forecasts, By Application (2020-2032) (USD Million)
10.4.11 Singapore
10.4.11.1 Singapore Distributed Temperature Sensing Market Estimates and Forecasts, By Operating Principle (2020-2032) (USD Million)
10.4.11.2 Singapore Distributed Temperature Sensing Market Estimates and Forecasts, By Fiber (2020-2032) (USD Million)
10.4.11.3 Singapore Distributed Temperature Sensing Market Estimates and Forecasts, By Application (2020-2032) (USD Million)
10.4.12 Australia
10.4.12.1 Australia Distributed Temperature Sensing Market Estimates and Forecasts, By Operating Principle (2020-2032) (USD Million)
10.4.12.2 Australia Distributed Temperature Sensing Market Estimates and Forecasts, By Fiber (2020-2032) (USD Million)
10.4.12.3 Australia Distributed Temperature Sensing Market Estimates and Forecasts, By Application (2020-2032) (USD Million)
10.4.13 Rest of Asia Pacific
10.4.13.1 Rest of Asia Pacific Distributed Temperature Sensing Market Estimates and Forecasts, By Operating Principle (2020-2032) (USD Million)
10.4.13.2 Rest of Asia Pacific Distributed Temperature Sensing Market Estimates and Forecasts, By Fiber (2020-2032) (USD Million)
10.4.13.3 Rest of Asia Pacific Distributed Temperature Sensing Market Estimates and Forecasts, By Application (2020-2032) (USD Million)
10.5 Middle East and Africa
10.5.1 Middle East
10.5.1.1 Trends Analysis
10.5.1.2 Middle East Distributed Temperature Sensing Market Estimates and Forecasts, by Country (2020-2032) (USD Million)
10.5.1.3 Middle East Distributed Temperature Sensing Market Estimates and Forecasts, By Operating Principle (2020-2032) (USD Million)
10.5.1.4 Middle East Distributed Temperature Sensing Market Estimates and Forecasts, By Fiber (2020-2032) (USD Million)
10.5.1.5 Middle East Distributed Temperature Sensing Market Estimates and Forecasts, By Application (2020-2032) (USD Million)
10.5.1.6 UAE
10.5.1.6.1 UAE Distributed Temperature Sensing Market Estimates and Forecasts, By Operating Principle (2020-2032) (USD Million)
10.5.1.6.2 UAE Distributed Temperature Sensing Market Estimates and Forecasts, By Fiber (2020-2032) (USD Million)
10.5.1.6.3 UAE Distributed Temperature Sensing Market Estimates and Forecasts, By Application (2020-2032) (USD Million)
10.5.1.7 Egypt
10.5.1.7.1 Egypt Distributed Temperature Sensing Market Estimates and Forecasts, By Operating Principle (2020-2032) (USD Million)
10.5.1.7.2 Egypt Distributed Temperature Sensing Market Estimates and Forecasts, By Fiber (2020-2032) (USD Million)
10.5.1.7.3 Egypt Distributed Temperature Sensing Market Estimates and Forecasts, By Application (2020-2032) (USD Million)
10.5.1.8 Saudi Arabia
10.5.1.8.1 Saudi Arabia Distributed Temperature Sensing Market Estimates and Forecasts, By Operating Principle (2020-2032) (USD Million)
10.5.1.8.2 Saudi Arabia Distributed Temperature Sensing Market Estimates and Forecasts, By Fiber (2020-2032) (USD Million)
10.5.1.8.3 Saudi Arabia Distributed Temperature Sensing Market Estimates and Forecasts, By Application (2020-2032) (USD Million)
10.5.1.9 Qatar
10.5.1.9.1 Qatar Distributed Temperature Sensing Market Estimates and Forecasts, By Operating Principle (2020-2032) (USD Million)
10.5.1.9.2 Qatar Distributed Temperature Sensing Market Estimates and Forecasts, By Fiber (2020-2032) (USD Million)
10.5.1.9.3 Qatar Distributed Temperature Sensing Market Estimates and Forecasts, By Application (2020-2032) (USD Million)
10.5.1.10 Rest of Middle East
10.5.1.10.1 Rest of Middle East Distributed Temperature Sensing Market Estimates and Forecasts, By Operating Principle (2020-2032) (USD Million)
10.5.1.10.2 Rest of Middle East Distributed Temperature Sensing Market Estimates and Forecasts, By Fiber (2020-2032) (USD Million)
10.5.1.10.3 Rest of Middle East Distributed Temperature Sensing Market Estimates and Forecasts, By Application (2020-2032) (USD Million)
10.5.2 Africa
10.5.2.1 Trends Analysis
10.5.2.2 Africa Distributed Temperature Sensing Market Estimates and Forecasts, by Country (2020-2032) (USD Million)
10.5.2.3 Africa Distributed Temperature Sensing Market Estimates and Forecasts, By Operating Principle (2020-2032) (USD Million)
10.5.2.4 Africa Distributed Temperature Sensing Market Estimates and Forecasts, By Fiber (2020-2032) (USD Million)
10.5.2.5 Africa Distributed Temperature Sensing Market Estimates and Forecasts, By Application (2020-2032) (USD Million)
10.5.2.6 South Africa
10.5.2.6.1 South Africa Distributed Temperature Sensing Market Estimates and Forecasts, By Operating Principle (2020-2032) (USD Million)
10.5.2.6.2 South Africa Distributed Temperature Sensing Market Estimates and Forecasts, By Fiber (2020-2032) (USD Million)
10.5.2.6.3 South Africa Distributed Temperature Sensing Market Estimates and Forecasts, By Application (2020-2032) (USD Million)
10.5.2.7 Nigeria
10.5.2.7.1 Nigeria Distributed Temperature Sensing Market Estimates and Forecasts, By Operating Principle (2020-2032) (USD Million)
10.5.2.7.2 Nigeria Distributed Temperature Sensing Market Estimates and Forecasts, By Fiber (2020-2032) (USD Million)
10.5.2.7.3 Nigeria Distributed Temperature Sensing Market Estimates and Forecasts, By Application (2020-2032) (USD Million)
10.5.2.8 Rest of Africa
10.5.2.8.1 Rest of Africa Distributed Temperature Sensing Market Estimates and Forecasts, By Operating Principle (2020-2032) (USD Million)
10.5.2.8.2 Rest of Africa Distributed Temperature Sensing Market Estimates and Forecasts, By Fiber (2020-2032) (USD Million)
10.5.2.8.3 Rest of Africa Distributed Temperature Sensing Market Estimates and Forecasts, By Application (2020-2032) (USD Million)
10.6 Latin America
10.6.1 Trends Analysis
10.6.2 Latin America Distributed Temperature Sensing Market Estimates and Forecasts, by Country (2020-2032) (USD Million)
10.6.3 Latin America Distributed Temperature Sensing Market Estimates and Forecasts, By Operating Principle (2020-2032) (USD Million)
10.6.4 Latin America Distributed Temperature Sensing Market Estimates and Forecasts, By Fiber (2020-2032) (USD Million)
10.6.5 Latin America Distributed Temperature Sensing Market Estimates and Forecasts, By Application (2020-2032) (USD Million)
10.6.6 Brazil
10.6.6.1 Brazil Distributed Temperature Sensing Market Estimates and Forecasts, By Operating Principle (2020-2032) (USD Million)
10.6.6.2 Brazil Distributed Temperature Sensing Market Estimates and Forecasts, By Fiber (2020-2032) (USD Million)
10.6.6.3 Brazil Distributed Temperature Sensing Market Estimates and Forecasts, By Application (2020-2032) (USD Million)
10.6.7 Argentina
10.6.7.1 Argentina Distributed Temperature Sensing Market Estimates and Forecasts, By Operating Principle (2020-2032) (USD Million)
10.6.7.2 Argentina Distributed Temperature Sensing Market Estimates and Forecasts, By Fiber (2020-2032) (USD Million)
10.6.7.3 Argentina Distributed Temperature Sensing Market Estimates and Forecasts, By Application (2020-2032) (USD Million)
10.6.8 Colombia
10.6.8.1 Colombia Distributed Temperature Sensing Market Estimates and Forecasts, By Operating Principle (2020-2032) (USD Million)
10.6.8.2 Colombia Distributed Temperature Sensing Market Estimates and Forecasts, By Fiber (2020-2032) (USD Million)
10.6.8.3 Colombia Distributed Temperature Sensing Market Estimates and Forecasts, By Application (2020-2032) (USD Million)
10.6.9 Rest of Latin America
10.6.9.1 Rest of Latin America Distributed Temperature Sensing Market Estimates and Forecasts, By Operating Principle (2020-2032) (USD Million)
10.6.9.2 Rest of Latin America Distributed Temperature Sensing Market Estimates and Forecasts, By Fiber (2020-2032) (USD Million)
10.6.9.3 Rest of Latin America Distributed Temperature Sensing Market Estimates and Forecasts, By Application (2020-2032) (USD Million)
11. Company Profiles
11.1 AP Sensing
11.1.1 Company Overview
11.1.2 Financial
11.1.3 Products/ Services Offered
11.1.4 SWOT Analysis
11.2 Yokogawa Electric Corporation.
11.2.1 Company Overview
11.2.2 Financial
11.2.3 Products/ Services Offered
11.2.4 SWOT Analysis
11.3 Schlumberger Limited
11.3.1 Company Overview
11.3.2 Financial
11.3.3 Products/ Services Offered
11.3.4 SWOT Analysis
11.4 Halliburton
11.4.1 Company Overview
11.4.2 Financial
11.4.3 Products/ Services Offered
11.4.4 SWOT Analysis
11.5 Weatherford International
11.5.1 Company Overview
11.5.2 Financial
11.5.3 Products/ Services Offered
11.5.4 SWOT Analysis
11.6 Omnisens SA
11.6.1 Company Overview
11.6.2 Financial
11.6.3 Products/ Services Offered
11.6.4 SWOT Analysis
11.7 Sumitomo Electric Industries.
11.7.1 Company Overview
11.7.2 Financial
11.7.3 Products/ Services Offered
11.7.4 SWOT Analysis
11.8 Bandweaver Technology
11.8.1 Company Overview
11.8.2 Financial
11.8.3 Products/ Services Offered
11.8.4 SWOT Analysis
11.9 NKT Photonics.
11.9.1 Company Overview
11.9.2 Financial
11.9.3 Products/ Services Offered
11.9.4 SWOT Analysis
11.10 Silixa Ltd.
11.10.1 Company Overview
11.10.2 Financial
11.10.3 Products/ Services Offered
11.10.4 SWOT Analysis
12. Use Cases and Best Practices
13. Conclusion
An accurate research report requires proper strategizing as well as implementation. There are multiple factors involved in the completion of good and accurate research report and selecting the best methodology to compete the research is the toughest part. Since the research reports we provide play a crucial role in any company’s decision-making process, therefore we at SNS Insider always believe that we should choose the best method which gives us results closer to reality. This allows us to reach at a stage wherein we can provide our clients best and accurate investment to output ratio.
Each report that we prepare takes a timeframe of 350-400 business hours for production. Starting from the selection of titles through a couple of in-depth brain storming session to the final QC process before uploading our titles on our website we dedicate around 350 working hours. The titles are selected based on their current market cap and the foreseen CAGR and growth.
The 5 steps process:
Step 1: Secondary Research:
Secondary Research or Desk Research is as the name suggests is a research process wherein, we collect data through the readily available information. In this process we use various paid and unpaid databases which our team has access to and gather data through the same. This includes examining of listed companies’ annual reports, Journals, SEC filling etc. Apart from this our team has access to various associations across the globe across different industries. Lastly, we have exchange relationships with various university as well as individual libraries.
Step 2: Primary Research
When we talk about primary research, it is a type of study in which the researchers collect relevant data samples directly, rather than relying on previously collected data. This type of research is focused on gaining content specific facts that can be sued to solve specific problems. Since the collected data is fresh and first hand therefore it makes the study more accurate and genuine.
We at SNS Insider have divided Primary Research into 2 parts.
Part 1 wherein we interview the KOLs of major players as well as the upcoming ones across various geographic regions. This allows us to have their view over the market scenario and acts as an important tool to come closer to the accurate market numbers. As many as 45 paid and unpaid primary interviews are taken from both the demand and supply side of the industry to make sure we land at an accurate judgement and analysis of the market.
This step involves the triangulation of data wherein our team analyses the interview transcripts, online survey responses and observation of on filed participants. The below mentioned chart should give a better understanding of the part 1 of the primary interview.
Part 2: In this part of primary research the data collected via secondary research and the part 1 of the primary research is validated with the interviews from individual consultants and subject matter experts.
Consultants are those set of people who have at least 12 years of experience and expertise within the industry whereas Subject Matter Experts are those with at least 15 years of experience behind their back within the same space. The data with the help of two main processes i.e., FGDs (Focused Group Discussions) and IDs (Individual Discussions). This gives us a 3rd party nonbiased primary view of the market scenario making it a more dependable one while collation of the data pointers.
Step 3: Data Bank Validation
Once all the information is collected via primary and secondary sources, we run that information for data validation. At our intelligence centre our research heads track a lot of information related to the market which includes the quarterly reports, the daily stock prices, and other relevant information. Our data bank server gets updated every fortnight and that is how the information which we collected using our primary and secondary information is revalidated in real time.
Step 4: QA/QC Process
After all the data collection and validation our team does a final level of quality check and quality assurance to get rid of any unwanted or undesired mistakes. This might include but not limited to getting rid of the any typos, duplication of numbers or missing of any important information. The people involved in this process include technical content writers, research heads and graphics people. Once this process is completed the title gets uploader on our platform for our clients to read it.
Step 5: Final QC/QA Process:
This is the last process and comes when the client has ordered the study. In this process a final QA/QC is done before the study is emailed to the client. Since we believe in giving our clients a good experience of our research studies, therefore, to make sure that we do not lack at our end in any way humanly possible we do a final round of quality check and then dispatch the study to the client.
Key Segments:
By Operating Principle
Optical Time Domain Reflectometry (OTDR)
Optical Frequency Domain Reflectometry (OFDR)
By Fiber
Single-mode Fiber
Multi-mode Fiber
By Application
Oil and Gas
Power Cable Monitoring
Fire Detection
Process & Pipeline Monitoring
Environmental Monitoring
Others
Request for Segment Customization as per your Business Requirement: Segment Customization Request
Regional Coverage:
North America
US
Canada
Mexico
Europe
Eastern Europe
Poland
Romania
Hungary
Turkey
Rest of Eastern Europe
Western Europe
Germany
France
UK
Italy
Spain
Netherlands
Switzerland
Austria
Rest of Western Europe
Asia Pacific
China
India
Japan
South Korea
Vietnam
Singapore
Australia
Rest of Asia Pacific
Middle East & Africa
Middle East
UAE
Egypt
Saudi Arabia
Qatar
Rest of Middle East
Africa
Nigeria
South Africa
Rest of Africa
Latin America
Brazil
Argentina
Colombia
Rest of Latin America
Request for Country Level Research Report: Country Level Customization Request
Available Customization
With the given market data, SNS Insider offers customization as per the company’s specific needs. The following customization options are available for the report:
Detailed Volume Analysis
Criss-Cross segment analysis (e.g. Product X Application)
Competitive Product Benchmarking
Geographic Analysis
Additional countries in any of the regions
Customized Data Representation
Detailed analysis and profiling of additional market players
The Medical Alert Systems Market was valued at USD 9.05 billion in 2023 and is expected to reach USD 18.71 billion by 2032, growing at a CAGR of 8.45% over the forecast period 2024-2032.
The Livestock Identification Market Size was valued at USD 1.79 Billion in 2023 and is expected to reach USD 3.99 Billion by 2032 and grow at a CAGR of 9.77% over the forecast period 2024-2032.
The Semiconductor Inspection Microscope Market size was valued at USD 6.24 billion in 2023 and is expected to Reach USD 10.38 billion by 2032 and grow at a CAGR of 5.82% over the forecast period of 2024-2032.
The Crystal Oscillators Market Size was valued at USD 3.35 billion in 2023 and is expected to reach USD 4.07 billion by 2032 and grow at a CAGR of 2.01% over the forecast period 2024-2032.
The Power Electronics Market Size was valued at USD 36.28 Billion in 2023 and is expected to grow at a CAGR of 5.78% to reach USD 60.10 Billion by 2032.
The Compound Semiconductor Market Size was valued at USD 43.17 billion in 2023 and is expected to reach USD 76.73 billion by 2032 and grow at a CAGR of 6.60% over the forecast period 2024-2032.
Hi! Click one of our member below to chat on Phone