Distributed Acoustic Sensing (DAS) Market Size & Growth:
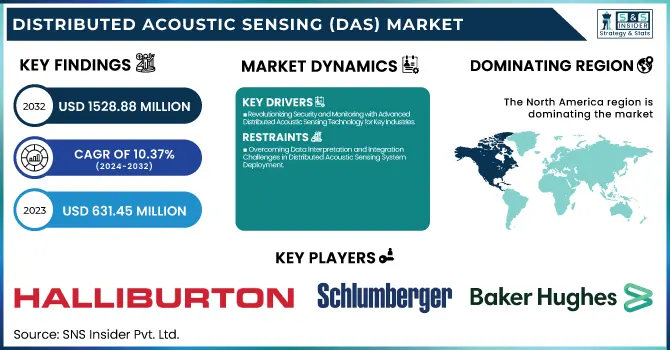
The Distributed Acoustic Sensing (DAS) Market Size was valued at USD 631.45 million in 2023 and is expected to reach USD 1528.88 million by 2032, growing at a CAGR of 10.37% over the forecast period 2024-2032. The increasing penetration of Distributed Acoustic Sensing (DAS) in different industry verticals owing to its advantages such as real-time monitoring and security. Deployment analytics emphasize its rising implementation in oil & gas, infrastructure, and border security application areas. DAS systems create operational efficiencies as they can continuously monitor an asset throughout the day, resulting in less downtime and a better maintenance strategy. DAS enables early threat detection for incident management, meaning intrusions, leaks, or seismic activities can be responded to rapidly. Additionally, the ability to manage and analyze data effectively allows for accurate pattern recognition, facilitating predictive maintenance, and better decision-making by improving system performance and reliability.
To Get more information on Distributed Acoustic Sensing (DAS) Market - Request Free Sample Report
Distributed Acoustic Sensing (DAS) Market Dynamics
Key Drivers:
-
Revolutionizing Security and Monitoring with Advanced Distributed Acoustic Sensing Technology for Key Industries
The growing need for pipeline monitoring and pipeline security systems is one of the primary growth drivers. This invaluable technology is done in real-time and offers long-range data collection through a single fiber optic cable perfect for leak detection, third-party intrusion detection, and ground movement in oil and gas pipelines. Moreover, increasing investment in smart infrastructure coupled with increasing requirements of perimeter security in key industries such as defense, transportation, and energy is also expected to propel the growth of the market. Particularly, the growing use of DAS systems for seismic monitoring of earthquakes and subsurface exploration drives the market growth. In addition, the rise of artificial intelligence (AI) and machine learning (ML) more broadly is driving the ability to analyze DAS data to greater depths, leading to higher accuracy when it comes to detection and fewer false alarms.
Restrain:
-
Overcoming Data Interpretation and Integration Challenges in Distributed Acoustic Sensing System Deployment
A primary concern is the difficulty in understanding data interpretation. Specific DAS systems deliver an enormous data quantity that virtually all processing depends on sophisticated algorithms and an expert workforce to analyze and extract useful information. There are data admins without any efficient strategies to manage their data with DAS solutions; thus, the full potential of DAS solutions can remain undesired. Moreover, the technical complexity of integrating DAS systems with existing infrastructure can be challenging in sectors such as oil and gas, where existing systems may need extensive adjustments to accommodate DAS technology.
Opportunity:
-
Unlocking Growth Opportunities in Distributed Acoustic Sensing with Renewable Energy and Smart City Applications
The DAS market is luminous with opportunities due to its high applications in the renewable energy sector and smart city projects. DAS solutions enable the protection of assets and ensure optimal functioning, especially across expanding wind farms, solar plants, and hydropower facilities. Besides, DAS-based applications in railway networks for track monitoring, cable theft detection, and landslide detection offer profitable growth opportunities. In addition, growing emphasis on data-driven decision-making, and predictive maintenance strategies across various industries are anticipated to provide immense growth opportunities for the DAS market.
Challenges:
-
Tackling Environmental Interference and Skills Gap Challenges in Distributed Acoustic Sensing Systems Deployment
Another significant challenge is environmental factors provide a more active signal interference that renders DAS systems unpredictable. Signals can be disturbed by some external condition’s temperature, vibrations (for example some other equipment can be nearby), electromagnetic measurements, etc. Robust calibration and system maintenance are key for ensuring consistent performance in harsh environments. Also, the requirement for specialized training to operate and interpret DAS systems may lead to a skills gap, adding yet another obstacle to adoption. Addressing these obstacles will take continued innovation in data processing methods, more resilient systems, and concerted efforts across the industry to raise the skill level of the workforce.
Distributed Acoustic Sensing (DAS) Market Segment Analysis
By Fiber
In 2023, Single-Mode Fiber holds the leading share of 67.3% of the total DAS Market. It has overshadowed the rest for its efficient transmission of long signal lengths, low insulation loss, and high detection capacity, allowing the same to be used for oil & gas pipeline monitoring, perimeter security, and seismic detection applications. This has led to the massive deployment of single-mode fiber in communication networks, where its long-haul integrity makes it forever attractive for critical infrastructure monitoring.
The Multimode Fiber is estimated to hold the most rapid compound annual growth rate (CAGR) during the forecast period of 2024-2032 Its low-cost installation, larger bandwidth for short-range applications, and growing usage in industrial plants, data centers, and smart infrastructure projects are drivers of this growth. Multi-mode fiber, driven by the need for localized monitoring and asset protection solutions across industries will continue to witness healthy growth.
By Vertical
Oil & Gas sector was the highest among all sectors, accounting for 27.8% in 2023. This superiority can be attributed to the widespread adoption of DAS technology for pipeline monitoring, leak detection, and perimeter security. DAS systems are also indispensable solutions for energy and utility firms, especially oil and gas companies, as they play a critical role in the collection of data in real-time over large geographical areas, safety maximization, and risk minimization. Hence, due to the effects of the above-mentioned factors on concern over third-party interference, ground movement, and leaks, detection technology has become indispensable for protecting critical energy infrastructure.
The Transportation sector is projected to witness the fastest compound annual growth rate (CAGR) from 2024 to 2032. The increasing focus on monitoring railway tracks, tunnel security, and traffic flow management is propelling the demand of DAS, concerning transportation. They come with real-time alerts on track displacements, landslides, or even trespassing, which make each moving component of the overall system much safer and more efficient. Rise in investment in smart transportation networks, boosting rate of DAS adoption in this domain.
Distributed Acoustic Sensing (DAS) Market Regional Outlook
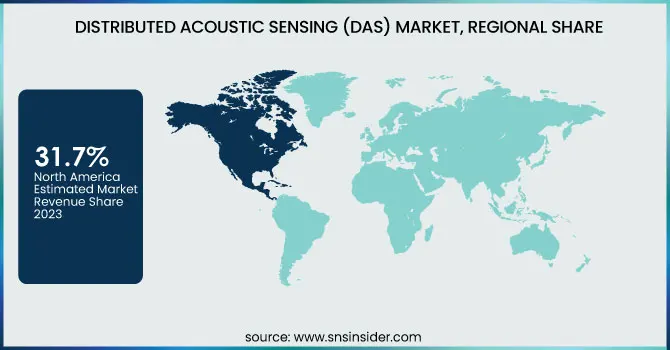
North America held the largest market share of 31.7% in the Distributed Acoustic Sensing (DAS market) market, in 2023, owing to large adoption by oil & & gas, defense, and, infrastructure sectors. Widespread pipeline infrastructure in the region along with the growing investment in advanced pipeline monitoring systems continues to spearhead DAS deployment. As an example, large pipeline operators in both the U.S. and Canada utilize DAS systems to perform leak detection, intrusion detection, and seismic detection to improve safety and operational efficiencies. Sometimes, DAS Technology is widely used in power grid networks in North America and other critical infrastructure projects for enhanced security against possible threats.
Asia-Pacific will be the fastest-growing region between 2024 and 2032, due to rapid industrialization, infrastructure, and smart city solution development. Countries including China and India are utilizing DAS systems for railway track monitoring to identify cable theft, track displacement, and trespassers. System integration in Chinese railway networks has enhanced passenger safety and expedited the maintenance processes, promoting overall operational efficiency in transport networks.
Get Customized Report as per Your Business Requirement - Enquiry Now
Key Players
Some of the major players in the Distributed Acoustic Sensing (DAS) Market are:
-
Halliburton (RezConnect)
-
Schlumberger (Optiq)
-
Baker Hughes (SENSA)
-
Fotech Solutions (Helios DAS)
-
Silixa Ltd (iDAS)
-
OptaSense (OS6)
-
AP Sensing (N4387A)
-
Hifi Engineering Inc. (HDS DAS)
-
Future Fibre Technologies (FFT) (Aura Ai-2)
-
Bandweaver (DAS3000)
-
Fugro (OptoDAS)
-
Omnisens (DAS 2.0)
-
Aragon Photonics (HDAS)
-
LIOS Technology (NKT Photonics) (LIOSTM EN.SURE)
-
DarkPulse Inc. (DarkPulse DAS)
Recent Trends
-
In January 2025, Halliburton partnered with Coterra Energy Inc. to launch the Octiv® Auto Frac service, an autonomous hydraulic fracturing solution that enhances operational efficiency and wellbore integrity.
| Report Attributes | Details |
|---|---|
| Market Size in 2023 | USD 631.45 Million |
| Market Size by 2032 | USD 1528.88 Million |
| CAGR | CAGR of 10.37% From 2024 to 2032 |
| Base Year | 2023 |
| Forecast Period | 2024-2032 |
| Historical Data | 2020-2022 |
| Report Scope & Coverage | Market Size, Segments Analysis, Competitive Landscape, Regional Analysis, DROC & SWOT Analysis, Forecast Outlook |
| Key Segments | • By Fiber (Single-Mode Fiber, Multimode Fiber) • By Vertical (Oil & Gas, Power & Utility, Security & Surveillance, Environment & Infrastructure, Transportation, Others) |
| Regional Analysis/Coverage | North America (US, Canada, Mexico), Europe (Eastern Europe [Poland, Romania, Hungary, Turkey, Rest of Eastern Europe] Western Europe] Germany, France, UK, Italy, Spain, Netherlands, Switzerland, Austria, Rest of Western Europe]), Asia Pacific (China, India, Japan, South Korea, Vietnam, Singapore, Australia, Rest of Asia Pacific), Middle East & Africa (Middle East [UAE, Egypt, Saudi Arabia, Qatar, Rest of Middle East], Africa [Nigeria, South Africa, Rest of Africa], Latin America (Brazil, Argentina, Colombia, Rest of Latin America) |
| Company Profiles | Halliburton, Schlumberger, Baker Hughes, Fotech Solutions, Silixa Ltd, OptaSense, AP Sensing, Hifi Engineering Inc., Future Fibre Technologies (FFT), Bandweaver, Fugro, Omnisens, Aragon Photonics, LIOS Technology (NKT Photonics), DarkPulse Inc. |
