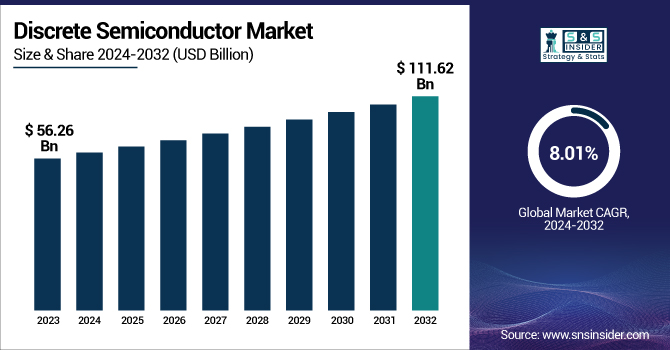
The Discrete Semiconductor Market Size was valued at USD 56.26 billion in 2023 and is expected to reach USD 111.62 billion by 2032 and grow at a CAGR of 8.01% over the forecast period 2024-2032.
To Get more information on Discrete Semiconductor Market - Request Free Sample Report
Discrete Semiconductor Industry is the crux of modern day electronics that includes a wide range of products like diodes, transistors, thyristors and IGBTs that molecularly are integral building bricks to modulate and handle electrical signals and power. These building blocks are used in a wide range of industries, including but not limited to automobiles, consumer electronics, telecommunications, industrial control, and renewable energy. The widespread uptake of energy-saving products, the proliferation of electric vehicles, and greater usage of industrial automation and 5G infrastructure are some of the key growth drivers for the industry. Asia Pacific dominates the market due in part to its strong manufacturing capability and also via its growing consumer electronics utilization, while the automotive segment is the fastest growing. Continuous developments in silicon and wide-bandgap materials, particularly SiC and GaN, are also producing better performance and reliability, broadening the discrete semiconductor exchange market even further.
The U.S. Discrete Semiconductor Market size was USD 7.91 billion in 2023 and is expected to reach USD 16.72 billion by 2032, growing at a CAGR of 8.77% over the forecast period of 2024–2032. As industries are continuously looking for devices that are efficient and can save a good amount of power, the US Discrete Semiconductor Market is witnessing gradual growth. Discrete semiconductors are a vital component of other applications such as automotive systems, telecommunications, industrial automation, and consumer electronics, enabling power management, performance, and device protection. Advancements like the move to electric cars and the introduction of 5G networks are also driving adoption. Similarly, the increasing focus on domestic semiconductor manufacturing, supported with favorable government policies, is boosting production capacity and innovation. With an enhanced focus by industries on smarter and sustainable technologies in general, the U.S. market is expected to maintain a strong momentum during the forecast period and will be further consolidated within the global semiconductor ecosystem.
Market Dynamics
Key Drivers:
Rising Adoption of Power-Efficient Semiconductor Devices in Electric Vehicles and Industrial Applications Drives Market Expansion.
Increased energy efficiency demand across automotive and industrial applications is increasingly driving the uptake of discrete semiconductors. Discrete semiconductors, like MOSFETs and IGBTs, play key roles in optimizing power conversion and power management in electric vehicles (EVs), renewable energy installations, and industrial automation devices. As EV manufacturing increases and industries upgrade their facilities, manufacturers are progressively adopting advanced discrete components to enhance performance and minimize power loss. Furthermore, government regulations favoring clean energy and vehicle electrification are also driving demand. The imperative to lower carbon emissions and enhance system reliability renders power-efficient semiconductors a necessity in next-generation applications. This will continue, making discrete semiconductors foundational components in new technology ecosystems.
Restrain:
High Sensitivity to Fluctuations in Raw Material Prices Restrains the Growth of the Discrete Semiconductor Market Globally.
The discrete semiconductor sector is highly sensitive to fluctuations in raw materials, particularly the prices of silicon, gallium, and specialty metals. The prices of these commodities directly affect production cost, thus manufacturers' profit margins. These price swings are triggered by global supply chain disruptions, geopolitical tensions, or sudden spikes in demand, so on the big picture, it’s hard to predict what the prices will be over the next several years. When the prices of raw materials surge, smaller companies can struggle to stay competitive and may postpone innovation or increased capacity, experts say. Erratic pricing can also push up-end-user product costs, impacting demand in consumer electronics, automotive, and industrial markets. Price swings in key inputs consequently present a significant constraint, limiting stable growth and forcing firms to revise sourcing and inventory plans.
Opportunities:
Emergence of Wide-Bandgap Materials like Silicon Carbide and Gallium Nitride Presents New Growth Opportunities for the Market.
Discrete semiconductor devices are emerging with wide-bandgap materials such as Silicon Carbide (SiC) and Gallium Nitride (GaN) that are the subjects of our industry discussions, and this will be further discussed in this paper. They have further benefits such as higher voltage tolerance, better thermal characteristics, and in many cases, higher energy efficiency compared to their silicon-based counterparts. With industries ranging from electric vehicles to aerospace to renewable energy having more demanding requirements for performance, there is also increasing adoption of SiC and GaN. Such materials enable smaller, faster, and more reliable power electronics, making them ideal for high-frequency and high-power applications. Moreover, their adoption is in line with global trends in miniaturization and green technologies. Manufacturers' investments in wide-bandgap material technology will likely enable them to gain a competitive edge and position themselves as front-runners in innovation in an evolving discrete semiconductor market.
Challenges:
Increasing Complexity in Semiconductor Design and Miniaturization Creates Challenges in Manufacturing and Quality Assurance Processes.
The ever-increasing demand for more compact, high-speed, and efficient discrete semiconductor devices due to the increased use of technology is making the design and manufacturing process even more complex. When systems are small, they require very strict processes and quality control in order to be reliable and to be able to perform. Additionally, the increasing demand due to miniaturization in smartphones, wearables, and electric vehicles adds to the pressure. But smaller sizes can create challenges, including higher power density, thermal management issues and reduced defect tolerance. Cost, and development time also increase, as high yield and quality becomes difficult to guarantee. This also needs constant investment in high-end manufacturing technologies and skilled personnel, which can act as a dampener for smaller players. So, design and manufacturing issues remain a significant challenge for the industry.
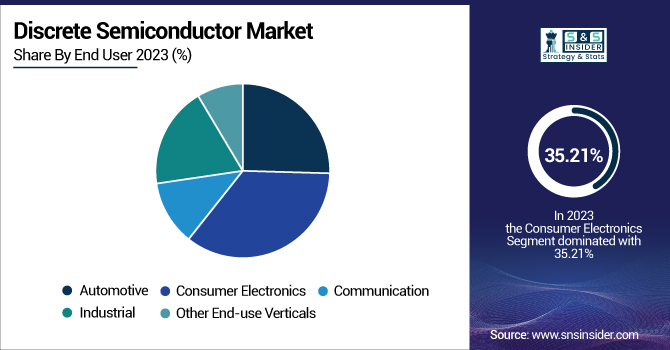
By End User
In 2023, Consumer Electronics segment contributed the highest share in the discrete semiconductors market with associated revenue of 35.21%. This is because of technology such as diodes, transistors, and rectifiers being integrated into product categories including smart phones, laptops, and smart home appliances. Samsung and Apple are still making breakthroughs, meanwhile Toshiba just unveiled state-of-the-art miniaturized transistors to improve power performance inside handheld devices. The consumer electronics industry continues to be a cornerstone of the growth and technological advancement of the semiconductor market with sustained semiconductor usage based on increasing consumer demand for smaller, more powerful, and power-efficient devices.
The Automotive segment is projected be grow at the fastest CAGR during the forecast period 2024 to 2032. Discrete semiconductors as EVs, adaptive cruise control (ADAS), and in-vehicle infotainment grow in popularity. IGBTs and MOSFETs like discrete devices are used in EV powertrain, battery management, and motor control. Leading companies such as Infineon Technologies and STMicroelectronics launched new automotive-grade MOSFETs characterized by optimized reliability and heat conduction. Further, Investment in emerging semiconductor technologies are underway from Tesla and BYD to enhance vehicle performance and effective energy consumption. As the automotive sector shifts toward electric and automated vehicles, the demand for discrete semiconductors is pegged to grow exponentially in the coming years, fuelling long-term market expansion.
By Type
The Bipolar Transistor segment dominated in the discrete semiconductor market in 2023 with a total revenue share of 32.39%, attributable to their wide applications in amplification and switching across industrial, automotive, and communication sectors. Bipolar junction transistor (BJT) offers high current gain, which is also very reliable in the power control and analog areas. New high-voltage bipolar transistors targeting energy-efficient power supply and lighting applications have been unveiled by companies including ON Semiconductor and Nexperia. Their stable demand for BJTs exists in power management and signal processing, enabling them to continue being a central participant in the discrete semiconductor market, particularly for applications requiring high-performance and high reliability.
The Diodes segment is expected to Fastest CAGR during the forecast period 2024 to 2032. driven by demand for automotive electronics, consumer products and renewable energy systems. Schottky and Zener diodestypically serve an essential purpose in a circuit for rectifying signals and voltage regulation, and circuit protection. That has prompted companies including Vishay Intertechnology and ROHM Semiconductor to expand their diode product lines, adding new ultra-compact, high-efficiency components for EVs and small electronics. The rapid growth of electric vehicles and smart devices has driven up diode consumption, and this segment is a high growth category in the changing discrete semiconductor market.
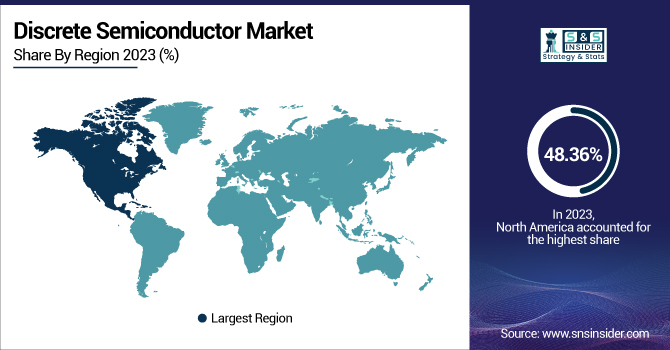
Asia Pacific was the largest discrete semiconductor market, with revenue of 48.36% in 2023, attributed to the strong electronics manufacturing infrastructure and expanding industrial base. Big centers for consumer electronics, automotive manufacturing and semiconductor manufacturing include China, Japan, South Korea and Taiwan. Toshiba and Renesas is among major manufacturers who have launched new discrete energy saving solutions for electric vehicles (EVs) and for industrial automation (IA). For instance, Toshiba introduced new SiC MOSFETs for high-voltage applications to boost power efficiency. The should emphasizeong mga pisikal na gawain para sa MRF ay dapat mappedcreating synergies between theleading mga broomeshould look on the press media the OEMs looked on the press media OEMs.
North America is expected to grow at the Fastest CAGR and hold a major share in discrete semiconductor market during the period of 2024-2032 owing to rapid growth of electric automobile, aerospace and automated manufacturing. It benefits from higher R&D spending and pro-government initiatives like the CHIPS act aimed at boosting local semiconductor production. Companies such as ON Semiconductor and Texas Instruments are expanding their product offerings with advancements in MOSFETs, diodes, and IGBTs for automotive and renewable energy markets. Due to the strong focus on technology self-sufficiency and sustainability in this region, demand for high-efficiency discrete components is increasing, making North America a high growth market segment.
Get Customized Report as per Your Business Requirement - Enquiry Now
ABB – (5STP 20N5200, 5SNA 1500E330100)
Diodes Incorporated – (DMN62D0UDW-7, DDTC124XUA-7)
Nexperia BV – (PSMN2R6-80BS, BAS16)
Infineon Technologies AG – (IRLZ44N, IDH20G65C5)
Toshiba Corporation – (TK5A65D, GT20J322)
STMicroelectronics – (STP75NF75, STTH8S06D)
ON Semiconductor (onsemi) – (2N7000, FGH40N60SFD)
ROHM Semiconductor – (SCT3030AL, RGS20TS65)
Texas Instruments Inc. – (CSD19536KTT, TIP120)
Vishay Intertechnology, Inc. – (IRF540N, VS-40TPS12PBF)
December 2024, STMicroelectronics launched the STM32N6 series microcontrollers designed for edge AI and machine learning applications in consumer and industrial electronics.
November 2023, Nexperia launched its first silicon carbide (SiC) MOSFETs with two 1200V discrete devices, marking its entry into the SiC power semiconductor market.
| Report Attributes | Details |
|---|---|
| Market Size in 2023 | USD 56.26 Billion |
| Market Size by 2032 | USD 111.62 Billion |
| CAGR | CAGR of 8.01 % From 2024 to 2032 |
| Base Year | 2023 |
| Forecast Period | 2024-2032 |
| Historical Data | 2020-2022 |
| Report Scope & Coverage | Market Size, Segments Analysis, Competitive Landscape, Regional Analysis, DROC & SWOT Analysis, Forecast Outlook |
| Key Segments | •By End User - (Automotive, Consumer Electronics, Communication, Industrial, Other End-use Verticals) •By Type - (Diodes, IGBT, Bipolar Transistor, Thyristor, Rectifier, Other) |
| Regional Analysis/Coverage | North America (US, Canada, Mexico), Europe (Eastern Europe [Poland, Romania, Hungary, Turkey, Rest of Eastern Europe] Western Europe] Germany, France, UK, Italy, Spain, Netherlands, Switzerland, Austria, Rest of Western Europe]), Asia Pacific (China, India, Japan, South Korea, Vietnam, Singapore, Australia, Rest of Asia Pacific), Middle East & Africa (Middle East [UAE, Egypt, Saudi Arabia, Qatar, Rest of Middle East], Africa [Nigeria, South Africa, Rest of Africa], Latin America (Brazil, Argentina, Colombia, Rest of Latin America) |
| Company Profiles | ABB, Diodes Incorporated, Nexperia BV, D3 Semiconductor, Eaton, Hitachi Ltd., Mitsubishi Electric Corporation, STMicroelectronics NV, Taiwan Semiconductor Manufacturing Company Limited, Vishay Intertechnology Inc. |
Ans: The Discrete Semiconductor Market is expected to grow at a CAGR of 8.01% from 2024-2032.
Ans: The Discrete Semiconductor Market size was USD 56.26 billion in 2023 and is expected to reach USD 111.62 billion by 2032.
Ans: The major growth factor of the Discrete Semiconductor Market is the increasing adoption of electric vehicles and renewable energy systems requiring efficient power management components.
Ans: The Consumer Electronics segment dominated the Discrete Semiconductor Market.
Ans: Asia Pacific dominated the Discrete Semiconductor Market in 2023.
Table of Content
1. Introduction
1.1 Market Definition
1.2 Scope (Inclusion and Exclusions)
1.3 Research Assumptions
2. Executive Summary
2.1 Market Overview
2.2 Regional Synopsis
2.3 Competitive Summary
3. Research Methodology
3.1 Top-Down Approach
3.2 Bottom-up Approach
3.3. Data Validation
3.4 Primary Interviews
4. Market Dynamics Impact Analysis
4.1 Market Driving Factors Analysis
4.1.2 Drivers
4.1.2 Restraints
4.1.3 Opportunities
4.1.4 Challenges
4.2 PESTLE Analysis
4.3 Porter’s Five Forces Model
5. Statistical Insights and Trends Reporting
5.1 Supply Chain & Value Chain Analysis (2023)
5.2 Demand & Consumption Analysis, (2023),
5.3 R&D Analysis
5.4 Production Statistics
6. Competitive Landscape
6.1 List of Major Companies, By Region
6.2 Market Share Analysis, By Region
6.3 Product Benchmarking
6.3.1 Product specifications and features
6.3.2 Pricing
6.4 Strategic Initiatives
6.4.1 Marketing and promotional activities
6.4.2 Distribution and supply chain strategies
6.4.3 Expansion plans and new product launches
6.4.4 Strategic partnerships and collaborations
6.5 Technological Advancements
6.6 Market Positioning and Branding
7. Discrete Semiconductor Market Segmentation, By End User
7.1 Chapter Overview
7.2 Automotive
7.2.1 Automotive Market Trends Analysis (2020-2032)
7.2.2 Automotive Market Size Estimates and Forecasts to 2032 (USD Billion)
7.3 Consumer Electronics
7.3.1 Consumer Electronics Market Trends Analysis (2020-2032)
7.3.2 Consumer Electronics Market Size Estimates and Forecasts to 2032 (USD Billion)
7.4 Communication
7.4.1 Communication Market Trends Analysis (2020-2032)
7.4.2 Communication Market Size Estimates and Forecasts to 2032 (USD Billion)
7.5 Industrial
7.5.1 Industrial Market Trends Analysis (2020-2032)
7.5.2 Industrial Market Size Estimates and Forecasts to 2032 (USD Billion)
7.6 Other End-use Verticals
7.6.1 Other End-use Verticals Market Trends Analysis (2020-2032)
7.6.2 Other End-use Verticals Market Size Estimates and Forecasts to 2032 (USD Billion)
8. Discrete Semiconductor Market Segmentation, By Type
8.1 Chapter Overview
8.2 Diodes
8.2.1 Diodes Market Trends Analysis (2020-2032)
8.2.2 Diodes Market Size Estimates and Forecasts to 2032 (USD Billion)
8.3 IGBT
8.3.1 IGBT Market Trends Analysis (2020-2032)
8.3.2 IGBT Market Size Estimates and Forecasts to 2032 (USD Billion)
8.4 Bipolar Transistor
8.4.1 Bipolar Transistor Market Trends Analysis (2020-2032)
8.4.2 Bipolar Transistor Market Size Estimates and Forecasts to 2032 (USD Billion)
8.5 Thyristor
8.5.1 Thyristor Market Trends Analysis (2020-2032)
8.5.2 Thyristor Market Size Estimates and Forecasts to 2032 (USD Billion)
8.6 Rectifier
8.6.1 Rectifier Market Trends Analysis (2020-2032)
8.6.2 Rectifier Market Size Estimates and Forecasts to 2032 (USD Billion)
8.7 Other
8.7.1 Other Market Trends Analysis (2020-2032)
8.7.2 Other Market Size Estimates and Forecasts to 2032 (USD Billion)
9. Regional Analysis
9.1 Chapter Overview
9.2 North America
9.2.1 Trends Analysis
9.2.2 North America Discrete Semiconductor Market Estimates and Forecasts, by Country (2020-2032) (USD Billion)
9.2.3 North America Discrete Semiconductor Market Estimates and Forecasts, By End User (2020-2032) (USD Billion)
9.2.4 North America Discrete Semiconductor Market Estimates and Forecasts, By Type (2020-2032) (USD Billion)
9.2.5 USA
9.2.5.1 USA Discrete Semiconductor Market Estimates and Forecasts, By End User (2020-2032) (USD Billion)
9.2.5.2 USA Discrete Semiconductor Market Estimates and Forecasts, By Type (2020-2032) (USD Billion)
9.2.6 Canada
9.2.6.1 Canada Discrete Semiconductor Market Estimates and Forecasts, By End User (2020-2032) (USD Billion)
9.2.6.2 Canada Discrete Semiconductor Market Estimates and Forecasts, By Type (2020-2032) (USD Billion)
9.2.7 Mexico
9.2.7.1 Mexico Discrete Semiconductor Market Estimates and Forecasts, By End User (2020-2032) (USD Billion)
9.2.7.2 Mexico Discrete Semiconductor Market Estimates and Forecasts, By Type (2020-2032) (USD Billion)
9.3 Europe
9.3.1 Eastern Europe
9.3.1.1 Trends Analysis
9.3.1.2 Eastern Europe Discrete Semiconductor Market Estimates and Forecasts, by Country (2020-2032) (USD Billion)
9.3.1.3 Eastern Europe Discrete Semiconductor Market Estimates and Forecasts, By End User (2020-2032) (USD Billion)
9.3.1.4 Eastern Europe Discrete Semiconductor Market Estimates and Forecasts, By Type (2020-2032) (USD Billion)
9.3.1.5 Poland
9.3.1.5.1 Poland Discrete Semiconductor Market Estimates and Forecasts, By End User (2020-2032) (USD Billion)
9.3.1.5.2 Poland Discrete Semiconductor Market Estimates and Forecasts, By Type (2020-2032) (USD Billion)
9.3.1.6 Romania
9.3.1.6.1 Romania Discrete Semiconductor Market Estimates and Forecasts, By End User (2020-2032) (USD Billion)
9.3.1.6.2 Romania Discrete Semiconductor Market Estimates and Forecasts, By Type (2020-2032) (USD Billion)
9.3.1.7 Hungary
9.3.1.7.1 Hungary Discrete Semiconductor Market Estimates and Forecasts, By End User (2020-2032) (USD Billion)
9.3.1.7.2 Hungary Discrete Semiconductor Market Estimates and Forecasts, By Type (2020-2032) (USD Billion)
9.3.1.8 Turkey
9.3.1.8.1 Turkey Discrete Semiconductor Market Estimates and Forecasts, By End User (2020-2032) (USD Billion)
9.3.1.8.2 Turkey Discrete Semiconductor Market Estimates and Forecasts, By Type (2020-2032) (USD Billion)
9.3.1.9 Rest of Eastern Europe
9.3.1.9.1 Rest of Eastern Europe Discrete Semiconductor Market Estimates and Forecasts, By End User (2020-2032) (USD Billion)
9.3.1.9.2 Rest of Eastern Europe Discrete Semiconductor Market Estimates and Forecasts, By Type (2020-2032) (USD Billion)
9.3.2 Western Europe
9.3.2.1 Trends Analysis
9.3.2.2 Western Europe Discrete Semiconductor Market Estimates and Forecasts, by Country (2020-2032) (USD Billion)
9.3.2.3 Western Europe Discrete Semiconductor Market Estimates and Forecasts, By End User (2020-2032) (USD Billion)
9.3.2.4 Western Europe Discrete Semiconductor Market Estimates and Forecasts, By Type (2020-2032) (USD Billion)
9.3.2.5 Germany
9.3.2.5.1 Germany Discrete Semiconductor Market Estimates and Forecasts, By End User (2020-2032) (USD Billion)
9.3.2.5.2 Germany Discrete Semiconductor Market Estimates and Forecasts, By Type (2020-2032) (USD Billion)
9.3.2.6 France
9.3.2.6.1 France Discrete Semiconductor Market Estimates and Forecasts, By End User (2020-2032) (USD Billion)
9.3.2.6.2 France Discrete Semiconductor Market Estimates and Forecasts, By Type (2020-2032) (USD Billion)
9.3.2.7 UK
9.3.2.7.1 UK Discrete Semiconductor Market Estimates and Forecasts, By End User (2020-2032) (USD Billion)
9.3.2.7.2 UK Discrete Semiconductor Market Estimates and Forecasts, By Type (2020-2032) (USD Billion)
9.3.2.8 Italy
9.3.2.8.1 Italy Discrete Semiconductor Market Estimates and Forecasts, By End User (2020-2032) (USD Billion)
9.3.2.8.2 Italy Discrete Semiconductor Market Estimates and Forecasts, By Type (2020-2032) (USD Billion)
9.3.2.9 Spain
9.3.2.9.1 Spain Discrete Semiconductor Market Estimates and Forecasts, By End User (2020-2032) (USD Billion)
9.3.2.9.2 Spain Discrete Semiconductor Market Estimates and Forecasts, By Type (2020-2032) (USD Billion)
9.3.2.10 Netherlands
9.3.2.10.1 Netherlands Discrete Semiconductor Market Estimates and Forecasts, By End User (2020-2032) (USD Billion)
9.3.2.10.2 Netherlands Discrete Semiconductor Market Estimates and Forecasts, By Type (2020-2032) (USD Billion)
9.3.2.11 Switzerland
9.3.2.11.1 Switzerland Discrete Semiconductor Market Estimates and Forecasts, By End User (2020-2032) (USD Billion)
9.3.2.11.2 Switzerland Discrete Semiconductor Market Estimates and Forecasts, By Type (2020-2032) (USD Billion)
9.3.2.12 Austria
9.3.2.12.1 Austria Discrete Semiconductor Market Estimates and Forecasts, By End User (2020-2032) (USD Billion)
9.3.2.12.2 Austria Discrete Semiconductor Market Estimates and Forecasts, By Type (2020-2032) (USD Billion)
9.3.2.13 Rest of Western Europe
9.3.2.13.1 Rest of Western Europe Discrete Semiconductor Market Estimates and Forecasts, By End User (2020-2032) (USD Billion)
9.3.2.13.2 Rest of Western Europe Discrete Semiconductor Market Estimates and Forecasts, By Type (2020-2032) (USD Billion)
9.4 Asia Pacific
9.4.1 Trends Analysis
9.4.2 Asia Pacific Discrete Semiconductor Market Estimates and Forecasts, by Country (2020-2032) (USD Billion)
9.4.3 Asia Pacific Discrete Semiconductor Market Estimates and Forecasts, By End User (2020-2032) (USD Billion)
9.4.4 Asia Pacific Discrete Semiconductor Market Estimates and Forecasts, By Type (2020-2032) (USD Billion)
9.4.5 China
9.4.5.1 China Discrete Semiconductor Market Estimates and Forecasts, By End User (2020-2032) (USD Billion)
9.4.5.2 China Discrete Semiconductor Market Estimates and Forecasts, By Type (2020-2032) (USD Billion)
9.4.6 India
9.4.5.1 India Discrete Semiconductor Market Estimates and Forecasts, By End User (2020-2032) (USD Billion)
9.4.5.2 India Discrete Semiconductor Market Estimates and Forecasts, By Type (2020-2032) (USD Billion)
9.4.5 Japan
9.4.5.1 Japan Discrete Semiconductor Market Estimates and Forecasts, By End User (2020-2032) (USD Billion)
9.4.5.2 Japan Discrete Semiconductor Market Estimates and Forecasts, By Type (2020-2032) (USD Billion)
9.4.6 South Korea
9.4.6.1 South Korea Discrete Semiconductor Market Estimates and Forecasts, By End User (2020-2032) (USD Billion)
9.4.6.2 South Korea Discrete Semiconductor Market Estimates and Forecasts, By Type (2020-2032) (USD Billion)
9.4.7 Vietnam
9.4.7.1 Vietnam Discrete Semiconductor Market Estimates and Forecasts, By End User (2020-2032) (USD Billion)
9.2.7.2 Vietnam Discrete Semiconductor Market Estimates and Forecasts, By Type (2020-2032) (USD Billion)
9.4.8 Singapore
9.4.8.1 Singapore Discrete Semiconductor Market Estimates and Forecasts, By End User (2020-2032) (USD Billion)
9.4.8.2 Singapore Discrete Semiconductor Market Estimates and Forecasts, By Type (2020-2032) (USD Billion)
9.4.9 Australia
9.4.9.1 Australia Discrete Semiconductor Market Estimates and Forecasts, By End User (2020-2032) (USD Billion)
9.4.9.2 Australia Discrete Semiconductor Market Estimates and Forecasts, By Type (2020-2032) (USD Billion)
9.4.10 Rest of Asia Pacific
9.4.10.1 Rest of Asia Pacific Discrete Semiconductor Market Estimates and Forecasts, By End User (2020-2032) (USD Billion)
9.4.10.2 Rest of Asia Pacific Discrete Semiconductor Market Estimates and Forecasts, By Type (2020-2032) (USD Billion)
9.5 Middle East and Africa
9.5.1 Middle East
9.5.1.1 Trends Analysis
9.5.1.2 Middle East Discrete Semiconductor Market Estimates and Forecasts, by Country (2020-2032) (USD Billion)
9.5.1.3 Middle East Discrete Semiconductor Market Estimates and Forecasts, By End User (2020-2032) (USD Billion)
9.5.1.4 Middle East Discrete Semiconductor Market Estimates and Forecasts, By Type (2020-2032) (USD Billion)
9.5.1.5 UAE
9.5.1.5.1 UAE Discrete Semiconductor Market Estimates and Forecasts, By End User (2020-2032) (USD Billion)
9.5.1.5.2 UAE Discrete Semiconductor Market Estimates and Forecasts, By Type (2020-2032) (USD Billion)
9.5.1.6 Egypt
9.5.1.6.1 Egypt Discrete Semiconductor Market Estimates and Forecasts, By End User (2020-2032) (USD Billion)
9.5.1.6.2 Egypt Discrete Semiconductor Market Estimates and Forecasts, By Type (2020-2032) (USD Billion)
9.5.1.7 Saudi Arabia
9.5.1.7.1 Saudi Arabia Discrete Semiconductor Market Estimates and Forecasts, By End User (2020-2032) (USD Billion)
9.5.1.7.2 Saudi Arabia Discrete Semiconductor Market Estimates and Forecasts, By Type (2020-2032) (USD Billion)
9.5.1.8 Qatar
9.5.1.8.1 Qatar Discrete Semiconductor Market Estimates and Forecasts, By End User (2020-2032) (USD Billion)
9.5.1.8.2 Qatar Discrete Semiconductor Market Estimates and Forecasts, By Type (2020-2032) (USD Billion)
9.5.1.9 Rest of Middle East
9.5.1.9.1 Rest of Middle East Discrete Semiconductor Market Estimates and Forecasts, By End User (2020-2032) (USD Billion)
9.5.1.9.2 Rest of Middle East Discrete Semiconductor Market Estimates and Forecasts, By Type (2020-2032) (USD Billion)
9.5.2 Africa
9.5.2.1 Trends Analysis
9.5.2.2 Africa Discrete Semiconductor Market Estimates and Forecasts, by Country (2020-2032) (USD Billion)
9.5.2.3 Africa Discrete Semiconductor Market Estimates and Forecasts, By End User (2020-2032) (USD Billion)
9.5.2.4 Africa Discrete Semiconductor Market Estimates and Forecasts, By Type (2020-2032) (USD Billion)
9.5.2.5 South Africa
9.5.2.5.1 South Africa Discrete Semiconductor Market Estimates and Forecasts, By End User (2020-2032) (USD Billion)
9.5.2.5.2 South Africa Discrete Semiconductor Market Estimates and Forecasts, By Type (2020-2032) (USD Billion)
9.5.2.6 Nigeria
9.5.2.6.1 Nigeria Discrete Semiconductor Market Estimates and Forecasts, By End User (2020-2032) (USD Billion)
9.5.2.6.2 Nigeria Discrete Semiconductor Market Estimates and Forecasts, By Type (2020-2032) (USD Billion)
9.5.2.7 Rest of Africa
9.5.2.7.1 Rest of Africa Discrete Semiconductor Market Estimates and Forecasts, By End User (2020-2032) (USD Billion)
9.5.2.7.2 Rest of Africa Discrete Semiconductor Market Estimates and Forecasts, By Type (2020-2032) (USD Billion)
9.6 Latin America
9.6.1 Trends Analysis
9.6.2 Latin America Discrete Semiconductor Market Estimates and Forecasts, by Country (2020-2032) (USD Billion)
9.6.3 Latin America Discrete Semiconductor Market Estimates and Forecasts, By End User (2020-2032) (USD Billion)
9.6.4 Latin America Discrete Semiconductor Market Estimates and Forecasts, By Type (2020-2032) (USD Billion)
9.6.5 Brazil
9.6.5.1 Brazil Discrete Semiconductor Market Estimates and Forecasts, By End User (2020-2032) (USD Billion)
9.6.5.2 Brazil Discrete Semiconductor Market Estimates and Forecasts, By Type (2020-2032) (USD Billion)
9.6.6 Argentina
9.6.6.1 Argentina Discrete Semiconductor Market Estimates and Forecasts, By End User (2020-2032) (USD Billion)
9.6.6.2 Argentina Discrete Semiconductor Market Estimates and Forecasts, By Type (2020-2032) (USD Billion)
9.6.7 Colombia
9.6.7.1 Colombia Discrete Semiconductor Market Estimates and Forecasts, By End User (2020-2032) (USD Billion)
9.6.7.2 Colombia Discrete Semiconductor Market Estimates and Forecasts, By Type (2020-2032) (USD Billion)
9.6.8 Rest of Latin America
9.6.8.1 Rest of Latin America Discrete Semiconductor Market Estimates and Forecasts, By End User (2020-2032) (USD Billion)
9.6.8.2 Rest of Latin America Discrete Semiconductor Market Estimates and Forecasts, By Type (2020-2032) (USD Billion)
10. Company Profiles
10.1 ABB
10.1.1 Company Overview
10.1.2 Financial
10.1.3 Products/ Services Offered
110.1.4 SWOT Analysis
10.2 Diodes Incorporated
10.2.1 Company Overview
10.2.2 Financial
10.2.3 Products/ Services Offered
10.2.4 SWOT Analysis
10.3 Nexperia BV
10.3.1 Company Overview
10.3.2 Financial
10.3.3 Products/ Services Offered
10.3.4 SWOT Analysis
10.4 Infineon Technologies AG
10.4.1 Company Overview
10.4.2 Financial
10.4.3 Products/ Services Offered
10.4.4 SWOT Analysis
10.5 Toshiba Corporation
10.5.1 Company Overview
10.5.2 Financial
10.5.3 Products/ Services Offered
10.5.4 SWOT Analysis
10.6 STMicroelectronics
10.6.1 Company Overview
10.6.2 Financial
10.6.3 Products/ Services Offered
10.6.4 SWOT Analysis
10.7 ON Semiconductor (onsemi)
10.7.1 Company Overview
10.7.2 Financial
10.7.3 Products/ Services Offered
10.7.4 SWOT Analysis
10.8 ROHM Semiconductor
10.8.1 Company Overview
10.8.2 Financial
10.8.3 Products/ Services Offered
10.8.4 SWOT Analysis
10.9 Texas Instruments Inc.
10.9.1 Company Overview
10.9.2 Financial
10.9.3 Products/ Services Offered
10.9.4 SWOT Analysis
10.10 Vishay Intertechnology, Inc.
10.9.1 Company Overview
10.9.2 Financial
10.9.3 Products/ Services Offered
10.9.4 SWOT Analysis
11. Use Cases and Best Practices
12. Conclusion
An accurate research report requires proper strategizing as well as implementation. There are multiple factors involved in the completion of good and accurate research report and selecting the best methodology to compete the research is the toughest part. Since the research reports we provide play a crucial role in any company’s decision-making process, therefore we at SNS Insider always believe that we should choose the best method which gives us results closer to reality. This allows us to reach at a stage wherein we can provide our clients best and accurate investment to output ratio.
Each report that we prepare takes a timeframe of 350-400 business hours for production. Starting from the selection of titles through a couple of in-depth brain storming session to the final QC process before uploading our titles on our website we dedicate around 350 working hours. The titles are selected based on their current market cap and the foreseen CAGR and growth.
The 5 steps process:
Step 1: Secondary Research:
Secondary Research or Desk Research is as the name suggests is a research process wherein, we collect data through the readily available information. In this process we use various paid and unpaid databases which our team has access to and gather data through the same. This includes examining of listed companies’ annual reports, Journals, SEC filling etc. Apart from this our team has access to various associations across the globe across different industries. Lastly, we have exchange relationships with various university as well as individual libraries.

Step 2: Primary Research
When we talk about primary research, it is a type of study in which the researchers collect relevant data samples directly, rather than relying on previously collected data. This type of research is focused on gaining content specific facts that can be sued to solve specific problems. Since the collected data is fresh and first hand therefore it makes the study more accurate and genuine.
We at SNS Insider have divided Primary Research into 2 parts.
Part 1 wherein we interview the KOLs of major players as well as the upcoming ones across various geographic regions. This allows us to have their view over the market scenario and acts as an important tool to come closer to the accurate market numbers. As many as 45 paid and unpaid primary interviews are taken from both the demand and supply side of the industry to make sure we land at an accurate judgement and analysis of the market.
This step involves the triangulation of data wherein our team analyses the interview transcripts, online survey responses and observation of on filed participants. The below mentioned chart should give a better understanding of the part 1 of the primary interview.

Part 2: In this part of primary research the data collected via secondary research and the part 1 of the primary research is validated with the interviews from individual consultants and subject matter experts.
Consultants are those set of people who have at least 12 years of experience and expertise within the industry whereas Subject Matter Experts are those with at least 15 years of experience behind their back within the same space. The data with the help of two main processes i.e., FGDs (Focused Group Discussions) and IDs (Individual Discussions). This gives us a 3rd party nonbiased primary view of the market scenario making it a more dependable one while collation of the data pointers.
Step 3: Data Bank Validation
Once all the information is collected via primary and secondary sources, we run that information for data validation. At our intelligence centre our research heads track a lot of information related to the market which includes the quarterly reports, the daily stock prices, and other relevant information. Our data bank server gets updated every fortnight and that is how the information which we collected using our primary and secondary information is revalidated in real time.

Step 4: QA/QC Process
After all the data collection and validation our team does a final level of quality check and quality assurance to get rid of any unwanted or undesired mistakes. This might include but not limited to getting rid of the any typos, duplication of numbers or missing of any important information. The people involved in this process include technical content writers, research heads and graphics people. Once this process is completed the title gets uploader on our platform for our clients to read it.
Step 5: Final QC/QA Process:
This is the last process and comes when the client has ordered the study. In this process a final QA/QC is done before the study is emailed to the client. Since we believe in giving our clients a good experience of our research studies, therefore, to make sure that we do not lack at our end in any way humanly possible we do a final round of quality check and then dispatch the study to the client.
Key Segments:
By End User
Automotive
Consumer Electronics
Communication
Industrial
Other End-use Verticals
By Type
Diodes
IGBT
Bipolar Transistor
Thyristor
Rectifier
Other
Request for Segment Customization as per your Business Requirement: Segment Customization Request
Regional Coverage:
North America
US
Canada
Mexico
Europe
Eastern Europe
Poland
Romania
Hungary
Turkey
Rest of Eastern Europe
Western Europe
Germany
France
UK
Italy
Spain
Netherlands
Switzerland
Austria
Rest of Western Europe
Asia Pacific
China
India
Japan
South Korea
Vietnam
Singapore
Australia
Rest of Asia Pacific
Middle East & Africa
Middle East
UAE
Egypt
Saudi Arabia
Qatar
Rest of Middle East
Africa
Nigeria
South Africa
Rest of Africa
Latin America
Brazil
Argentina
Colombia
Rest of Latin America
Request for Country Level Research Report: Country Level Customization Request
Available Customization
With the given market data, SNS Insider offers customization as per the company’s specific needs. The following customization options are available for the report:
Detailed Volume Analysis
Criss-Cross segment analysis (e.g. Product X Application)
Competitive Product Benchmarking
Geographic Analysis
Additional countries in any of the regions
Customized Data Representation
Detailed analysis and profiling of additional market players
The Climate Adaptation Market Size was valued at USD 24.58 billion in 2023 and is expected to grow at a CAGR of 9.46% to reach USD 55.44 billion by 2032.
The Mobile Augmented Reality Market was valued at USD 29.2 Billion in 2023 and is expected to reach USD 327.7 Billion by 2032, growing at a CAGR of 30.84%% from 2024-2032.
The Electronic Flight Bag (EFB) Market Size was valued at USD 3.24 Billion in 2023 and expected to grow at 7.2% CAGR to reach USD 6.01 Billion by 2032.
The Interactive Display Market Size was USD 45.06 billion in 2023 & is expected to reach USD 90.66 billion by 2032 & grow at a CAGR of 8.08% by 2024-2032.
The Industrial Radiography Market Size was valued at USD 672.03 million in 2023 and is expected to reach USD 1262.4 million by 2031 and grow at a CAGR of 8.2% over the forecast period 2024-2031.
The Leak Detection Market Size was valued at USD 4.58 billion in 2023 and is expected to grow at a CAGR of 5.31% to reach USD 7.26 billion by 2032.

Hi! Click one of our member below to chat on Phone
© 2025 All Rights Reserved by SNS Insider Pvt Ltd


