Direct Carrier Billing Market Report Scope & Overview:
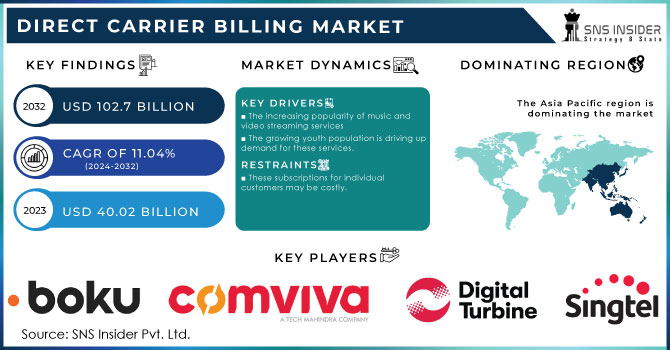
Direct Carrier Billing Market was valued at USD 36.79 billion in 2023 and is expected to reach USD 96.11 billion by 2032, growing at a CAGR of 11.32% from 2024-2032. This report includes key insights into adoption & usage statistics, merchant & operator data, regulatory & compliance information, and security & fraud statistics. The market is growing strongly with growing smartphone penetration, digital content consumption, and the ease of mobile-based payments. Merchants and telecom operators are using this billing option to improve user experience and increase monetization opportunities. Regulatory environments continue to develop, promoting compliance and security while reducing fraud threats. As mobile commerce continues to grow, direct carrier billing is an important facilitator of secure and effortless transactions.
Get more information on Direct Carrier Billing Market - Request Sample Report
Market Dynamics
Drivers
-
Growing Demand for Streaming, Gaming, and In-App Purchases is Driving the Expansion of Direct Carrier Billing Payment Solutions
Increasing demand for mobile gaming, in-app payment, and streaming is having a drastic effect on the market dynamics. With consumers turning digital for entertainment and subscription, demand for effortless payment has exponentially increased. DCB provides the hassle-free card-free option through which consumers are enabled to pay instantaneously with the help of their mobile network providers. The extensive adoption of smartphones, faster internet speeds, and affordable mobile data plans has also contributed to this trend. In addition, the increasing popularity of microtransactions in online games, pay-per-view access to content, and live-streaming services is also consolidating the reliance on DCB. This model not only simplifies payments for customers but also benefits content providers by enhancing monetization opportunities, especially in nations with weak banking infrastructure.
Restraints
-
Regulatory Complexities, Security Risks, and Competition from Digital Payments are Restricting the Growth of Direct Carrier Billing Market
Strict regulations of internet transactions and mobile payments are the biggest hindrance for the Direct Carrier Billing (DCB) Market. Variable compliance norms based on regions only create more intricacies for the service providers and slow down the adoption of markets. Additionally, fraudulent threats, unauthorized transactions, and billing problems also worry both consumers and authorities, triggering closer security measures which may delay ease of transactions. Low-value limits imposed by telecommunication operators on high-value transactions reduce the scalability of DCB in certain sectors. Furthermore, competition from other digital payment means such as mobile wallets and UPI-based payments provides competition, impacting the high usage of DCB in areas where banking networks are well established.
Opportunities
-
Direct Carrier Billing is Enhancing E-Commerce Transactions by Enabling Seamless Payments for Unbanked Consumers and Simplifying Online Retail Purchases
With online shopping increasingly common, online shopping demands easy and convenient payment avenues. Direct carrier billing (DCB) is gaining prominence, allowing customers—especially those with no means of accessing traditional banking services—to shop from their mobile wallets. This eliminates the use of credit cards or virtual wallets, streamlining the transaction process. Expansion of one-click payments and checkout processes without frictions in e-commerce websites is also helping adopt DCB. Besides this, the underbanked and unbanked in the emerging markets would also benefit immensely from this payment method through increased financial inclusion. Merchants can expand the customer base as well as offer a secure, seamless, and intuitive payment method through the inclusion of DCB on retail platforms.
Challenges
-
Mobile Wallets, UPI, and Digital Banking Solutions are Reducing the Adoption of Direct Carrier Billing by Offering Faster and Incentivized Payments
The growth of mobile wallets, UPI, and digital banking solutions is redefining the payment environment with multiple choices in transactions available at higher convenience and lower cost for consumers. They have faster processing, more acceptances among merchants, and irresistible incentives like cashback and discount, which can attract them in comparison to direct carrier billing (DCB). Additionally, the union of digital wallets with e-commerce websites, peer-to-peer transactions, and financial services also expands their dominance. As consumers become accustomed to these payment systems, reliance on DCB is reduced, particularly in regions with extensive banking penetration. DCB providers must improve their services, intensify collaborations, and increase user awareness to differentiate from these prominent digital payment systems.
Segment Analysis
By Authentication
Single Factor Authentication (SFA) led the Direct Carrier Billing Market in 2023 with a 58% revenue share because it is easy to use and provides a frictionless payment experience. Users like fast, one-step authentication processes like SMS-based OTPs or direct mobile billing, which save time at checkout and enhance transaction completion rates. Merchants and service providers also like SFA because it increases user convenience and conversion rates. Moreover, low digital literacy or poor access to multi-factor authentication options in regions depends more on SFA.
Two Factor Authentication (2FA) is expected to grow at the fastest CAGR of 12.54% during 2024-2032 due to increasing security threats and regulatory requirements for secure digital transactions. With growing fraud risks and cybersecurity threats, companies and telecommunication operators are implementing more powerful authentication techniques to safeguard user information. Emerging use of biometric authentication, OTP-based authentication, and app-based security layers is driving this segment's growth. Moreover, consumer awareness regarding digital payment security is driving the adoption for 2FA-based transactions at a faster rate.
By Type
Pure DCB had the largest share in the Direct Carrier Billing Market in 2023, with 39% revenue share, because of its hassles-free payment experience and prevalent use on digital content platforms. This model allows consumers to make purchases directly from their mobile carriers without undergoing extra authentication processes, which makes transactions faster and more convenient for users. Pure DCB is favored by streaming services, gaming platforms, and app stores since it maximizes conversion rates and minimizes payment friction. It also helps it dominate the market due to its compatibility with numerous mobile networks.
MSISDN Forwarding is anticipated to grow at the fastest CAGR of 13.61% during 2024-2032, spurred by improved security and fraud prevention. This process provides safe authentication by forwarding the user's mobile number automatically for verification without requiring manual input. With increasing data privacy regulations and fraud threats, telecom operators and merchants are implementing MSISDN Forwarding to minimize unauthorized transactions. Also, its power to enhance customer experience without affecting security is propelling its exponential growth in many industries.
By End User
Video Content and Movies led the Direct Carrier Billing Market in 2023 in terms of 41% share in revenue thanks to the heightened need for over-the-top streaming services and pay-per-view content. Growing adoption of platforms such as Netflix, Disney+, and local OTT services has given rise to the boom in digital payments, for which DCB provides a smooth payment option. Most users, especially in emerging markets, are fond of using DCB for subscription because it doesn't require the use of credit cards, thereby providing easier access and higher revenue generation.
Games and Apps are anticipated to grow at the fastest CAGR of 12.64% during 2024-2032, thanks to the increasing mobile gaming usage and in-app purchases. The growth of free-to-play games with microtransactions and the increasing use of augmented reality (AR) and virtual reality (VR) applications are driving this segment to grow. App providers and game developers are increasingly adopting DCB to streamline user payments, particularly in regions with low penetration of banks. Moreover, cloud gaming innovations and 5G connectivity are accelerating this segment further.
By Platform
Android dominated the Direct Carrier Billing Market during 2023 with a revenue share of 67% thanks to its better global market reach and large customer base. The price accessibility of Android products, particularly among emerging economies, has fueled growth in mobile subscriptions, promoting usage of DCB for purchasing applications, games, and online streams. Android also features an open ecosystem, and its easy carrier billing integration promotes it as the platform of choice for digital content providers. Complementary partnerships among Google Play and telecom operators consolidate its supremacy further.
iOS will grow at the fastest CAGR of 13.07% during 2024-2032 due to Apple's growing adoption of carrier billing in more markets and its growing premium user base. With more users being willing to pay for apps and subscriptions, iOS is a rich market for DCB adoption. Apple's collaborations with telecom companies to enable carrier billing in newer markets and subscription-based services are driving growth. Also, increased demand for high-end content and in-app purchasing is driving iOS uptake in this segment.
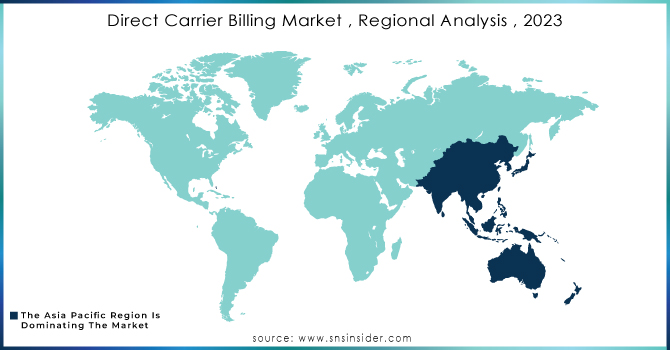
Regional Analysis
North America led the Direct Carrier Billing Market in 2023 with a 37% revenue market share because of high smartphone adoption, a robust digital payment landscape, and aggressive collaboration between telecommunication operators and content providers. The region's mature streaming services, mobile games, and digital subscription market has fueled the massive uptake of DCB. Also, the presence of large technology companies and digital payment providers, along with consumer choice for convenient, cardless transactions, has made the region a revenue leader.
Asia Pacific is expected to grow at the fastest CAGR of 13.07% between 2024-2032, fueled by high-speed smartphone penetration, rising internet penetration, and a huge population without bank accounts that depends on other payment options. The thriving mobile entertainment and gaming market in nations such as China, India, and Indonesia is also driving demand for DCB. Strong growth in telecom infrastructure and increasing collaboration between digital service providers and mobile operators are also improving market accessibility, and the region is the fastest-growing for DCB adoption.
Need any customization research/data on Direct Carrier Billing Market - Enquiry Now
Key Players
-
Google LLC (Google Play Store, Google Pay)
-
Microsoft (Microsoft Store, Xbox Live)
-
Fortumo (Payments Platform, Bundling Platform)
-
Bango.net Limited (Bango Payment Platform, Bango Marketplace)
-
NETWORLD MEDIA GROUP (Mobile Payments Today, Mobile Commerce Daily)
-
DOCOMO Digital (Carrier Billing Solutions, Mobile Wallet Services)
-
Boku Inc. (Mobile Payment Platform, Mobile Identity Solutions)
-
txtNation Limited (Direct Billing Gateway, SMS Gateway)
-
Adpay.net.in (Carrier Billing Services, Mobile Payment Solutions)
-
Mobiyo (Carrier Billing Solutions, Digital Content Monetization)
-
TELENITY (Mobile Payment Gateway, Service Delivery Platform)
-
ZONG (Direct Carrier Billing, Mobile Wallet)
-
HIGHCO (Mobile Payment Solutions, Digital Marketing Services)
-
NTH Mobile (Carrier Billing Services, SMS Messaging Platform)
-
DIMOCO (Billing Platform, Messaging Services)
-
Centili (Mobile Payments Platform, Digital Content Monetization)
-
Singtel (Carrier Billing, Mobile Payment Solutions)
-
Swisscom (Direct Carrier Billing, Mobile Commerce Solutions)
-
Infobip (Mobile Payments, SMS Billing)
-
Paymentwall (Digital Payment Platform, Carrier Billing)
-
Telenor (Direct Carrier Billing, Mobile Payment Gateway)
-
Orange (Carrier Billing, Digital Payment Services)
-
Analysys Mason (Consulting Services, Research & Insights)
-
Lateral Profiles Limited (Mobile Billing Solutions, Payment Gateway)
-
Upstream (Mobile Commerce Platform, Digital Services)
-
Tigo Tanzania (Mobile Money, Carrier Billing)
Recent Developments:
-
2024: Google introduced "Google Standard Payments for Carriers," enhancing Direct Carrier Billing with tokenized payments, fraud detection, daily remittance cycles, and improved authentication methods like USSD PINs. The update replaces DCB3 with API-based transactions instead of file-based reconciliation, improving security and efficiency.
-
October 2024 – Orange and Boku expanded their mobile payment partnership through the "Pay with Orange Bill" API, enabling global businesses to accept alternative payments beyond credit cards. The collaboration allows merchants like Apple, Google, and Netflix to integrate carrier billing, mobile wallets, and real-time bank transfers, making payments more accessible to users without credit cards.
| Report Attributes | Details |
| Market Size in 2023 | USD 36.79 Billion |
| Market Size by 2032 | USD 96.11 Billion |
| CAGR | CAGR of 11.32% From 2024 to 2032 |
| Base Year | 2023 |
| Forecast Period | 2024-2032 |
| Historical Data | 2020-2022 |
| Report Scope & Coverage | Market Size, Segments Analysis, Competitive Landscape, Regional Analysis, DROC & SWOT Analysis, Forecast Outlook |
| Key Segments | • By Type (Limited DCB, Pure DCB, MSISDN Forwarding, Others) • By Platform (Android, iOS, Others) • By End User (Games and Apps, Video Content and Movies, Music, Others) • By Authentication (Single Factor Authentication, Two Factor Authentication) |
| Regional Analysis/Coverage | North America (US, Canada, Mexico), Europe (Eastern Europe [Poland, Romania, Hungary, Turkey, Rest of Eastern Europe] Western Europe] Germany, France, UK, Italy, Spain, Netherlands, Switzerland, Austria, Rest of Western Europe]), Asia Pacific (China, India, Japan, South Korea, Vietnam, Singapore, Australia, Rest of Asia Pacific), Middle East & Africa (Middle East [UAE, Egypt, Saudi Arabia, Qatar, Rest of Middle East], Africa [Nigeria, South Africa, Rest of Africa], Latin America (Brazil, Argentina, Colombia, Rest of Latin America) |
| Company Profiles | Google LLC, Microsoft, Fortumo, Bango.net Limited, NETWORLD MEDIA GROUP, DOCOMO Digital, Boku Inc., txtNation Limited, Adpay.net.in, Mobiyo, TELENITY, ZONG, HIGHCO, NTH Mobile, DIMOCO, Centili, Singtel, Swisscom, Infobip, Paymentwall, Telenor, Orange, Analysys Mason, Lateral Profiles Limited, Upstream, Tigo Tanzania |
