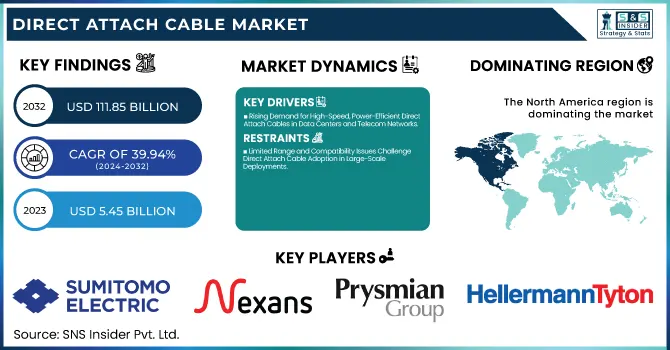
The Direct Attach Cable Market size was valued at USD 5.45 billion in 2023 and is expected to reach USD 111.85 billion by 2032, growing at a CAGR of 39.94% over the forecast period 2024-2032. The Direct Attach Cable Market is driven by the increased adoption from end-user segments including data centers, telecom, and HPC environments where high-speed, low-latency connectivity is essential for operations. Adopting 400G-800G DAC, Progressing in the QSFP, CFP, and 800G DAC Segment Customer-wise segmentation is majorly led by large enterprises and cloud service providers who require extensive networking expansion.
To Get more information on Direct Attach Cable Market - Request Free Sample Report
Networking and telecommunications provide the most revenue again, driven by growing 5G and cloud infrastructure investments. Hyperscale data centers and AI-driven computing environments are where DAC adoption is poised to drive the next chapter in the evolution of the industry as energy efficiency and cost-effectiveness become key considerations in any new technology.
Key Drivers:
Rising Demand for High-Speed, Power-Efficient Direct Attach Cables in Data Centers and Telecom Networks
Increasing demand for high-speed data transmission in various applications such as networking, cloud computing, and telecommunication is expected to drive the growth of the Direct Attach Cable (DAC) market. Hyperscale data center growth: Hyperscale data centers are growing exponentially alongside the growth of 5G networks, both of which help drive demand for fiber. DAC adoption continues accelerating as enterprises modernize their network infrastructure to power AI, IoT, and big data applications. Moreover, when compared to optical transceivers, DACs are more economical and power efficient, making DACs attractive solutions for short-distance interconnects in data center applications. Free-Space Optics (FSO) comes under the category of high-capacity, long-distance secure transmission technology. High-performance computing (HPC) and cloud-based services have also increased demand for high-bandwidth, low-latency interconnects, which propelled demand growth.
Restrain:
Limited Range and Compatibility Issues Challenge Direct Attach Cable Adoption in Large-Scale Deployments
An important challenge facing the DAC market is that transmission distance is very limited compared to optical fiber solutions. DACs have a limited range of only meters, but if the distance is small enough, DACs can be used efficiently for short-range interconnects. This is a limitation for large-scale data centers and telecom deployments that require high-speed connectivity over long distances. The fact that different DAC types and networking equipment from different vendors may not be compatible presents integration headaches for enterprises as they either have to purchase vendor-specific solutions or spend a fortune on adaptors.
Opportunity:
Next-Generation Direct Attach Cables Drive Growth with AI Networking Edge Computing and High-Speed Connectivity
The category includes technological progress, such as the creation of new-generation DACs (400G & 800G) to deal with growing bandwidth requirements. Widespread acceptance of CFP and QSFP-based DACs in next-generation telecom and networking applications offers tremendous growth opportunities. Additionally, the overlapping of DACs with new applications such as AI-based networking and the trends toward edge computing and consumer electronics open up new sectors for market penetration. The rapid pace of economic and social transition and the continued efforts to achieve high-performance and energy-efficient connectivity solutions will further boost market growth.
Challenges:
Direct Attach Cables Face Challenges from Optical Fiber Adoption Thermal Management and Regulatory Compliance
The other big problem is that everything is moving to optical fiber solutions and ever-faster raw data transmission. As 400G and 800G, high-speed networking emerges, fiber-based interconnects become more favorable due to their capable distance and data rates. In addition to this, faster DACs need to manage thermal dissipation and signal integrity within high-density environments, otherwise they experience compromised performance. In addition, the DAC market is also limited by end-use standards and regulatory compliance, as DAC manufacturers must deploy DACs based on stringent technical and environmental regulations.
By Type
In 2023, the Active Optical Cable managed to dominate the market with a share of 53.2% due to the better performance of this superior mode of data transmission, at high speed and over higher distances. AOCs find wider usage in data centers, high-performance computing (HPC), and telecommunications owing to their reduced electromagnetic interference (EMI) levels and support for high-bandwidth applications. Cloud computing, artificial intelligence (AI), and 5G networks are growing increasingly, and thus the ambitious implementation of IT infrastructures supporting cloud computing and AI continues to expand, creating a demand for today`s agile data centers that utilize AOCs for effective high-speed connectivity. Their lightweight, flexible design also makes them perfect for high-density cabling conditions, which further optimizes network scalability and performance.
Direct Attach Copper (DAC) cables are projected to register the highest CAGR over the forecast period (2024 - 2032) due to high cost-effectiveness, lesser demand for electrical power, and high reliability for short-distance interconnects. DACs are also in demand among operators looking for energy-efficient solutions because DACs passively do not require any energy to run additional power functions, making them more attractive. Meanwhile, the increasing adoption of high-speed networking like 400G and 800G Ethernet is providing a good market for next-gen DACs as well, which have become the ideal interface for short-range applications in both enterprise and cloud domains.
By Form Factor
QSFP led the DAC market in 2023 with a market share of around 38.6%, due to the large adoption of QSFP DACs in data centers, cloud, and high-speed networking applications. Ideal for high-density environments, QSFP-based DACs are the first choices due to their ability to drive data at high transfer rates, their tiny size, and low power consumption. Another factor that has helped Notebook QSFP to gain traction is that hyperscale data centers are increasingly demanding 100G, 200G, and 400G Ethernet solutions and QSFP supports multiple lanes for high bandwidth applications. The fact that it is capable of supporting optical and copper interconnects further enhances its versatility when dealing with the network infrastructures of the day.
CFP is expected to be the fastest-growing segment in terms of CAGR during the forecast period, owing to the rising demand for super ultra-high-speed data transmission in telecommunications and cloud networking. CFP-based DACs are emerging as a solution to enable high-speed optical interconnects when providers upgrade to 400G and beyond capabilities on their networks. The scalability and performance benefits of CFP will make it a mainstay in next-generation data centers and telecom networks, especially as 5G networks and edge computing proliferate.
By End Use
The telecommunication sector held the largest share of 38.8% in the direct attach cable (DAC) market in 2023 with the rapid deployment of 5G networks, fiber-optic, and high-speed broadband infrastructure. Growing demand for high bandwidth connectivity for video streaming, IoT, and cloud-oriented applications has boosted the deployment of DAC for telecom networks. With telecom providers enhancing their infrastructure to enable higher data rates and lower latency, DACs are employed in data centers, central offices, and base stations for short-distance and high-speed interconnects. In addition, the increasing importance of software-defined networking (SDN) and network function virtualization (NFV) is creating the demand for high-bandwidth connectivity solutions with the highest scalability and lowest power consumption, intensifying the adoption of DAC in telecommunication applications.
The high-performance computing centers (HPC) are anticipated to register the fastest CAGR over the forecast period from 2024-2032, due to the rising demand for artificial intelligence (AI), big data analytics, and scientific research applications. DACs have become vital for providing high-speed interconnects between computing nodes, as HPC workloads demand ultra-fast, low-latency data transmission. The growth of exascale computing and next-generation supercomputers is accelerating investment in high-speed networking solutions such as 400G and 800G DACs. HPCs will remain an important DAC growth area with the rise of AI-driven simulations and mesh & machine learning-based workloads.
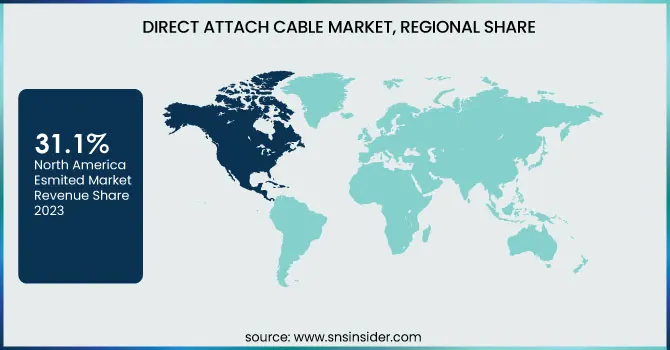
North America accounted for the largest share of 31.1% in the Direct Attach Cable (DAC) market in 2023, attributable to the presence of large-scale data centers, cloud service providers, and sophisticated telecom infrastructure in the region. High penetration of AI, big data, and IoT in the region has resulted in rising demand for high-speed and low-latency connectivity solutions. DAC has also continued to be driven by the constant expansion of the data centers of companies such as AWS, Microsoft Azure, and Google Cloud for high-speed interconnects. Moreover, telecommunication behemoths such as AT&T and Verizon have expedited their networks, boosting demand for DACs in networking applications. This is another factor fueling the interest in next-generation DAC technologies in North America, where investments in energy-efficient and high-performance computing solutions are increasing as well.
Asia-Pacific region is likely to witness maximum CAGR over upcoming years from 2024 to 2032 on account of the rapid growth of data centers, increasing internet penetration, and government initiatives in digital transformation. Extreme DAC demand is being fuelled by large cloud infrastructure investments in the DAC space by countries such as China, Japan, and India from giants like Alibaba Cloud, Tencent, and Reliance Jio. Moreover, the types of 5G network rollouts being made by China Mobile, NTT (Japan), and Bharti Airtel (India) will further accelerate the demand for high-speed connectivity solutions. DAC adoption in Asia-Pacific will be further accelerated with the growth of AI, smart cities, and edge computing in the region.
Get Customized Report as per Your Business Requirement - Enquiry Now
Some of the major players in the Direct Attach Cable Market are:
Sumitomo Electric Industries (Optical Fiber Cables, Automotive Wiring Harnesses)
Nexans (Power Cables, Data Transmission Cables)
Prysmian Group (High Voltage Cables, Submarine Cables)
HellermannTyton (Cable Ties, Cable Protection Systems)
Amphenol Corporation (High-Speed DACs, Fiber Optic Assemblies)
Molex (QSFP+ DACs, SFP+ DACs)
TE Connectivity (SFP28 DACs, QSFP28 DACs)
Cisco Systems (40G DACs, 100G DACs)
Arista Networks (10G SFP+ DACs, 40G QSFP+ DACs)
Finisar Corporation (Active Optical Cables, Passive DACs)
Intel Corporation (Omni-Path DACs, Ethernet DACs)
Brocade Communications Systems (16G Fibre Channel DACs, 32G Fibre Channel DACs)
Juniper Networks (QFX DACs, EX Series DACs)
Dell Technologies (PowerEdge DACs, Networking Cables)
Hewlett Packard Enterprise (HPE) (FlexNetwork DACs, ProLiant DACs)
In June 2024, Sumitomo Electric acquired a 90% stake in Germany’s Südkabel to enhance HVDC cable production and support Germany’s energy transition.
In January 2025, Nexans secured an EURO 1 billion project with TenneT to deliver the LanWin2 offshore grid connection, transmitting 2 GW of wind energy. This strengthens their partnership under TenneT’s 2 GW offshore program, with commissioning set for 2030.
| Report Attributes | Details |
|---|---|
| Market Size in 2023 | USD 5.45 Billion |
| Market Size by 2032 | USD 111.85 Billion |
| CAGR | CAGR of 39.94% From 2024 to 2032 |
| Base Year | 2023 |
| Forecast Period | 2024-2032 |
| Historical Data | 2020-2022 |
| Report Scope & Coverage | Market Size, Segments Analysis, Competitive Landscape, Regional Analysis, DROC & SWOT Analysis, Forecast Outlook |
| Key Segments | • By Type (Direct Attach Copper Cable, Active Optical Cable) • By Form Factor (SFP, QSFP, CXP, Cx4, CFP, CDFP) • By End Use (Networking, Telecommunications, Data Storage, High Performance Computing Centers (HPCs), Others (Consumer Electronics)) |
| Regional Analysis/Coverage | North America (US, Canada, Mexico), Europe (Eastern Europe [Poland, Romania, Hungary, Turkey, Rest of Eastern Europe] Western Europe] Germany, France, UK, Italy, Spain, Netherlands, Switzerland, Austria, Rest of Western Europe]), Asia Pacific (China, India, Japan, South Korea, Vietnam, Singapore, Australia, Rest of Asia Pacific), Middle East & Africa (Middle East [UAE, Egypt, Saudi Arabia, Qatar, Rest of Middle East], Africa [Nigeria, South Africa, Rest of Africa], Latin America (Brazil, Argentina, Colombia, Rest of Latin America) |
| Company Profiles | Sumitomo Electric Industries, Nexans, Prysmian Group, HellermannTyton, Amphenol Corporation, Molex, TE Connectivity, Cisco Systems, Arista Networks, Finisar Corporation, Intel Corporation, Brocade Communications Systems, Juniper Networks, Dell Technologies, Hewlett Packard Enterprise (HPE). |
Ans: The Direct Attach Cable Market is expected to grow at a CAGR of 39.94% during 2024-2032.
Ans: Direct Attach Cable Market size was USD 5.45 billion in 2023 and is expected to Reach USD 111.85 billion by 2032.
Ans: The major growth factor of the Direct Attach Cable market is the increasing demand for high-speed, low-power, and cost-effective interconnect solutions in data centers, cloud computing, and 5G networks.
Ans: The Telecommunications segment dominated the Direct Attach Cable Market in 2023.
Ans: North America dominated the Direct Attach Cable Market in 2023.
1. Introduction
1.1 Market Definition
1.2 Scope (Inclusion and Exclusions)
1.3 Research Assumptions
2. Executive Summary
2.1 Market Overview
2.2 Regional Synopsis
2.3 Competitive Summary
3. Research Methodology
3.1 Top-Down Approach
3.2 Bottom-up Approach
3.3. Data Validation
3.4 Primary Interviews
4. Market Dynamics Impact Analysis
4.1 Market Driving Factors Analysis
4.1.1 Drivers
4.1.2 Restraints
4.1.3 Opportunities
4.1.4 Challenges
4.2 PESTLE Analysis
4.3 Porter’s Five Forces Model
5. Statistical Insights and Trends Reporting
5.1 Adoption and Deployment Metrics
5.2 Product and Technology Metrics
5.3 Customer Segmentation
6. Competitive Landscape
6.1 List of Major Companies, By Region
6.2 Market Share Analysis, By Region
6.3 Product Benchmarking
6.3.1 Product specifications and features
6.3.2 Pricing
6.4 Strategic Initiatives
6.4.1 Marketing and promotional activities
6.4.2 Distribution and Supply Chain Strategies
6.4.3 Expansion plans and new product launches
6.4.4 Strategic partnerships and collaborations
6.5 Technological Advancements
6.6 Market Positioning and Branding
7. Direct Attach Cable Market Segmentation, By Type
7.1 Chapter Overview
7.2 Direct Attach Copper Cable
7.2.1 Direct Attach Copper Cable Market Trends Analysis (2020-2032)
7.2.2 Direct Attach Copper Cable Market Size Estimates and Forecasts to 2032 (USD Billion)
7.3 Active Optical Cable
7.3.1 Active Optical Cable Market Trends Analysis (2020-2032)
7.3.2 Active Optical Cable Market Size Estimates and Forecasts to 2032 (USD Billion)
8. Direct Attach Cable Market Segmentation, By Form Factor
8.1 Chapter Overview
8.2 SFP
8.2.1 SFP Market Trends Analysis (2020-2032)
8.2.2 SFP Market Size Estimates and Forecasts to 2032 (USD Billion)
8.3 QSFP
8.3.1 QSFP Market Trends Analysis (2020-2032)
8.3.2 QSFP Market Size Estimates and Forecasts to 2032 (USD Billion)
8.4 CXP
8.4.1 CXP Market Trends Analysis (2020-2032)
8.4.2 CXP Market Size Estimates and Forecasts to 2032 (USD Billion)
8.5 Cx4
8.5.1 Cx4 Market Trends Analysis (2020-2032)
8.5.2 Cx4 Market Size Estimates and Forecasts to 2032 (USD Billion)
8.6 CFP
8.6.1 CFP Market Trends Analysis (2020-2032)
8.6.2 CFP Market Size Estimates and Forecasts to 2032 (USD Billion)
8.7 CDFP
8.7.1 CDFP Market Trends Analysis (2020-2032)
8.7.2 CDFP Market Size Estimates and Forecasts to 2032 (USD Billion)
9. Direct Attach Cable Market Segmentation, By End Use
9.1 Chapter Overview
9.2 Networking
9.2.1 Networking Market Trends Analysis (2020-2032)
9.2.2 Networking Market Size Estimates and Forecasts to 2032 (USD Billion)
9.3 Telecommunications
9.3.1 Telecommunications Market Trends Analysis (2020-2032)
9.3.2 Telecommunications Market Size Estimates and Forecasts to 2032 (USD Billion)
9.4 Data Storage
9.4.1 Data Storage Market Trends Analysis (2020-2032)
9.4.2 Data Storage Market Size Estimates and Forecasts to 2032 (USD Billion)
9.5 High Performance Computing Centers (HPCs)
9.5.1 High Performance Computing Centers (HPCs) Market Trends Analysis (2020-2032)
9.5.2 High Performance Computing Centers (HPCs) Market Size Estimates and Forecasts to 2032 (USD Billion)
9.6 Others (Consumer Electronics)
9.6.1 Others (Consumer Electronics) Market Trends Analysis (2020-2032)
9.6.2 Others (Consumer Electronics) Market Size Estimates and Forecasts to 2032 (USD Billion)
10. Regional Analysis
10.1 Chapter Overview
10.2 North America
10.2.1 Trends Analysis
10.2.2 North America Direct Attach Cable Market Estimates and Forecasts, by Country (2020-2032) (USD Billion)
10.2.3 North America Direct Attach Cable Market Estimates and Forecasts, By Type (2020-2032) (USD Billion)
10.2.4 North America Direct Attach Cable Market Estimates and Forecasts, By Form Factor (2020-2032) (USD Billion)
10.2.5 North America Direct Attach Cable Market Estimates and Forecasts, By End Use (2020-2032) (USD Billion)
10.2.6 USA
10.2.6.1 USA Direct Attach Cable Market Estimates and Forecasts, By Type (2020-2032) (USD Billion)
10.2.6.2 USA Direct Attach Cable Market Estimates and Forecasts, By Form Factor (2020-2032) (USD Billion)
10.2.6.3 USA Direct Attach Cable Market Estimates and Forecasts, By End Use (2020-2032) (USD Billion)
10.2.7 Canada
10.2.7.1 Canada Direct Attach Cable Market Estimates and Forecasts, By Type (2020-2032) (USD Billion)
10.2.7.2 Canada Direct Attach Cable Market Estimates and Forecasts, By Form Factor (2020-2032) (USD Billion)
10.2.7.3 Canada Direct Attach Cable Market Estimates and Forecasts, By End Use (2020-2032) (USD Billion)
10.2.8 Mexico
10.2.8.1 Mexico Direct Attach Cable Market Estimates and Forecasts, By Type (2020-2032) (USD Billion)
10.2.8.2 Mexico Direct Attach Cable Market Estimates and Forecasts, By Form Factor (2020-2032) (USD Billion)
10.2.8.3 Mexico Direct Attach Cable Market Estimates and Forecasts, By End Use (2020-2032) (USD Billion)
10.3 Europe
10.3.1 Eastern Europe
10.3.1.1 Trends Analysis
10.3.1.2 Eastern Europe Direct Attach Cable Market Estimates and Forecasts, by Country (2020-2032) (USD Billion)
10.3.1.3 Eastern Europe Direct Attach Cable Market Estimates and Forecasts, By Type (2020-2032) (USD Billion)
10.3.1.4 Eastern Europe Direct Attach Cable Market Estimates and Forecasts, By Form Factor (2020-2032) (USD Billion)
10.3.1.5 Eastern Europe Direct Attach Cable Market Estimates and Forecasts, By End Use (2020-2032) (USD Billion)
10.3.1.6 Poland
10.3.1.6.1 Poland Direct Attach Cable Market Estimates and Forecasts, By Type (2020-2032) (USD Billion)
10.3.1.6.2 Poland Direct Attach Cable Market Estimates and Forecasts, By Form Factor (2020-2032) (USD Billion)
10.3.1.6.3 Poland Direct Attach Cable Market Estimates and Forecasts, By End Use (2020-2032) (USD Billion)
10.3.1.7 Romania
10.3.1.7.1 Romania Direct Attach Cable Market Estimates and Forecasts, By Type (2020-2032) (USD Billion)
10.3.1.7.2 Romania Direct Attach Cable Market Estimates and Forecasts, By Form Factor (2020-2032) (USD Billion)
10.3.1.7.3 Romania Direct Attach Cable Market Estimates and Forecasts, By End Use (2020-2032) (USD Billion)
10.3.1.8 Hungary
10.3.1.8.1 Hungary Direct Attach Cable Market Estimates and Forecasts, By Type (2020-2032) (USD Billion)
10.3.1.8.2 Hungary Direct Attach Cable Market Estimates and Forecasts, By Form Factor (2020-2032) (USD Billion)
10.3.1.8.3 Hungary Direct Attach Cable Market Estimates and Forecasts, By End Use (2020-2032) (USD Billion)
10.3.1.9 Turkey
10.3.1.9.1 Turkey Direct Attach Cable Market Estimates and Forecasts, By Type (2020-2032) (USD Billion)
10.3.1.9.2 Turkey Direct Attach Cable Market Estimates and Forecasts, By Form Factor (2020-2032) (USD Billion)
10.3.1.9.3 Turkey Direct Attach Cable Market Estimates and Forecasts, By End Use (2020-2032) (USD Billion)
10.3.1.10 Rest of Eastern Europe
10.3.1.10.1 Rest of Eastern Europe Direct Attach Cable Market Estimates and Forecasts, By Type (2020-2032) (USD Billion)
10.3.1.10.2 Rest of Eastern Europe Direct Attach Cable Market Estimates and Forecasts, By Form Factor (2020-2032) (USD Billion)
10.3.1.10.3 Rest of Eastern Europe Direct Attach Cable Market Estimates and Forecasts, By End Use (2020-2032) (USD Billion)
10.3.2 Western Europe
10.3.2.1 Trends Analysis
10.3.2.2 Western Europe Direct Attach Cable Market Estimates and Forecasts, by Country (2020-2032) (USD Billion)
10.3.2.3 Western Europe Direct Attach Cable Market Estimates and Forecasts, By Type (2020-2032) (USD Billion)
10.3.2.4 Western Europe Direct Attach Cable Market Estimates and Forecasts, By Form Factor (2020-2032) (USD Billion)
10.3.2.5 Western Europe Direct Attach Cable Market Estimates and Forecasts, By End Use (2020-2032) (USD Billion)
10.3.2.6 Germany
10.3.2.6.1 Germany Direct Attach Cable Market Estimates and Forecasts, By Type (2020-2032) (USD Billion)
10.3.2.6.2 Germany Direct Attach Cable Market Estimates and Forecasts, By Form Factor (2020-2032) (USD Billion)
10.3.2.6.3 Germany Direct Attach Cable Market Estimates and Forecasts, By End Use (2020-2032) (USD Billion)
10.3.2.7 France
10.3.2.7.1 France Direct Attach Cable Market Estimates and Forecasts, By Type (2020-2032) (USD Billion)
10.3.2.7.2 France Direct Attach Cable Market Estimates and Forecasts, By Form Factor (2020-2032) (USD Billion)
10.3.2.7.3 France Direct Attach Cable Market Estimates and Forecasts, By End Use (2020-2032) (USD Billion)
10.3.2.8 UK
10.3.2.8.1 UK Direct Attach Cable Market Estimates and Forecasts, By Type (2020-2032) (USD Billion)
10.3.2.8.2 UK Direct Attach Cable Market Estimates and Forecasts, By Form Factor (2020-2032) (USD Billion)
10.3.2.8.3 UK Direct Attach Cable Market Estimates and Forecasts, By End Use (2020-2032) (USD Billion)
10.3.2.9 Italy
10.3.2.9.1 Italy Direct Attach Cable Market Estimates and Forecasts, By Type (2020-2032) (USD Billion)
10.3.2.9.2 Italy Direct Attach Cable Market Estimates and Forecasts, By Form Factor (2020-2032) (USD Billion)
10.3.2.9.3 Italy Direct Attach Cable Market Estimates and Forecasts, By End Use (2020-2032) (USD Billion)
10.3.2.10 Spain
10.3.2.10.1 Spain Direct Attach Cable Market Estimates and Forecasts, By Type (2020-2032) (USD Billion)
10.3.2.10.2 Spain Direct Attach Cable Market Estimates and Forecasts, By Form Factor (2020-2032) (USD Billion)
10.3.2.10.3 Spain Direct Attach Cable Market Estimates and Forecasts, By End Use (2020-2032) (USD Billion)
10.3.2.11 Netherlands
10.3.2.11.1 Netherlands Direct Attach Cable Market Estimates and Forecasts, By Type (2020-2032) (USD Billion)
10.3.2.11.2 Netherlands Direct Attach Cable Market Estimates and Forecasts, By Form Factor (2020-2032) (USD Billion)
10.3.2.11.3 Netherlands Direct Attach Cable Market Estimates and Forecasts, By End Use (2020-2032) (USD Billion)
10.3.2.12 Switzerland
10.3.2.12.1 Switzerland Direct Attach Cable Market Estimates and Forecasts, By Type (2020-2032) (USD Billion)
10.3.2.12.2 Switzerland Direct Attach Cable Market Estimates and Forecasts, By Form Factor (2020-2032) (USD Billion)
10.3.2.12.3 Switzerland Direct Attach Cable Market Estimates and Forecasts, By End Use (2020-2032) (USD Billion)
10.3.2.13 Austria
10.3.2.13.1 Austria Direct Attach Cable Market Estimates and Forecasts, By Type (2020-2032) (USD Billion)
10.3.2.13.2 Austria Direct Attach Cable Market Estimates and Forecasts, By Form Factor (2020-2032) (USD Billion)
10.3.2.13.3 Austria Direct Attach Cable Market Estimates and Forecasts, By End Use (2020-2032) (USD Billion)
10.3.2.14 Rest of Western Europe
10.3.2.14.1 Rest of Western Europe Direct Attach Cable Market Estimates and Forecasts, By Type (2020-2032) (USD Billion)
10.3.2.14.2 Rest of Western Europe Direct Attach Cable Market Estimates and Forecasts, By Form Factor (2020-2032) (USD Billion)
10.3.2.14.3 Rest of Western Europe Direct Attach Cable Market Estimates and Forecasts, By End Use (2020-2032) (USD Billion)
10.4 Asia Pacific
10.4.1 Trends Analysis
10.4.2 Asia Pacific Direct Attach Cable Market Estimates and Forecasts, by Country (2020-2032) (USD Billion)
10.4.3 Asia Pacific Direct Attach Cable Market Estimates and Forecasts, By Type (2020-2032) (USD Billion)
10.4.4 Asia Pacific Direct Attach Cable Market Estimates and Forecasts, By Form Factor (2020-2032) (USD Billion)
10.4.5 Asia Pacific Direct Attach Cable Market Estimates and Forecasts, By End Use (2020-2032) (USD Billion)
10.4.6 China
10.4.6.1 China Direct Attach Cable Market Estimates and Forecasts, By Type (2020-2032) (USD Billion)
10.4.6.2 China Direct Attach Cable Market Estimates and Forecasts, By Form Factor (2020-2032) (USD Billion)
10.4.6.3 China Direct Attach Cable Market Estimates and Forecasts, By End Use (2020-2032) (USD Billion)
10.4.7 India
10.4.7.1 India Direct Attach Cable Market Estimates and Forecasts, By Type (2020-2032) (USD Billion)
10.4.7.2 India Direct Attach Cable Market Estimates and Forecasts, By Form Factor (2020-2032) (USD Billion)
10.4.7.3 India Direct Attach Cable Market Estimates and Forecasts, By End Use (2020-2032) (USD Billion)
10.4.8 Japan
10.4.8.1 Japan Direct Attach Cable Market Estimates and Forecasts, By Type (2020-2032) (USD Billion)
10.4.8.2 Japan Direct Attach Cable Market Estimates and Forecasts, By Form Factor (2020-2032) (USD Billion)
10.4.8.3 Japan Direct Attach Cable Market Estimates and Forecasts, By End Use (2020-2032) (USD Billion)
10.4.9 South Korea
10.4.9.1 South Korea Direct Attach Cable Market Estimates and Forecasts, By Type (2020-2032) (USD Billion)
10.4.9.2 South Korea Direct Attach Cable Market Estimates and Forecasts, By Form Factor (2020-2032) (USD Billion)
10.4.9.3 South Korea Direct Attach Cable Market Estimates and Forecasts, By End Use (2020-2032) (USD Billion)
10.4.10 Vietnam
10.4.10.1 Vietnam Direct Attach Cable Market Estimates and Forecasts, By Type (2020-2032) (USD Billion)
10.4.10.2 Vietnam Direct Attach Cable Market Estimates and Forecasts, By Form Factor (2020-2032) (USD Billion)
10.4.10.3 Vietnam Direct Attach Cable Market Estimates and Forecasts, By End Use (2020-2032) (USD Billion)
10.4.11 Singapore
10.4.11.1 Singapore Direct Attach Cable Market Estimates and Forecasts, By Type (2020-2032) (USD Billion)
10.4.11.2 Singapore Direct Attach Cable Market Estimates and Forecasts, By Form Factor (2020-2032) (USD Billion)
10.4.11.3 Singapore Direct Attach Cable Market Estimates and Forecasts, By End Use (2020-2032) (USD Billion)
10.4.12 Australia
10.4.12.1 Australia Direct Attach Cable Market Estimates and Forecasts, By Type (2020-2032) (USD Billion)
10.4.12.2 Australia Direct Attach Cable Market Estimates and Forecasts, By Form Factor (2020-2032) (USD Billion)
10.4.12.3 Australia Direct Attach Cable Market Estimates and Forecasts, By End Use (2020-2032) (USD Billion)
10.4.13 Rest of Asia Pacific
10.4.13.1 Rest of Asia Pacific Direct Attach Cable Market Estimates and Forecasts, By Type (2020-2032) (USD Billion)
10.4.13.2 Rest of Asia Pacific Direct Attach Cable Market Estimates and Forecasts, By Form Factor (2020-2032) (USD Billion)
10.4.13.3 Rest of Asia Pacific Direct Attach Cable Market Estimates and Forecasts, By End Use (2020-2032) (USD Billion)
10.5 Middle East and Africa
10.5.1 Middle East
10.5.1.1 Trends Analysis
10.5.1.2 Middle East Direct Attach Cable Market Estimates and Forecasts, by Country (2020-2032) (USD Billion)
10.5.1.3 Middle East Direct Attach Cable Market Estimates and Forecasts, By Type (2020-2032) (USD Billion)
10.5.1.4 Middle East Direct Attach Cable Market Estimates and Forecasts, By Form Factor (2020-2032) (USD Billion)
10.5.1.5 Middle East Direct Attach Cable Market Estimates and Forecasts, By End Use (2020-2032) (USD Billion)
10.5.1.6 UAE
10.5.1.6.1 UAE Direct Attach Cable Market Estimates and Forecasts, By Type (2020-2032) (USD Billion)
10.5.1.6.2 UAE Direct Attach Cable Market Estimates and Forecasts, By Form Factor (2020-2032) (USD Billion)
10.5.1.6.3 UAE Direct Attach Cable Market Estimates and Forecasts, By End Use (2020-2032) (USD Billion)
10.5.1.7 Egypt
10.5.1.7.1 Egypt Direct Attach Cable Market Estimates and Forecasts, By Type (2020-2032) (USD Billion)
10.5.1.7.2 Egypt Direct Attach Cable Market Estimates and Forecasts, By Form Factor (2020-2032) (USD Billion)
10.5.1.7.3 Egypt Direct Attach Cable Market Estimates and Forecasts, By End Use (2020-2032) (USD Billion)
10.5.1.8 Saudi Arabia
10.5.1.8.1 Saudi Arabia Direct Attach Cable Market Estimates and Forecasts, By Type (2020-2032) (USD Billion)
10.5.1.8.2 Saudi Arabia Direct Attach Cable Market Estimates and Forecasts, By Form Factor (2020-2032) (USD Billion)
10.5.1.8.3 Saudi Arabia Direct Attach Cable Market Estimates and Forecasts, By End Use (2020-2032) (USD Billion)
10.5.1.9 Qatar
10.5.1.9.1 Qatar Direct Attach Cable Market Estimates and Forecasts, By Type (2020-2032) (USD Billion)
10.5.1.9.2 Qatar Direct Attach Cable Market Estimates and Forecasts, By Form Factor (2020-2032) (USD Billion)
10.5.1.9.3 Qatar Direct Attach Cable Market Estimates and Forecasts, By End Use (2020-2032) (USD Billion)
10.5.1.10 Rest of Middle East
10.5.1.10.1 Rest of Middle East Direct Attach Cable Market Estimates and Forecasts, By Type (2020-2032) (USD Billion)
10.5.1.10.2 Rest of Middle East Direct Attach Cable Market Estimates and Forecasts, By Form Factor (2020-2032) (USD Billion)
10.5.1.10.3 Rest of Middle East Direct Attach Cable Market Estimates and Forecasts, By End Use (2020-2032) (USD Billion)
10.5.2 Africa
10.5.2.1 Trends Analysis
10.5.2.2 Africa Direct Attach Cable Market Estimates and Forecasts, by Country (2020-2032) (USD Billion)
10.5.2.3 Africa Direct Attach Cable Market Estimates and Forecasts, By Type (2020-2032) (USD Billion)
10.5.2.4 Africa Direct Attach Cable Market Estimates and Forecasts, By Form Factor (2020-2032) (USD Billion)
10.5.2.5 Africa Direct Attach Cable Market Estimates and Forecasts, By End Use (2020-2032) (USD Billion)
10.5.2.6 South Africa
10.5.2.6.1 South Africa Direct Attach Cable Market Estimates and Forecasts, By Type (2020-2032) (USD Billion)
10.5.2.6.2 South Africa Direct Attach Cable Market Estimates and Forecasts, By Form Factor (2020-2032) (USD Billion)
10.5.2.6.3 South Africa Direct Attach Cable Market Estimates and Forecasts, By End Use (2020-2032) (USD Billion)
10.5.2.7 Nigeria
10.5.2.7.1 Nigeria Direct Attach Cable Market Estimates and Forecasts, By Type (2020-2032) (USD Billion)
10.5.2.7.2 Nigeria Direct Attach Cable Market Estimates and Forecasts, By Form Factor (2020-2032) (USD Billion)
10.5.2.7.3 Nigeria Direct Attach Cable Market Estimates and Forecasts, By End Use (2020-2032) (USD Billion)
10.5.2.8 Rest of Africa
10.5.2.8.1 Rest of Africa Direct Attach Cable Market Estimates and Forecasts, By Type (2020-2032) (USD Billion)
10.5.2.8.2 Rest of Africa Direct Attach Cable Market Estimates and Forecasts, By Form Factor (2020-2032) (USD Billion)
10.5.2.8.3 Rest of Africa Direct Attach Cable Market Estimates and Forecasts, By End Use (2020-2032) (USD Billion)
10.6 Latin America
10.6.1 Trends Analysis
10.6.2 Latin America Direct Attach Cable Market Estimates and Forecasts, by Country (2020-2032) (USD Billion)
10.6.3 Latin America Direct Attach Cable Market Estimates and Forecasts, By Type (2020-2032) (USD Billion)
10.6.4 Latin America Direct Attach Cable Market Estimates and Forecasts, By Form Factor (2020-2032) (USD Billion)
10.6.5 Latin America Direct Attach Cable Market Estimates and Forecasts, By End Use (2020-2032) (USD Billion)
10.6.6 Brazil
10.6.6.1 Brazil Direct Attach Cable Market Estimates and Forecasts, By Type (2020-2032) (USD Billion)
10.6.6.2 Brazil Direct Attach Cable Market Estimates and Forecasts, By Form Factor (2020-2032) (USD Billion)
10.6.6.3 Brazil Direct Attach Cable Market Estimates and Forecasts, By End Use (2020-2032) (USD Billion)
10.6.7 Argentina
10.6.7.1 Argentina Direct Attach Cable Market Estimates and Forecasts, By Type (2020-2032) (USD Billion)
10.6.7.2 Argentina Direct Attach Cable Market Estimates and Forecasts, By Form Factor (2020-2032) (USD Billion)
10.6.7.3 Argentina Direct Attach Cable Market Estimates and Forecasts, By End Use (2020-2032) (USD Billion)
10.6.8 Colombia
10.6.8.1 Colombia Direct Attach Cable Market Estimates and Forecasts, By Type (2020-2032) (USD Billion)
10.6.8.2 Colombia Direct Attach Cable Market Estimates and Forecasts, By Form Factor (2020-2032) (USD Billion)
10.6.8.3 Colombia Direct Attach Cable Market Estimates and Forecasts, By End Use (2020-2032) (USD Billion)
10.6.9 Rest of Latin America
10.6.9.1 Rest of Latin America Direct Attach Cable Market Estimates and Forecasts, By Type (2020-2032) (USD Billion)
10.6.9.2 Rest of Latin America Direct Attach Cable Market Estimates and Forecasts, By Form Factor (2020-2032) (USD Billion)
10.6.9.3 Rest of Latin America Direct Attach Cable Market Estimates and Forecasts, By End Use (2020-2032) (USD Billion)
11. Company Profiles
11.1 Sumitomo Electric Industries.
11.1.1 Company Overview
11.1.2 Financial
11.1.3 Products/ Services Offered
11.1.4 SWOT Analysis
11.2 Nexans
11.2.1 Company Overview
11.2.2 Financial
11.2.3 Products/ Services Offered
11.2.4 SWOT Analysis
11.3 Prysmian Group
11.3.1 Company Overview
11.3.2 Financial
11.3.3 Products/ Services Offered
11.3.4 SWOT Analysis
11.4 HellermannTyton
11.4.1 Company Overview
11.4.2 Financial
11.4.3 Products/ Services Offered
11.4.4 SWOT Analysis
11.5 Amphenol Corporation
11.5.1 Company Overview
11.5.2 Financial
11.5.3 Products/ Services Offered
11.5.4 SWOT Analysis
11.6 Molex
11.6.1 Company Overview
11.6.2 Financial
11.6.3 Products/ Services Offered
11.6.4 SWOT Analysis
11.7 TE Connectivity
11.7.1 Company Overview
11.7.2 Financial
11.7.3 Products/ Services Offered
11.7.4 SWOT Analysis
11.8 Cisco Systems.
11.8.1 Company Overview
11.8.2 Financial
11.8.3 Products/ Services Offered
11.8.4 SWOT Analysis
11.9 Arista Networks
11.9.1 Company Overview
11.9.2 Financial
11.9.3 Products/ Services Offered
11.9.4 SWOT Analysis
11.10 Finisar Corporation
11.10.1 Company Overview
11.10.2 Financial
11.10.3 Products/ Services Offered
11.10.4 SWOT Analysis
12. Use Cases and Best Practices
13. Conclusion
An accurate research report requires proper strategizing as well as implementation. There are multiple factors involved in the completion of good and accurate research report and selecting the best methodology to compete the research is the toughest part. Since the research reports we provide play a crucial role in any company’s decision-making process, therefore we at SNS Insider always believe that we should choose the best method which gives us results closer to reality. This allows us to reach at a stage wherein we can provide our clients best and accurate investment to output ratio.
Each report that we prepare takes a timeframe of 350-400 business hours for production. Starting from the selection of titles through a couple of in-depth brain storming session to the final QC process before uploading our titles on our website we dedicate around 350 working hours. The titles are selected based on their current market cap and the foreseen CAGR and growth.
The 5 steps process:
Step 1: Secondary Research:
Secondary Research or Desk Research is as the name suggests is a research process wherein, we collect data through the readily available information. In this process we use various paid and unpaid databases which our team has access to and gather data through the same. This includes examining of listed companies’ annual reports, Journals, SEC filling etc. Apart from this our team has access to various associations across the globe across different industries. Lastly, we have exchange relationships with various university as well as individual libraries.

Step 2: Primary Research
When we talk about primary research, it is a type of study in which the researchers collect relevant data samples directly, rather than relying on previously collected data. This type of research is focused on gaining content specific facts that can be sued to solve specific problems. Since the collected data is fresh and first hand therefore it makes the study more accurate and genuine.
We at SNS Insider have divided Primary Research into 2 parts.
Part 1 wherein we interview the KOLs of major players as well as the upcoming ones across various geographic regions. This allows us to have their view over the market scenario and acts as an important tool to come closer to the accurate market numbers. As many as 45 paid and unpaid primary interviews are taken from both the demand and supply side of the industry to make sure we land at an accurate judgement and analysis of the market.
This step involves the triangulation of data wherein our team analyses the interview transcripts, online survey responses and observation of on filed participants. The below mentioned chart should give a better understanding of the part 1 of the primary interview.

Part 2: In this part of primary research the data collected via secondary research and the part 1 of the primary research is validated with the interviews from individual consultants and subject matter experts.
Consultants are those set of people who have at least 12 years of experience and expertise within the industry whereas Subject Matter Experts are those with at least 15 years of experience behind their back within the same space. The data with the help of two main processes i.e., FGDs (Focused Group Discussions) and IDs (Individual Discussions). This gives us a 3rd party nonbiased primary view of the market scenario making it a more dependable one while collation of the data pointers.
Step 3: Data Bank Validation
Once all the information is collected via primary and secondary sources, we run that information for data validation. At our intelligence centre our research heads track a lot of information related to the market which includes the quarterly reports, the daily stock prices, and other relevant information. Our data bank server gets updated every fortnight and that is how the information which we collected using our primary and secondary information is revalidated in real time.

Step 4: QA/QC Process
After all the data collection and validation our team does a final level of quality check and quality assurance to get rid of any unwanted or undesired mistakes. This might include but not limited to getting rid of the any typos, duplication of numbers or missing of any important information. The people involved in this process include technical content writers, research heads and graphics people. Once this process is completed the title gets uploader on our platform for our clients to read it.
Step 5: Final QC/QA Process:
This is the last process and comes when the client has ordered the study. In this process a final QA/QC is done before the study is emailed to the client. Since we believe in giving our clients a good experience of our research studies, therefore, to make sure that we do not lack at our end in any way humanly possible we do a final round of quality check and then dispatch the study to the client.
By Type
Direct Attach Copper Cable
Active Optical Cable
By Form Factor
SFP
QSFP
CXP
Cx4
CFP
CDFP
By End Use
Networking
Telecommunications
Data Storage
High Performance Computing Centers (HPCs)
Others (Consumer Electronics)
Request for Segment Customization as per your Business Requirement: Segment Customization Request
Regional Coverage:
North America
US
Canada
Mexico
Europe
Eastern Europe
Poland
Romania
Hungary
Turkey
Rest of Eastern Europe
Western Europe
Germany
France
UK
Italy
Spain
Netherlands
Switzerland
Austria
Rest of Western Europe
Asia Pacific
China
India
Japan
South Korea
Vietnam
Singapore
Australia
Rest of Asia Pacific
Middle East & Africa
Middle East
UAE
Egypt
Saudi Arabia
Qatar
Rest of Middle East
Africa
Nigeria
South Africa
Rest of Africa
Latin America
Brazil
Argentina
Colombia
Rest of Latin America
Request for Country Level Research Report: Country Level Customization Request
Available Customization
With the given market data, SNS Insider offers customization as per the company’s specific needs. The following customization options are available for the report:
Detailed Volume Analysis
Criss-Cross segment analysis (e.g. Product X Application)
Competitive Product Benchmarking
Geographic Analysis
Additional countries in any of the regions
Customized Data Representation
Detailed analysis and profiling of additional market players
The Linear Actuator Market Size was valued at USD 35.57 Billion in 2023 and is expected to grow at a CAGR of 7.3% to reach USD 66.96 Billion by 2032.
The Tilt Sensor Market Size was valued at USD 267.42 Million in 2023 and is expected to grow at a CAGR of 9.68% to reach USD 614.13 Million by 2032.
The Data Acquisition (DAQ) System Market size is expected to be valued at USD 8.84 Billion in 2023. It is estimated to reach USD 17.37 Billion by 2032, growing at a CAGR of 7.8% during 2024-2032.
The mmWave Sensors and Modules Market Size was valued at USD 0.25 Billion in 2023 and is expected to reach USD 2.40 Billion, at a CAGR of 28.59% by 2024-2032
The Contraband Detectors Market Size was valued at USD 4.55 Billion in 2023 and is expected to grow at a CAGR of 7.22% to reach USD 8.51 Billion by 2032.
The People Counting System Market Size was valued at USD 1.0 billion in 2023 and is expected to reach USD 3.101 billion by 2032 and grow at a CAGR of 13.4 % over the forecast period 2024-2032.

Hi! Click one of our member below to chat on Phone
© 2025 All Rights Reserved by SNS Insider Pvt Ltd


