image

Digital Twin Market Report Scope & Overview:
Digital Twin Market,Revenue Analysis

Get more information on Digital Twin Market - Request Sample Report

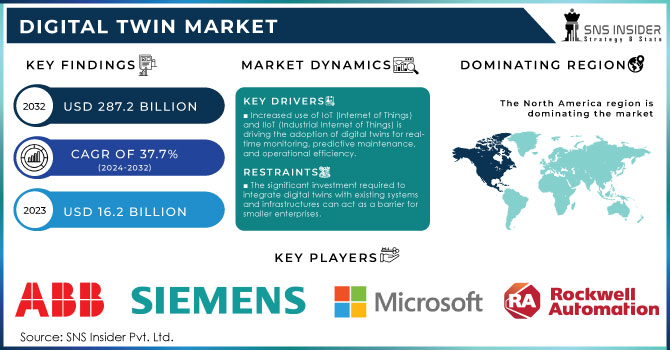
Digital Twin Market Size was valued at USD 16.2 Billion in 2023 and is expected to reach USD 287.2 Billion by 2032, growing at a CAGR of 37.7 % over the forecast period 2024-2032.

Digital twin technology is becoming increasingly popular as it fills the gap between the physical and virtual worlds. The adoption of the Internet of Things and big data analytics and the need for efficient operations, process optimization, and reduced time-to-market are driving growth. In addition, advancements in virtual and augmented reality are further expanding the market. An increasing number of countries, such as the U.S., India, Brazil, and Saudi Arabia, are investing in digital transformation to promote digitization. Increasing public and private sector recognition is also driving the trend. Cloud-based digital twin solutions are in high demand, as they offer cost-effective and flexible customer solutions. In addition, the development of digital twin systems is likely to drive market growth because of emerging technologies such as cloud computing, artificial intelligence, and the Internet of Things. Digital twin technology has become increasingly important in the age of Industry 4.0, where automation and data-driven decision-making.

Several collaborations have recently been announced to boost digital twin solution deployment. For instance, In February 2024, Matterport announced a collaboration with Arcadus to provide digital twin services for U.S. government agencies. It enabled organizations to remotely manage their operations and ensured compliance with federal regulations. Manufacturing, automotive, aerospace, and defense companies as end-user industries have promoted digital twin adoption. Enhanced communication, system productivity, and reduced energy consumption are further reaching trends that are expected to continue driving market growth with further technological development.

Market Dynamics

Drivers

  • Increased use of IoT (Internet of Things) and IIoT (Industrial Internet of Things) is driving the adoption of digital twins for real-time monitoring, predictive maintenance, and operational efficiency.

  • The need to reduce operational downtime and maintenance costs has spurred the use of digital twins to predict equipment failures and improve asset utilization.

  • Integration of AI and ML with digital twin technology enables better data analysis, predictions, and decision-making, boosting market growth.

  • The healthcare sector is leveraging digital twins for personalized medicine, patient monitoring, and virtual simulations of treatments, driving market expansion.

  • Rapidly growing adoption of 3D Simulation and 3D Printing Software Drive Market Growth

  • The rise of smart cities and urban planning projects use digital twin technology for infrastructure management, environmental monitoring, and urban development.

The integration of the Internet of Things and the Industrial Internet of Things is the leading factor pushing the development of the digital twin market. Digital twins are real-time monitoring, simulation, and optimization of physical assets and processes, making IoT and IIoT critical enablers of this technology. Nowadays, the number of connected devices is increasing exponentially, and the manufacturing, energy, healthcare industries, and smart cities are eager to integrate the digital twin technology to increase their efficiency, reduce downtimes, and enhance predictive maintenance IoT Analytics 2023. The report by IoT Analytics 2023 states the number of total global IoT connections surpassed 14.4 billion in 2022, which was 18% more Y-o-Y, and it will reach over 30 billion by 2025 IoT Analytics 2023. Furthermore, the same report also indicates that the share of the manufacturing industry among those who implemented industrial IoT solutions was the highest, and this year, around 35% of all factories use IoT to optimize their production lines IoT Analytics 2023. Similarly, IIoT plays a crucial role in enabling digital twins by facilitating real-time data collection and analysis from machines, equipment, and processes.

The IoT helps produce and store the data that is the foundation of digital twins. As the result of the integration of these three technologies, companies can enjoy the virtual simulations of any of their products or processes, helping leave significant savings of around 25-30% on running costs and extending the product life by 10-15% IoT Analytics 2023. Industries such as automotive, aerospace, and smart infrastructure are rapidly adopting this combination to stay competitive in an increasingly digital world.

Restraints

  • The significant investment required to integrate digital twins with existing systems and infrastructures can act as a barrier for smaller enterprises.

  • Digital twins involve the transfer of sensitive data, which raises concerns about cybersecurity risks, data breaches, and compliance with privacy regulations.

  • The absence of industry-wide standards for digital twin technology creates compatibility issues between different platforms and tools, hindering widespread adoption.

In some developing economies, limited awareness and understanding of the benefits of digital twin technology are slowing down its adoption and growth potential. A significant restraint to the digital twin market is data security and privacy concerns. The digital twins primarily function by creating a virtual replica of physical assets, systems, or processes. This copy often gathers real-time data, just like the actual systems, and therefore functions in a mirrored fashion of the world. Since the data is critical to the functioning of the twin, it tends to have an array of sensitive and proprietary types of information.

The transfer, storage, and processing of these large volumes of sensitive data can result in significant vulnerabilities to cyber-attacks, data breaches, and unauthorized access. For example, the manufacturing, healthcare, and energy industries have begun to utilize digital twins for everyday operations, meaning that any breach of this data would result in operational halts, financial damages, or safety hazards. Furthermore, the presence of data privacy and protection laws, such as the GDPR or the HIPAA, require organizations to ensure that their twin usage strictly adheres to the laws. This can require large amounts of encryption, data storage, and access control constraints.

Market Segmentation:

By Deployment

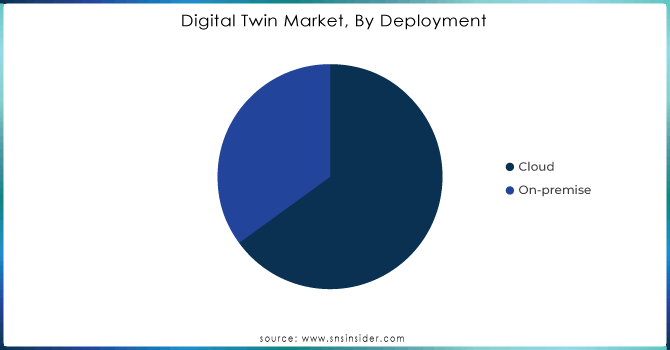
The on-premise deployment segment held the highest revenue share more than 61% in 2023. Large enterprises are adopting this emerging technology at a faster rate which optimizes security and compliance with government regulations. On-premise solutions allow large companies to have complete ownership and control of their vital systems.  However, the demand for on-premise solutions is expected to slow down during the forecast period, as consumer preferences shift toward cloud-based alternatives.

The cloud-based deployment segment is projected to grow with the highest compound annual growth rate during 2024 and 2032. Cloud deployment offers businesses higher flexibility and cost-efficiency by eliminating the need for physical infrastructure and reducing maintenance costs. The growing interest in cloud-based deployment solutions by consumers has encouraged firms to create better cloud-native digital twin technologies. For instance, In November 2022, Dassault Systèmes shifted its digital twin operations to the cloud to provide independent cloud services. Cloud operations directly integrate with the core of customers’ companies to unlock value at various levels.
Digital Twin Market, By Deployment

Need any customization research/data on Digital Twin Market - Enquiry Now

By Application

The predictive maintenance segment led the market and held the highest revenue share in 2023. Digital twin technology allows engineers to predict and conduct maintenance on a predetermined schedule. The approach to preventive maintenance helps prevent machine failures as issues are taken care of according to designated needs but not fixed schedules. As a result, downtime is reduced, and businesses do not under or over-invest in vital resources, leading to optimal performance.

Meanwhile, product design and development is expected to be the fastest-growing at a compound annual growth rate over the forecast period. The growing demand for this segment’s digital twin solutions is due to the assistance of engineers and designers in visualizing design concepts more effectively. By using digital twins, teams can test the impact of designs in simulations as well as review manufacturing processes with the help of computer-aided manufacturing (CAM) software, and refine designs in real time. These benefits make digital twin technology increasingly essential for enhancing product design and development.

By End-use

The automotive and transport segment was the largest revenue-generating segment in 2023, estimated to account for nearly 22% of the total revenue. This can be attributed to the increasing adoption of the digital twin technology owing to several advantages, such as cost optimization and enhanced vehicle safety and productivity. The technology offers improved means for the transfer of information with manufacturers and operators adopting the method to make informed decisions in areas such as vehicle design, operation, and maintenance. Through the application of digital twins, clients can realize improved orders, and demand forecasting experiences this technology offers real-time data for better decision-making and supply chain efficiency. Moreover, the technology offers real time vehicle health monitoring and predictive maintenance scheduling.

The telecommunications segment is expected to grow at the fastest compound annual growth rate from 2024 to 2032. With the adoption of digital twin technology in the telecom sector, operators can monitor their systems and networks to capture warnings of potential issues and prevent downtime. The benefits of the technology to customers and facility managers include reduced costs, improved experience, enhanced efficiency, and optimized network design. Real time data includes factors such as the level of demand for a service or a product in a given location at a specific time. Engineers, network managers, and service providers use the data to make informed decisions and develop and deliver personalized solutions to their clients.

Regional Insights

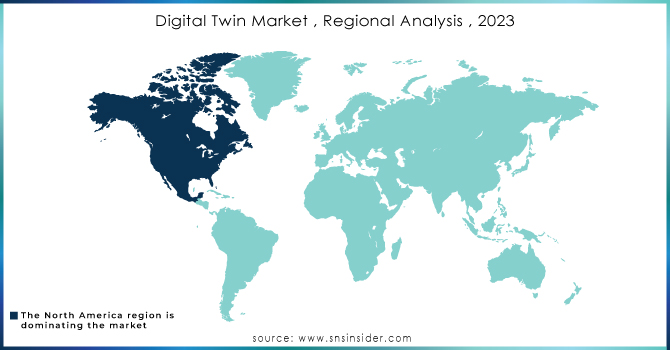
North America dominated the digital twin market in 2023, accounting for approximately 33% of the total revenue share. Growth is attributed to the emerging of technologies, such as robotic process automation (RPA), virtual reality, and internet of things, which are increasingly influencing the digital twin industry. Leading U.S. companies, including International Business Machines Corporation, Microsoft Corporation, and General Electric, are actively focused on developing new products and enhancing the existing solutions, in order to attract more customers and increase the overall market share.

The digital twin market is expected to expand throughout the Asia-Pacific region between 2024 and 2032. The projected compound annual growth rate is primarily an outcome of the increasing digital infrastructure, growing manufacturing output, and rising technological adoption rates. Increased demand is also fuelled by the use of digital twins in smart city projects and the general government initiatives promoting digitalization. Growth is expected to be particularly high in China, which is facilitating the creation of digital industrial clusters, primarily focusing on Integrated Circuits and Artificial Intelligence. The potential of the country to cater to the global market is remarkable. In Japan, the digital twin market is also expected to expand greatly, particularly due to the vast improvements in the field of robotics. Japanese companies and research institutions are leaders in this area since they focus on the development of AI-driven robots for all key fields. Social and companion robots, which come in various forms and can interact with humans, are in high demand and are expected to support Japanese digital twin market expansion.
Digital-Twin-Market--Regional-Analysis--2023

Key Players

  • ABB Group (ABB Ability™ Digital Twin, ABB Ability™ Remote Condition Monitoring)

  • Amazon Web Services, Inc. (AWS IoT TwinMaker, AWS IoT SiteWise)

  • ANSYS, Inc. (ANSYS Twin Builder, ANSYS Discovery Live)

  • Autodesk Inc. (Autodesk Revit, Autodesk BIM 360)

  • Oracle Corporation (Oracle IoT Cloud, Oracle Digital Twin Hub)

  • Accenture plc (Accenture Digital Twin Services, Accenture myConcerto)

  •  Hitachi Ltd. (Hitachi Lumada Digital Twin, Hitachi Smart Manufacturing)

  • AVEVA Group plc (AVEVA Predictive Analytics, AVEVA Asset Performance Management)

  • Capgemini (Capgemini Digital Twin Solutions, Capgemini IoT Solutions, Capgemini Digital Manufacturing)

  • Bentley Systems Inc. (Bentley iTwin, Bentley OpenBuildings Designer)

  • Dassault Systèmes (3DEXPERIENCE® Platform, CATIA Digital Twin)

  • General Electric (GE Digital Twin, Predix Platform)

  • Hexagon AB (Hexagon Digital Twin Solutions, Intergraph Smart 3D)

  • IBM Corporation (IBM) (IBM Maximo, IBM Watson IoT)

  • Microsoft Corp. (Microsoft Azure Digital Twins, Microsoft IoT Central)

  • PTC Inc. (PTC ThingWorx, PTC Vuforia)

  • Robert Bosch (Bosch IoT Suite, Bosch Digital Twin Solutions)

  • Rockwell Automation Inc. (Rockwell FactoryTalk, Rockwell Automation Digital Twin)

  • SAP SE (SAP Digital Twin, SAP Leonardo IoT)

  • Siemens AG (Siemens

and others in final Report.

Recent development

  • In June 2024, the collaboration of Siemens and KU Leuven to study digital twins pertaining to smart and sustainable products. Its main objective is to support research methodology, encourage innovation with industrial relevance, disseminate research results, and add educational value to digital twin topics.

  • In 2023, Rockwell Automation implemented the Robotic Supervision System for TotalEnergies. Thanks to a digital twin tool, the systems include IoT, gamification, manage industrial robots, and monitor the operation and performance of these tools.

Digital Twin Market Report Scope:

Report Attributes Details
Market Size in 2023  USD 16.2 Bn
Market Size by 2032  USD 287.2 Bn
CAGR   CAGR of 37.7% From 2024 to 2032
Base Year  2023
Forecast Period  2024-2032
Historical Data  2020-2022
Report Scope & Coverage Market Size, Segments Analysis, Competitive  Landscape, Regional Analysis, DROC & SWOT Analysis, Forecast Outlook
Key Segments • By Solution (Component, Process, System)
• By Enterprise Size (Large Enterprises, Small and Medium Enterprises (SMEs)
• By Deployment (Cloud, On-premise)
• By Application (Product Design & Development, Predictive Maintenance, Business Optimization, Others)
• By End-use (Manufacturing, Agriculture, Automotive & Transport, Energy & Utilities, Healthcare & Life Sciences, Residential & Commercial, Retail & Consumer Goods, Aerospace, Telecommunication, Others)
Regional Analysis/Coverage North America (US, Canada, Mexico), Europe (Eastern Europe [Poland, Romania, Hungary, Turkey, Rest of Eastern Europe] Western Europe] Germany, France, UK, Italy, Spain, Netherlands, Switzerland, Austria, Rest of Western Europe]), Asia Pacific (China, India, Japan, South Korea, Vietnam, Singapore, Australia, Rest of Asia Pacific), Middle East & Africa (Middle East [UAE, Egypt, Saudi Arabia, Qatar, Rest of Middle East], Africa [Nigeria, South Africa, Rest of Africa], Latin America (Brazil, Argentina, Colombia, Rest of Latin America)
Company Profiles ABB Group, Amazon Web Services, Inc., ANSYS, Inc., Autodesk Inc., Oracle Corporation, Accenture plc, Hitachi Ltd., AVEVA Group plc, Capgemini, Bentley Systems Inc., Dassault Systemes, General Electric, Hexagon AB, International Business Machines Corp., Microsoft Corp., PTC Inc., Robert Bosch GmbH, Rockwell Automation, SAP SE, Siemens AG
Key Drivers • Increased use of IoT (Internet of Things) and IIoT (Industrial Internet of Things) is driving the adoption of digital twins for real-time monitoring, predictive maintenance, and operational efficiency.
• The need to reduce operational downtime and maintenance costs has spurred the use of digital twins to predict equipment failures and improve asset utilization.
Market Opportunities • Digital twins involve the transfer of sensitive data, which raises concerns about cybersecurity risks, data breaches, and compliance with privacy regulations.

Frequently Asked Questions

The market is expected to grow to USD 287.2 billion by the forecast period of 2032.

Growth rate of the Digital Twin Market is CAGR 37.7 %.

The major players are Hitachi Ltd., Robert Bosch, Siemens AG, ABB Group, IBM Corporation, Schneider Electric, ANSYS Inc., Autodesk Inc., Accenture plc, and others in the final report.

USD 16.2 billion in 2023 is the market size of the Digital Twin Market.

 Ans: Yes, you can customize the report as per your requirements.

1. Introduction

1.1 Market Definition

1.2 Scope (Inclusion and Exclusions)

1.3 Research Assumptions

2. Executive Summary

2.1 Market Overview

2.2 Regional Synopsis

2.3 Competitive Summary

3. Research Methodology

3.1 Top-Down Approach

3.2 Bottom-up Approach

3.3. Data Validation

3.4 Primary Interviews

4. Market Dynamics Impact Analysis

4.1 Market Driving Factors Analysis

4.1.1 Drivers

4.1.2 Restraints

4.1.3 Opportunities

4.1.4 Challenges

4.2 PESTLE Analysis

4.3 Porter’s Five Forces Model

5. Statistical Insights and Trends Reporting

5.1 Adoption Rates of Emerging Technologies

5.2 Network Infrastructure Expansion, by Region

5.3 Cybersecurity Incidents, by Region (2020-2023)

5.4 Cloud Services Usage, by Region

6. Competitive Landscape

6.1 List of Major Companies, By Region

6.2 Market Share Analysis, By Region

6.3 Product Benchmarking

6.3.1 Product specifications and features

6.3.2 Pricing

6.4 Strategic Initiatives

6.4.1 Marketing and promotional activities

6.4.2 Distribution and supply chain strategies

6.4.3 Expansion plans and new product launches

6.4.4 Strategic partnerships and collaborations

6.5 Technological Advancements

6.6 Market Positioning and Branding

7. Digital Twin Market Segmentation, By Solution
7.1 Chapter Overview

7.2 Component

7.2.1 Component Market Trends Analysis (2020-2032)

7.2.2 Component Market Size Estimates and Forecasts to 2032 (USD Billion)

7.3 Process

7.3.1 Process Market Trends Analysis (2020-2032)

7.3.2 Process Market Size Estimates and Forecasts to 2032 (USD Billion)

7.4 System

7.4.1 System Market Trends Analysis (2020-2032)

7.4.2 System Market Size Estimates and Forecasts to 2032 (USD Billion)

8. Digital Twin Market Segmentation, By Enterprise Size

8.1 Chapter Overview

8.2 SME

8.2.1 SME Market Trends Analysis (2020-2032)

8.2.2 SME Market Size Estimates And Forecasts To 2032 (USD Billion)

8.3 Large Enterprise

8.3.1 Large Enterprise Market Trends Analysis (2020-2032)

8.3.2 Large Enterprise Market Size Estimates And Forecasts To 2032 (USD Billion)

9. Digital Twin Market Segmentation, By Deployment

9.1 Chapter Overview

9.2 On-Cloud

9.2.1 On-Cloud Market Trends Analysis (2020-2032)

9.2.2 On-Cloud Market Size Estimates And Forecasts To 2032 (USD Billion)

9.3 On-Premise

9.3.1 On-Premise Market Trends Analysis (2020-2032)

9.3.2 On-Premise Market Size Estimates And Forecasts To 2032 (USD Billion)

10. Digital Twin Market Segmentation, By Application

10.1 Chapter Overview

10.2 Product Design & Development

10.2.1 Product Design & Development Market Trends Analysis (2020-2032)

10.2.2 Product Design & Development Market Size Estimates And Forecasts To 2032 (USD Billion)

10.3 Predictive Maintenance

10.3.1 Predictive Maintenance Market Trends Analysis (2020-2032)

10.3.2 Predictive Maintenance Market Size Estimates And Forecasts To 2032 (USD Billion)

10.4 Business Optimization

10.4.1 Business Optimization Market Trends Analysis (2020-2032)

10.4.2 Business Optimization Market Size Estimates And Forecasts To 2032 (USD Billion)

10.5 Others

10.5.1 Others Market Trends Analysis (2020-2032)

10.5.2 Others Market Size Estimates And Forecasts To 2032 (USD Billion)

11. Digital Twin Market Segmentation, By End-use

11.1 Chapter Overview

11.2 Manufacturing

11.2.1 Manufacturing Market Trends Analysis (2020-2032)

11.2.2 Manufacturing Market Size Estimates And Forecasts To 2032 (USD Billion)

11.3 Agriculture

11.3.1 Agriculture Market Trends Analysis (2020-2032)

11.3.2 Agriculture Market Size Estimates And Forecasts To 2032 (USD Billion)

11.4 Automotive & Transport

11.4.1 Automotive & Transport Market Trends Analysis (2020-2032)

11.4.2 Automotive & Transport Market Size Estimates And Forecasts To 2032 (USD Billion)

11.5 Energy & Utilities

11.5.1 Energy & Utilities Market Trends Analysis (2020-2032)

11.5.2 Energy & Utilities Market Size Estimates And Forecasts To 2032 (USD Billion)

11.6 Healthcare & Life Sciences

11.6.1 Healthcare & Life Sciences Market Trends Analysis (2020-2032)

11.6.2 Healthcare & Life Sciences Market Size Estimates And Forecasts To 2032 (USD Billion)

11.7 Residential & Commercial

11.7.1 Residential & Commercial Market Trends Analysis (2020-2032)

11.7.2 Residential & Commercial Market Size Estimates And Forecasts To 2032 (USD Billion)

11.8 Retail & Consumer Goods

11.8.1 Retail & Consumer Goods Market Trends Analysis (2020-2032)

11.8.2 Retail & Consumer Goods Market Size Estimates And Forecasts To 2032 (USD Billion)

11.9 Aerospace

11.9.1 Aerospace Market Trends Analysis (2020-2032)

11.9.2 Aerospace Market Size Estimates And Forecasts To 2032 (USD Billion)

11.10 Telecommunication

11.10.1 Telecommunication Market Trends Analysis (2020-2032)

11.10.2 Telecommunication Market Size Estimates And Forecasts To 2032 (USD Billion)

11.11 Others

11.11.1 Others Market Trends Analysis (2020-2032)

11.11.2 Others Market Size Estimates And Forecasts To 2032 (USD Billion)

12. Regional Analysis

12.1 Chapter Overview

12.2 North America

12.2.1 Trends Analysis

12.2.2 North America Digital Twin Market Estimates And Forecasts, By Country (2020-2032) (USD Billion)

12.2.3 North America Digital Twin Market Estimates And Forecasts, By Solution (2020-2032) (USD Billion)

12.2.4 North America Digital Twin Market Estimates And Forecasts, By Enterprise Size (2020-2032) (USD Billion)

12.2.5 North America Digital Twin Market Estimates And Forecasts, By Deployment (2020-2032) (USD Billion)

12.2.6 North America Digital Twin Market Estimates And Forecasts, By Application (2020-2032) (USD Billion)

12.2.7 North America Digital Twin Market Estimates And Forecasts, By End-use (2020-2032) (USD Billion)

12.2.8 USA

12.2.8.1 USA Digital Twin Market Estimates And Forecasts, By Solution (2020-2032) (USD Billion)

12.2.8.2 USA Digital Twin Market Estimates And Forecasts, By Enterprise Size (2020-2032) (USD Billion)

12.2.8.3 USA Digital Twin Market Estimates And Forecasts, By Deployment (2020-2032) (USD Billion)

12.2.8.4 USA Digital Twin Market Estimates And Forecasts, By Application (2020-2032) (USD Billion)

12.2.8.5 USA Digital Twin Market Estimates And Forecasts, By End-use (2020-2032) (USD Billion)

12.2.9 Canada

12.2.9.1 Canada Digital Twin Market Estimates And Forecasts, By Solution (2020-2032) (USD Billion)

12.2.9.2 Canada Digital Twin Market Estimates And Forecasts, By Enterprise Size (2020-2032) (USD Billion)

12.2.9.3 Canada Digital Twin Market Estimates And Forecasts, By Deployment (2020-2032) (USD Billion)

12.2.9.4 Canada Digital Twin Market Estimates And Forecasts, By Application (2020-2032) (USD Billion)

12.2.9.5 Canada Digital Twin Market Estimates And Forecasts, By End-use (2020-2032) (USD Billion)


12.2.10 Mexico

12.2.10.1 Mexico Digital Twin Market Estimates And Forecasts, By Solution (2020-2032) (USD Billion)

12.2.10.2 Mexico Digital Twin Market Estimates And Forecasts, By Enterprise Size (2020-2032) (USD Billion)

12.2.10.3 Mexico Digital Twin Market Estimates And Forecasts, By Deployment (2020-2032) (USD Billion)

12.2.10.4 Mexico Digital Twin Market Estimates And Forecasts, By Application (2020-2032) (USD Billion)

12.2.10.5 Mexico Digital Twin Market Estimates And Forecasts, By End-use (2020-2032) (USD Billion)

12.3 Europe

12.3.1 Eastern Europe

12.3.1.1 Trends Analysis

12.3.1.2 Eastern Europe Digital Twin Market Estimates And Forecasts, By Country (2020-2032) (USD Billion)

12.3.1.3 Eastern Europe Digital Twin Market Estimates And Forecasts, By Solution (2020-2032) (USD Billion)

12.3.1.4 Eastern Europe Digital Twin Market Estimates And Forecasts, By Enterprise Size (2020-2032) (USD Billion)

12.3.1.5 Eastern Europe Digital Twin Market Estimates And Forecasts, By Deployment (2020-2032) (USD Billion)

12.3.1.6 Eastern Europe
Digital Twin Market Estimates And Forecasts, By Application (2020-2032) (USD Billion)

12.3.1.7 Eastern Europe Digital Twin Market Estimates And Forecasts, By End-use (2020-2032) (USD Billion)

12.3.1.8 Poland

12.3.1.8.1 Poland Digital Twin Market Estimates And Forecasts, By Solution (2020-2032) (USD Billion)

12.3.1.8.2 Poland Digital Twin Market Estimates And Forecasts, By Enterprise Size (2020-2032) (USD Billion)

12.3.1.8.3 Poland Digital Twin Market Estimates And Forecasts, By Deployment (2020-2032) (USD Billion)


12.3.1.8.4 Poland Digital Twin Market Estimates And Forecasts, By Application (2020-2032) (USD Billion)

12.3.1.8.5 Poland Digital Twin Market Estimates And Forecasts, By End-use (2020-2032) (USD Billion)

12.3.1.9 Romania

12.3.1.9.1 Romania Digital Twin Market Estimates And Forecasts, By Solution (2020-2032) (USD Billion)

12.3.1.9.2 Romania Digital Twin Market Estimates And Forecasts, By Enterprise Size (2020-2032) (USD Billion)

12.3.1.9.3 Romania Digital Twin Market Estimates And Forecasts, By Deployment (2020-2032) (USD Billion)


12.3.1.9.4 Romania Digital Twin Market Estimates And Forecasts, By Application (2020-2032) (USD Billion)


12.3.1.9.5 Romania Digital Twin Market Estimates And Forecasts, By End-use (2020-2032) (USD Billion)

12.3.1.10 Hungary

12.3.1.10.1 Hungary Digital Twin Market Estimates And Forecasts, By Solution (2020-2032) (USD Billion)

12.3.1.10.2 Hungary Digital Twin Market Estimates And Forecasts, By Enterprise Size (2020-2032) (USD Billion)

12.3.1.10.3 Hungary Digital Twin Market Estimates And Forecasts, By Deployment (2020-2032) (USD Billion)


12.3.1.10.4 Hungary Digital Twin Market Estimates And Forecasts, By Application (2020-2032) (USD Billion)

12.3.1.10.5 Hungary
Digital Twin Market Estimates And Forecasts, By End-use (2020-2032) (USD Billion)

12.3.1.11 Turkey

12.3.1.11.1 Turkey Digital Twin Market Estimates And Forecasts, By Solution (2020-2032) (USD Billion)

12.3.1.11.2 Turkey Digital Twin Market Estimates And Forecasts, By Enterprise Size (2020-2032) (USD Billion)

12.3.1.11.3 Turkey Digital Twin Market Estimates And Forecasts, By Deployment (2020-2032) (USD Billion)

12.3.1.11.4 Turkey
Digital Twin Market Estimates And Forecasts, By Application (2020-2032) (USD Billion)


12.3.1.11.5 Turkey Digital Twin Market Estimates And Forecasts, By End-use (2020-2032) (USD Billion)


12.3.1.12 Rest Of Eastern Europe

12.3.1.12.1 Rest Of Eastern Europe Digital Twin Market Estimates And Forecasts, By Solution (2020-2032) (USD Billion)

12.3.1.12.2 Rest Of Eastern Europe Digital Twin Market Estimates And Forecasts, By Enterprise Size (2020-2032) (USD Billion)

12.3.1.12.3 Rest Of Eastern Europe Digital Twin Market Estimates And Forecasts, By Deployment (2020-2032) (USD Billion)

12.3.1.12.4 Rest Of Eastern Europe
Digital Twin Market Estimates And Forecasts, By Application (2020-2032) (USD Billion)

12.3.1.12.5 Rest Of Eastern Europe
Digital Twin Market Estimates And Forecasts, By End-use (2020-2032) (USD Billion)

12.3.2 Western Europe

12.3.2.1 Trends Analysis

12.3.2.2 Western Europe Digital Twin Market Estimates And Forecasts, By Country (2020-2032) (USD Billion)

12.3.2.3 Western Europe Digital Twin Market Estimates And Forecasts, By Solution (2020-2032) (USD Billion)

12.3.2.4 Western Europe Digital Twin Market Estimates And Forecasts, By Enterprise Size (2020-2032) (USD Billion)

12.3.2.5 Western Europe Digital Twin Market Estimates And Forecasts, By Deployment (2020-2032) (USD Billion)

12.3.2.6 Western Europe
Digital Twin Market Estimates And Forecasts, By Application (2020-2032) (USD Billion)

12.3.2.7 Western Europe
Digital Twin Market Estimates And Forecasts, By End-use (2020-2032) (USD Billion)

12.3.2.8 Germany

12.3.2.8.1 Germany Digital Twin Market Estimates And Forecasts, By Solution (2020-2032) (USD Billion)

12.3.2.8.2 Germany Digital Twin Market Estimates And Forecasts, By Enterprise Size (2020-2032) (USD Billion)

12.3.2.8.3 Germany Digital Twin Market Estimates And Forecasts, By Deployment (2020-2032) (USD Billion)

12.3.2.8.4 Germany Digital Twin Market Estimates And Forecasts, By Application (2020-2032) (USD Billion)

12.3.2.8.5 Germany Digital Twin Market Estimates And Forecasts, By End-use (2020-2032) (USD Billion)


12.3.2.9 France

12.3.2.9.1 France Digital Twin Market Estimates And Forecasts, By Solution (2020-2032) (USD Billion)

12.3.2.9.2 France Digital Twin Market Estimates And Forecasts, By Enterprise Size (2020-2032) (USD Billion)

12.3.2.9.3 France Digital Twin Market Estimates And Forecasts, By Deployment (2020-2032) (USD Billion)

12.3.2.9.4 France Digital Twin Market Estimates And Forecasts, By Application (2020-2032) (USD Billion)

12.3.2.9.5 France Digital Twin Market Estimates And Forecasts, By End-use (2020-2032) (USD Billion)

12.3.2.10 UK

12.3.2.10.1 UK Digital Twin Market Estimates And Forecasts, By Solution (2020-2032) (USD Billion)

12.3.2.10.2 UK Digital Twin Market Estimates And Forecasts, By Enterprise Size (2020-2032) (USD Billion)

12.3.2.10.3 UK Digital Twin Market Estimates And Forecasts, By Deployment (2020-2032) (USD Billion)

12.3.2.10.4 UK Digital Twin Market Estimates And Forecasts, By Application (2020-2032) (USD Billion)

12.3.2.10.5 UK Digital Twin Market Estimates And Forecasts, By End-use (2020-2032) (USD Billion)

12.3.2.11 Italy

12.3.2.11.1 Italy Digital Twin Market Estimates And Forecasts, By Solution (2020-2032) (USD Billion)

12.3.2.11.2 Italy Digital Twin Market Estimates And Forecasts, By Enterprise Size (2020-2032) (USD Billion)

12.3.2.11.3 Italy Digital Twin Market Estimates And Forecasts, By Deployment (2020-2032) (USD Billion)


12.3.2.11.4 Italy Digital Twin Market Estimates And Forecasts, By Application (2020-2032) (USD Billion)


12.3.2.11.5 Italy Digital Twin Market Estimates And Forecasts, By End-use (2020-2032) (USD Billion)

12.3.2.12 Spain

12.3.2.12.1 Spain Digital Twin Market Estimates And Forecasts, By Solution (2020-2032) (USD Billion)

12.3.2.12.2 Spain Digital Twin Market Estimates And Forecasts, By Enterprise Size (2020-2032) (USD Billion)

12.3.2.12.3 Spain Digital Twin Market Estimates And Forecasts, By Deployment (2020-2032) (USD Billion)


12.3.2.12.4 Spain Digital Twin Market Estimates And Forecasts, By Application (2020-2032) (USD Billion)


12.3.2.12.5 Spain Digital Twin Market Estimates And Forecasts, By End-use (2020-2032) (USD Billion)

12.3.2.13 Netherlands

12.3.2.13.1 Netherlands Digital Twin Market Estimates And Forecasts, By Solution (2020-2032) (USD Billion)

12.3.2.13.2 Netherlands Digital Twin Market Estimates And Forecasts, By Enterprise Size (2020-2032) (USD Billion)

12.3.2.13.3 Netherlands Digital Twin Market Estimates And Forecasts, By Deployment (2020-2032) (USD Billion)


12.3.2.13.4 Netherlands Digital Twin Market Estimates And Forecasts, By Application (2020-2032) (USD Billion)


12.3.2.13.5 Netherlands Digital Twin Market Estimates And Forecasts, By End-use (2020-2032) (USD Billion)

12.3.2.14 Switzerland

12.3.2.14.1 Switzerland Digital Twin Market Estimates And Forecasts, By Solution (2020-2032) (USD Billion)

12.3.2.14.2 Switzerland Digital Twin Market Estimates And Forecasts, By Enterprise Size (2020-2032) (USD Billion)

12.3.2.14.3 Switzerland Digital Twin Market Estimates And Forecasts, By Deployment (2020-2032) (USD Billion)


12.3.2.14.4 Switzerland Digital Twin Market Estimates And Forecasts, By Application (2020-2032) (USD Billion)


12.3.2.12.5 Switzerland Digital Twin Market Estimates And Forecasts, By End-use (2020-2032) (USD Billion)

12.3.2.15 Austria

12.3.2.15.1 Austria Digital Twin Market Estimates And Forecasts, By Solution (2020-2032) (USD Billion)

12.3.2.15.2 Austria Digital Twin Market Estimates And Forecasts, By Enterprise Size (2020-2032) (USD Billion)

12.3.2.15.3 Austria Digital Twin Market Estimates And Forecasts, By Deployment (2020-2032) (USD Billion)


12.3.2.15.4 Austria Digital Twin Market Estimates And Forecasts, By Application (2020-2032) (USD Billion)


12.3.2.15.5 Austria Digital Twin Market Estimates And Forecasts, By End-use (2020-2032) (USD Billion)

12.3.2.16 Rest Of Western Europe

12.3.2.16.1 Rest Of Western Europe Digital Twin Market Estimates And Forecasts, By Solution (2020-2032) (USD Billion)

12.3.2.16.2 Rest Of Western Europe Digital Twin Market Estimates And Forecasts, By Enterprise Size (2020-2032) (USD Billion)

12.3.2.16.3 Rest Of Western Europe Digital Twin Market Estimates And Forecasts, By Deployment (2020-2032) (USD Billion)


12.3.2.16.4 Rest Of Western Europe Digital Twin Market Estimates And Forecasts, By Application (2020-2032) (USD Billion)


12.3.2.16.5 Rest Of Western Europe Digital Twin Market Estimates And Forecasts, By End-use (2020-2032) (USD Billion)

12.4 Asia Pacific

12.4.1 Trends Analysis

12.4.2 Asia Pacific Digital Twin Market Estimates And Forecasts, By Country (2020-2032) (USD Billion)

12.4.3 Asia Pacific Digital Twin Market Estimates And Forecasts, By Solution (2020-2032) (USD Billion)

12.4.4 Asia Pacific Digital Twin Market Estimates And Forecasts, By Enterprise Size (2020-2032) (USD Billion)

12.4.5 Asia Pacific Digital Twin Market Estimates And Forecasts, By Deployment (2020-2032) (USD Billion)


12.4.6 Asia Pacific Digital Twin Market Estimates And Forecasts, By Application (2020-2032) (USD Billion)


12.4.7 Asia Pacific Digital Twin Market Estimates And Forecasts, By End-use (2020-2032) (USD Billion)

12.4.8 China

12.4.8.1 China Digital Twin Market Estimates And Forecasts, By Solution (2020-2032) (USD Billion)

12.4.8.2 China Digital Twin Market Estimates And Forecasts, By Enterprise Size (2020-2032) (USD Billion)

12.4.8.3 China Digital Twin Market Estimates And Forecasts, By Deployment (2020-2032) (USD Billion)


12.4.8.4 China Digital Twin Market Estimates And Forecasts, By Application (2020-2032) (USD Billion)


12.4.8.5 China Digital Twin Market Estimates And Forecasts, By End-use (2020-2032) (USD Billion)

12.4.9 India

12.4.9.1 India Digital Twin Market Estimates And Forecasts, By Solution (2020-2032) (USD Billion)

12.4.9.2 India Digital Twin Market Estimates And Forecasts, By Enterprise Size (2020-2032) (USD Billion)

12.4.9.3 India Digital Twin Market Estimates And Forecasts, By Deployment (2020-2032) (USD Billion)


12.4.9.4 India Digital Twin Market Estimates And Forecasts, By Application (2020-2032) (USD Billion)

12.4.9.5 India Digital Twin Market Estimates And Forecasts, By End-use (2020-2032) (USD Billion)

12.4.10 Japan

12.4.10.1 Japan Digital Twin Market Estimates And Forecasts, By Solution (2020-2032) (USD Billion)

12.4.10.2 Japan Digital Twin Market Estimates And Forecasts, By Enterprise Size (2020-2032) (USD Billion)

12.4.10.3 Japan Digital Twin Market Estimates And Forecasts, By Deployment (2020-2032) (USD Billion)

12.4.10.4 Japan Digital Twin Market Estimates And Forecasts, By Application (2020-2032) (USD Billion)

12.4.10.5 Japan Digital Twin Market Estimates And Forecasts, By End-use (2020-2032) (USD Billion)

12.4.11 South Korea

12.4.11.1 South Korea Digital Twin Market Estimates And Forecasts, By Solution (2020-2032) (USD Billion)

12.4.11.2 South Korea Digital Twin Market Estimates And Forecasts, By Enterprise Size (2020-2032) (USD Billion)

12.4.11.3 South Korea Digital Twin Market Estimates And Forecasts, By Deployment (2020-2032) (USD Billion)

12.4.11.4 South Korea Digital Twin Market Estimates And Forecasts, By Application (2020-2032) (USD Billion)

12.4.11.5 South Korea Digital Twin Market Estimates And Forecasts, By End-use (2020-2032) (USD Billion)

12.4.12 Vietnam

12.4.12.1 Vietnam Digital Twin Market Estimates And Forecasts, By Solution (2020-2032) (USD Billion)

12.4.12.2 Vietnam Digital Twin Market Estimates And Forecasts, By Enterprise Size (2020-2032) (USD Billion)

12.4.12.3 Vietnam Digital Twin Market Estimates And Forecasts, By Deployment (2020-2032) (USD Billion)

12.4.12.4 Vietnam Digital Twin Market Estimates And Forecasts, By Application (2020-2032) (USD Billion)

12.4.12.5 Vietnam Digital Twin Market Estimates And Forecasts, By End-use (2020-2032) (USD Billion)

12.4.13 Singapore

12.4.13.1 Singapore Digital Twin Market Estimates And Forecasts, By Solution (2020-2032) (USD Billion)

12.4.13.2 Singapore Digital Twin Market Estimates And Forecasts, By Enterprise Size (2020-2032) (USD Billion)

12.4.13.3 Singapore Digital Twin Market Estimates And Forecasts, By Deployment (2020-2032) (USD Billion)

12.4.13.4 Singapore Digital Twin Market Estimates And Forecasts, By Application (2020-2032) (USD Billion)

12.4.13.5 Singapore Digital Twin Market Estimates And Forecasts, By End-use (2020-2032) (USD Billion)

12.4.14 Australia

12.4.14.1 Australia Digital Twin Market Estimates And Forecasts, By Solution (2020-2032) (USD Billion)

12.4.14.2 Australia Digital Twin Market Estimates And Forecasts, By Enterprise Size (2020-2032) (USD Billion)

12.4.14.3 Australia Digital Twin Market Estimates And Forecasts, By Deployment (2020-2032) (USD Billion)

12.4.14.4 Australia Digital Twin Market Estimates And Forecasts, By Application (2020-2032) (USD Billion)

12.4.14.5 Australia Digital Twin Market Estimates And Forecasts, By End-use (2020-2032) (USD Billion)

12.4.15 Rest Of Asia Pacific

12.4.15.1 Rest Of Asia Pacific Digital Twin Market Estimates And Forecasts, By Solution (2020-2032) (USD Billion)

12.4.15.2 Rest Of Asia Pacific Digital Twin Market Estimates And Forecasts, By Enterprise Size (2020-2032) (USD Billion)

12.4.15.3 Rest Of Asia Pacific Digital Twin Market Estimates And Forecasts, By Deployment (2020-2032) (USD Billion)

12.4.15.4 Rest Of Asia Pacific Digital Twin Market Estimates And Forecasts, By Application (2020-2032) (USD Billion)

12.4.15.5 Rest Of Asia Pacific Digital Twin Market Estimates And Forecasts, By End-use (2020-2032) (USD Billion)

12.5 Middle East And Africa

12.5.1 Middle East

12.5.1.1 Trends Analysis

12.5.1.2 Middle East Digital Twin Market Estimates And Forecasts, By Country (2020-2032) (USD Billion)

12.5.1.3 Middle East Digital Twin Market Estimates And Forecasts, By Solution (2020-2032) (USD Billion)

12.5.1.4 Middle East Digital Twin Market Estimates And Forecasts, By Enterprise Size (2020-2032) (USD Billion)

12.5.1.5 Middle East Digital Twin Market Estimates And Forecasts, By Deployment (2020-2032) (USD Billion)

12.5.1.6 Middle East
Digital Twin Market Estimates And Forecasts, By Application (2020-2032) (USD Billion)

12.5.1.7 Middle East
Digital Twin Market Estimates And Forecasts, By End-use (2020-2032) (USD Billion)

12.5.1.8 UAE

12.5.1.8.1 UAE Digital Twin Market Estimates And Forecasts, By Solution (2020-2032) (USD Billion)

12.5.1.8.2 UAE Digital Twin Market Estimates And Forecasts, By Enterprise Size (2020-2032) (USD Billion)

12.5.1.8.3 UAE Digital Twin Market Estimates And Forecasts, By Deployment (2020-2032) (USD Billion)

12.5.1.8.4 UAE Digital Twin Market Estimates And Forecasts, By Application (2020-2032) (USD Billion)

12.5.1.8.5 UAE Digital Twin Market Estimates And Forecasts, By End-use (2020-2032) (USD Billion)

12.5.1.9 Egypt

12.5.1.9.1 Egypt Digital Twin Market Estimates And Forecasts, By Solution (2020-2032) (USD Billion)

12.5.1.9.2 Egypt Digital Twin Market Estimates And Forecasts, By Enterprise Size (2020-2032) (USD Billion)

12.5.1.9.3 Egypt Digital Twin Market Estimates And Forecasts, By Deployment (2020-2032) (USD Billion)

12.5.1.9.4 Egypt Digital Twin Market Estimates And Forecasts, By Application (2020-2032) (USD Billion)

12.5.1.9.5 Egypt Digital Twin Market Estimates And Forecasts, By End-use (2020-2032) (USD Billion)

12.5.1.10 Saudi Arabia

12.5.1.10.1 Saudi Arabia Digital Twin Market Estimates And Forecasts, By Solution (2020-2032) (USD Billion)

12.5.1.10.2 Saudi Arabia Digital Twin Market Estimates And Forecasts, By Enterprise Size (2020-2032) (USD Billion)

12.5.1.10.3 Saudi Arabia Digital Twin Market Estimates And Forecasts, By Deployment (2020-2032) (USD Billion)

12.5.1.10.4 Saudi Arabia Digital Twin Market Estimates And Forecasts, By Application (2020-2032) (USD Billion)

12.5.1.10.5 Saudi Arabia Digital Twin Market Estimates And Forecasts, By End-use (2020-2032) (USD Billion)

12.5.1.11 Qatar

12.5.1.11.1 Qatar Digital Twin Market Estimates And Forecasts, By Solution (2020-2032) (USD Billion)

12.5.1.11.2 Qatar Digital Twin Market Estimates And Forecasts, By Enterprise Size (2020-2032) (USD Billion)

12.5.1.11.3 Qatar Digital Twin Market Estimates And Forecasts, By Deployment (2020-2032) (USD Billion)

12.5.1.11.4 Qatar Digital Twin Market Estimates And Forecasts, By Application (2020-2032) (USD Billion)

12.5.1.11.5 Qatar Digital Twin Market Estimates And Forecasts, By End-use (2020-2032) (USD Billion)

12.5.1.12 Rest Of Middle East

12.5.1.12.1 Rest Of Middle East Digital Twin Market Estimates And Forecasts, By Solution (2020-2032) (USD Billion)

12.5.1.12.2 Rest Of Middle East Digital Twin Market Estimates And Forecasts, By Enterprise Size (2020-2032) (USD Billion)

12.5.1.12.3 Rest Of Middle East Digital Twin Market Estimates And Forecasts, By Deployment (2020-2032) (USD Billion)

12.5.1.12.4 Rest Of Middle East Digital Twin Market Estimates And Forecasts, By Application (2020-2032) (USD Billion)

12.5.1.12.5 Rest Of Middle East Digital Twin Market Estimates And Forecasts, By End-use (2020-2032) (USD Billion)

12.5.2 Africa

12.5.2.1 Trends Analysis

12.5.2.2 Africa Digital Twin Market Estimates And Forecasts, By Country (2020-2032) (USD Billion)

12.5.2.3 Africa Digital Twin Market Estimates And Forecasts, By Solution (2020-2032) (USD Billion)

12.5.2.4 Africa Digital Twin Market Estimates And Forecasts, By Enterprise Size (2020-2032) (USD Billion)

12.5.2.5 Africa Digital Twin Market Estimates And Forecasts, By Deployment (2020-2032) (USD Billion)

12.5.2.6 Africa
Digital Twin Market Estimates And Forecasts, By Application (2020-2032) (USD Billion)

12.5.2.7 Africa
Digital Twin Market Estimates And Forecasts, By End-use (2020-2032) (USD Billion)

12.5.2.8 South Africa

12.5.2.8.1 South Africa Digital Twin Market Estimates And Forecasts, By Solution (2020-2032) (USD Billion)

12.5.2.8.2 South Africa Digital Twin Market Estimates And Forecasts, By Enterprise Size (2020-2032) (USD Billion)

12.5.2.8.3 South Africa Digital Twin Market Estimates And Forecasts, By Deployment (2020-2032) (USD Billion)

12.5.2.8.4 South Africa Digital Twin Market Estimates And Forecasts, By Application (2020-2032) (USD Billion)

12.5.2.8.5 South Africa Digital Twin Market Estimates And Forecasts, By End-use (2020-2032) (USD Billion)

12.5.2.9 Nigeria

12.5.2.9.1 Nigeria Digital Twin Market Estimates And Forecasts, By Solution (2020-2032) (USD Billion)

12.5.2.9.2 Nigeria Digital Twin Market Estimates And Forecasts, By Enterprise Size (2020-2032) (USD Billion)

12.5.2.9.3 Nigeria Digital Twin Market Estimates And Forecasts, By Deployment (2020-2032) (USD Billion)

12.5.2.9.4 Nigeria Digital Twin Market Estimates And Forecasts, By Application (2020-2032) (USD Billion)

12.5.2.9.5 Nigeria Digital Twin Market Estimates And Forecasts, By End-use (2020-2032) (USD Billion)

12.5.2.10 Rest Of Africa

12.5.2.10.1 Rest Of Africa Digital Twin Market Estimates And Forecasts, By Solution (2020-2032) (USD Billion)

12.5.2.10.2 Rest Of Africa Digital Twin Market Estimates And Forecasts, By Enterprise Size (2020-2032) (USD Billion)

12.5.2.10.3 Rest Of Africa Digital Twin Market Estimates And Forecasts, By Deployment (2020-2032) (USD Billion)

12.5.2.10.4 Rest Of Africa Digital Twin Market Estimates And Forecasts, By Application (2020-2032) (USD Billion)

12.5.2.10.5 Rest Of Africa Digital Twin Market Estimates And Forecasts, By End-use (2020-2032) (USD Billion)

12.6 Latin America

12.6.1 Trends Analysis

12.6.2 Latin America Digital Twin Market Estimates And Forecasts, By Country (2020-2032) (USD Billion)

12.6.3 Latin America Digital Twin Market Estimates And Forecasts, By Solution (2020-2032) (USD Billion)

12.6.4 Latin America Digital Twin Market Estimates And Forecasts, By Enterprise Size (2020-2032) (USD Billion)

12.6.5 Latin America Digital Twin Market Estimates And Forecasts, By Deployment (2020-2032) (USD Billion)

12.6.6 Latin America Digital Twin Market Estimates And Forecasts, By Application (2020-2032) (USD Billion)

12.6.7 Latin America Digital Twin Market Estimates And Forecasts, By End-use (2020-2032) (USD Billion)

12.6.8 Brazil

12.6.8.1 Brazil Digital Twin Market Estimates And Forecasts, By Solution (2020-2032) (USD Billion)

12.6.8.2 Brazil Digital Twin Market Estimates And Forecasts, By Enterprise Size (2020-2032) (USD Billion)

12.6.8.3 Brazil Digital Twin Market Estimates And Forecasts, By Deployment (2020-2032) (USD Billion)

12.6.8.4 Brazil Digital Twin Market Estimates And Forecasts, By Application (2020-2032) (USD Billion)

12.6.8.5 Brazil Digital Twin Market Estimates And Forecasts, By End-use (2020-2032) (USD Billion)

12.6.9 Argentina

12.6.9.1 Argentina Digital Twin Market Estimates And Forecasts, By Solution (2020-2032) (USD Billion)

12.6.9.2 Argentina Digital Twin Market Estimates And Forecasts, By Enterprise Size (2020-2032) (USD Billion)

12.6.9.3 Argentina Digital Twin Market Estimates And Forecasts, By Deployment (2020-2032) (USD Billion)

12.6.9.4 Argentina Digital Twin Market Estimates And Forecasts, By Application (2020-2032) (USD Billion)

12.6.9.5 Argentina Digital Twin Market Estimates And Forecasts, By End-use (2020-2032) (USD Billion)

12.6.10 Colombia

12.6.10.1 Colombia Digital Twin Market Estimates And Forecasts, By Solution (2020-2032) (USD Billion)

12.6.10.2 Colombia Digital Twin Market Estimates And Forecasts, By Enterprise Size (2020-2032) (USD Billion)

12.6.10.3 Colombia Digital Twin Market Estimates And Forecasts, By Deployment (2020-2032) (USD Billion)

12.6.10.4 Colombia Digital Twin Market Estimates And Forecasts, By Application (2020-2032) (USD Billion)

12.6.10.5 Colombia Digital Twin Market Estimates And Forecasts, By End-use (2020-2032) (USD Billion)

12.6.11 Rest Of Latin America

12.6.11.1 Rest Of Latin America Digital Twin Market Estimates And Forecasts, By Solution (2020-2032) (USD Billion)

12.6.11.2 Rest Of Latin America Digital Twin Market Estimates And Forecasts, By Enterprise Size (2020-2032) (USD Billion)

12.6.11.3 Rest Of Latin America Digital Twin Market Estimates And Forecasts, By Deployment (2020-2032) (USD Billion)

12.6.11.4 Rest Of Latin America Digital Twin Market Estimates And Forecasts, By Application (2020-2032) (USD Billion)

12.6.11.5 Rest Of Latin America Digital Twin Market Estimates And Forecasts, By End-use (2020-2032) (USD Billion)

13. Company Profiles

13.1 ABB Group

13.1.1 Company Overview

13.1.2 Financial

13.1.3 Products/ Services Offered

13.1.4 SWOT Analysis

13.2 Amazon Web Services, Inc.

13.2.1 Company Overview

13.2.2 Financial

13.2.3 Products/ Services Offered

13.2.4 SWOT Analysis

13.3 ANSYS, Inc.

13.3.1 Company Overview

13.3.2 Financial

13.3.3 Products/ Services Offered

13.3.4 SWOT Analysis

13.4 Autodesk Inc.

13.4.1 Company Overview

13.4.2 Financial

13.4.3 Products/ Services Offered

13.4.4 SWOT Analysis

13.5 Oracle Corporation

13.5.1 Company Overview

13.5.2 Financial

13.5.3 Products/ Services Offered

13.5.4 SWOT Analysis

13.6 Accenture plc

13.6.1 Company Overview

13.6.2 Financial

13.6.3 Products/ Services Offered

13.6.4 SWOT Analysis

13.7 Hitachi Ltd.

13.7.1 Company Overview

13.7.2 Financial

13.7.3 Products/ Services Offered

13.7.4 SWOT Analysis

13.8 AVEVA Group plc

13.8.1 Company Overview

13.8.2 Financial

13.8.3 Products/ Services Offered

13.8.4 SWOT Analysis

13.9 SAP SE

13.9.1 Company Overview

13.9.2 Financial

13.9.3 Products/ Services Offered

13.9.4 SWOT Analysis

13.10 Siemens AG

13.12.1 Company Overview

13.12.2 Financial

13.12.3 Products/ Services Offered

13.12.4 SWOT Analysis

14. Use Cases and Best Practices

15. Conclusion

An accurate research report requires proper strategizing as well as implementation. There are multiple factors involved in the completion of good and accurate research report and selecting the best methodology to compete the research is the toughest part. Since the research reports we provide play a crucial role in any company’s decision-making process, therefore we at SNS Insider always believe that we should choose the best method which gives us results closer to reality. This allows us to reach at a stage wherein we can provide our clients best and accurate investment to output ratio.

Each report that we prepare takes a timeframe of 350-400 business hours for production. Starting from the selection of titles through a couple of in-depth brain storming session to the final QC process before uploading our titles on our website we dedicate around 350 working hours. The titles are selected based on their current market cap and the foreseen CAGR and growth.


The 5 steps process:

Step 1: Secondary Research:

Secondary Research or Desk Research is as the name suggests is a research process wherein, we collect data through the readily available information. In this process we use various paid and unpaid databases which our team has access to and gather data through the same. This includes examining of listed companies’ annual reports, Journals, SEC filling etc. Apart from this our team has access to various associations across the globe across different industries. Lastly, we have exchange relationships with various university as well as individual libraries.

Secondary Research

Step 2: Primary Research

When we talk about primary research, it is a type of study in which the researchers collect relevant data samples directly, rather than relying on previously collected data.  This type of research is focused on gaining content specific facts that can be sued to solve specific problems. Since the collected data is fresh and first hand therefore it makes the study more accurate and genuine.

We at SNS Insider have divided Primary Research into 2 parts.

Part 1 wherein we interview the KOLs of major players as well as the upcoming ones across various geographic regions. This allows us to have their view over the market scenario and acts as an important tool to come closer to the accurate market numbers. As many as 45 paid and unpaid primary interviews are taken from both the demand and supply side of the industry to make sure we land at an accurate judgement and analysis of the market.

This step involves the triangulation of data wherein our team analyses the interview transcripts, online survey responses and observation of on filed participants. The below mentioned chart should give a better understanding of the part 1 of the primary interview.

Primary Research

Part 2: In this part of primary research the data collected via secondary research and the part 1 of the primary research is validated with the interviews from individual consultants and subject matter experts.

Consultants are those set of people who have at least 12 years of experience and expertise within the industry whereas Subject Matter Experts are those with at least 15 years of experience behind their back within the same space. The data with the help of two main processes i.e., FGDs (Focused Group Discussions) and IDs (Individual Discussions). This gives us a 3rd party nonbiased primary view of the market scenario making it a more dependable one while collation of the data pointers.

Step 3: Data Bank Validation

Once all the information is collected via primary and secondary sources, we run that information for data validation. At our intelligence centre our research heads track a lot of information related to the market which includes the quarterly reports, the daily stock prices, and other relevant information. Our data bank server gets updated every fortnight and that is how the information which we collected using our primary and secondary information is revalidated in real time.

Data Bank Validation

Step 4: QA/QC Process

After all the data collection and validation our team does a final level of quality check and quality assurance to get rid of any unwanted or undesired mistakes. This might include but not limited to getting rid of the any typos, duplication of numbers or missing of any important information. The people involved in this process include technical content writers, research heads and graphics people. Once this process is completed the title gets uploader on our platform for our clients to read it.

Step 5: Final QC/QA Process:

This is the last process and comes when the client has ordered the study. In this process a final QA/QC is done before the study is emailed to the client. Since we believe in giving our clients a good experience of our research studies, therefore, to make sure that we do not lack at our end in any way humanly possible we do a final round of quality check and then dispatch the study to the client.

Key Segments:

By Solution

  • Component

  • Process

  • System

By Enterprise Size

  • Large Enterprises

  • Small and Medium Enterprises (SMEs)

By Deployment

  • Cloud

  • On-premise

By Application

  • Product Design & Development

  • Predictive Maintenance

  • Business Optimization

  • Others

By End-use

  • Manufacturing

  • Agriculture

  • Automotive & Transport

  • Energy & Utilities

  • Healthcare & Life Sciences

  • Residential & Commercial

  • Retail & Consumer Goods

  • Aerospace

  • Telecommunication

  • Others

Request for Segment Customization as per your Business Requirement: Segment Customization Request

REGIONAL COVERAGE:

North America

  • US

  • Canada

  • Mexico

Europe

  • Eastern Europe

    • Poland

    • Romania

    • Hungary

    • Turkey

    • Rest of Eastern Europe

  • Western Europe

    • Germany

    • France

    • UK

    • Italy

    • Spain

    • Netherlands

    • Switzerland

    • Austria

    • Rest of Western Europe

Asia Pacific

  • China

  • India

  • Japan

  • South Korea

  • Vietnam

  • Singapore

  • Australia

  • Rest of Asia Pacific

Middle East & Africa

  • Middle East

    • UAE

    • Egypt

    • Saudi Arabia

    • Qatar

    • Rest of the Middle East

  • Africa

    • Nigeria

    • South Africa

    • Rest of Africa

Latin America

  • Brazil

  • Argentina

  • Colombia

Request for Country Level Research Report: Country Level Customization Request

Available Customization

With the given market data, SNS Insider offers customization as per the company’s specific needs. The following customization options are available for the report:

  • Product Analysis

  • Criss-Cross segment analysis (e.g. Product X Application)

  • Product Matrix which gives a detailed comparison of product portfolio of each company

  • Geographic Analysis

  • Additional countries in any of the regions

  • Company Information

  • Detailed analysis and profiling of additional market players (Up to five)


  •            5000 (33% Discount)


  •            8950 (40% Discount)


  •            3050 (23% Discount)

Start a Conversation

Hi! Click one of our member below to chat on Phone