Get more information on Digital Signature Market - Request Free Sample Report
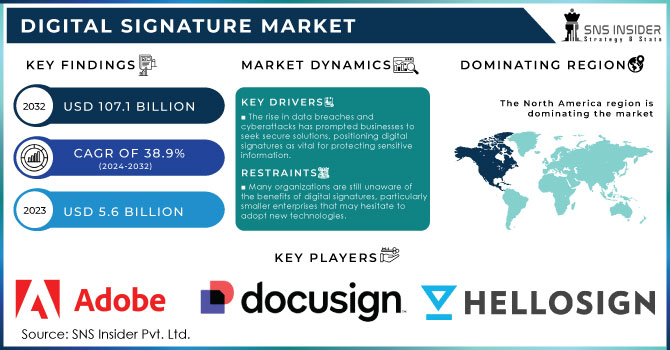
Digital Signature Market size was valued at USD 5.6 Billion in 2023 and is expected to grow to USD 107.1 Billion by 2032 and grow at a CAGR of 38.9 % over the forecast period of 2024-2032.
The digital signature market is driven by growing government initiatives focusing on digitalization, and abiding by legal regulations. Governments across the globe have introduced regulations that demand the use of secure digital signature solutions to reduce fraud, streamline processes, and increase transparency. For instance, the European Union eIDAS Regulation was introduced, which includes a clear legal framework for electronic signature and trust services in Europe. Furthermore, the U.S. government’s passing of the Electronic Signatures in Global and National Commerce Act, alongside the Uniform Electronic Transactions Act also gives digital signatures the same legal stand as handwritten ones in the country. The U.S. Department of Commerce 2023 report stipulates that by 2026, digital transactions will have risen by 35% due to the adoption of secure digital signatures both in the government and private sector. Correspondingly, the Indian government has been pushing for the adoption of digital signatures through its Digital India initiative, and in 2023, the government was reporting a year-on-year increase of 40% in the number of digitally signed documents. These regulatory shifts and growing security concerns continue to drive the digital signature market.
The market is also characterized by opportunities to introduce technologies such as blockchain, which enhances the security and efficiency of signing processes. In addition, the adoption of cloud-based solutions offers scalability and flexibility with regard to the market segments that can be served. The application of digital signatures continues to grow, with the increasing number of e-commerce platforms and remote working. As more countries establish legal frameworks that recognize digital signatures, global expansion becomes feasible. Furthermore, the drive to adopt paperless transactions trends in many industries continues to drive the market.
Divers
The rise in data breaches and cyberattacks has prompted businesses to seek secure solutions, positioning digital signatures as vital for protecting sensitive information.
The transition to cloud computing allows businesses to easily implement digital signatures, enhancing flexibility and accessibility while maintaining security.
Legislative frameworks like the ESIGN Act and similar laws worldwide legitimize digital signatures, encouraging widespread adoption across various sectors.
The major driver of the growth of the digital signature market is the increase of security concerns. Nowadays, as organizations are intensively digitalizing their activity, the number of cyber-attacks is becoming more acute. For example, in the recent 2022 study, it was reported that the average data breach cost $4.35 million. So, this financial stroke together with the threats to the reputation of the company motivates companies to look for a more secure way of managing hearing documents. Digital signature brings more security as it guarantees the authenticity and integrity of electronic documents. For this purpose, they use encryption which makes it almost impossible for unauthorized persons to make any changes to signed documents. In addition, as it was reported in the Cybersecurity report, Adobe Sign company possesses information that companies that used their digital signing service filed 50% fewer fraud claims compared to the companies that sought traditional paper signatures. Moreover, in light of such regulatory frameworks as GDPR, companies are forced to apply secure ways of document signing. All these factors together may lead to the assumption that the digital signature market will increase. As organizations become more aware of the potential threats and the benefits of secure signing solutions, the demand for digital signatures is expected to grow significantly.
Restraints:
Many organizations are still unaware of the benefits of digital signatures, particularly smaller enterprises that may hesitate to adopt new technologies.
Companies with established legacy systems may find it challenging to integrate digital signatures, leading to disruptions and reluctance to change.
One significant restraint for the digital signature market is regulatory compliance challenges. Many of these organizations are challenged by the complexity of such compliance. The laws in different jurisdictions that regulate digital signatures are different. For example, the Electronic Signatures in Global and National Commerce Act governs signature laws in the US, whereas the countries in the European Union adhere to eIDAS. This regulation has some stringent requirements for electronic signatures. The findings recent survey show that 54% of companies consider compliance as the main obstacle to digital transformation, including the implementation of digital signatures. These challenges can lead to hesitation among businesses to adopt digital signature solutions, as the potential for legal repercussions creates a barrier to entry
By Component
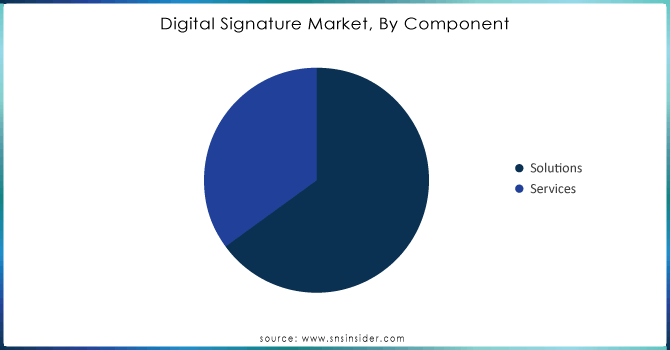
In 2023, the solutions segment accounted for the largest revenue share, 64%, in the digital signature market. This segment’s leadership is associated with a steadily increasing demand for tools for secure and compliant signing with the law and the requirements of a particular region. Over the years, digital signing tools have become critical to organizations that want to handle their transactions, contract signing, and document management digitally. One of the other significant growth drivers is the contribution of governments. According to data published by the European Commission, 85% of the public sector entities and organizations in EU member states have implemented or updated their tools for signing to comply with the eIDAS regulation. This trend likely has a global context, meaning that both big businesses and governments invest in advanced studies. Solutions are expected to remain the segment with the highest share of revenues as more organizations realize the contemporary need for enhanced security and compliance.
Get Customized Report as per your Business Requirement - Request For Customized Report
By Level
In 2023, the Advanced Electronic Signatures segment dominated the market. AES solutions offer superior security features, including cryptographic algorithms that cannot be tampered with, and are compliant with a range of international regulations, including eIDAS in Europe and the E-SIGN Act in the United States. Various organizations handling secure and regulated data, such as health, finance, and government facilities, are increasingly purchasing AES. The 2023 ETSI report on the Digital Signature Market in Europe demonstrated that 78% of surveyed organizations selected AES when implementing a digital signature because of its compliance with strong European data protection rules: GDPR, and the NIST report on digital signature solutions in the United States in 2023 stated that only AES provides higher assurance than a simple electronic signature. Therefore, since the regulatory landscape in the EU, the U.S., and other countries is likely to continue increasing, the AES segment is poised to expand further.
By Industry Vertical
The Banking, Financial Services, and Insurance, or BFSI sector, accounted for the largest share of 27% in the digital signature market. This is because this industry is highly regulated providers of financial services have to comply with strict requirements related to customer authentication, fraud prevention, and sensitive data protection. Therefore, the adoption of electronic signatures has become a response to this industry’s need for secure and well-regulated processes for performing transactions, approving loans, and filing documents with different authorities. Therefore, according to the 2023 report made by The Federal Reserve, 70% of U.S. banks used digital signature solutions to comply with the financial requirements and enhance the client experience. In addition, according to The Reserve Bank of India, the usage of electronic signatures for KYC purposes has increased by 60% in 2023, and this was another factor influencing the above-share percentage of BFSI. The requirements for processes to be secure, compliant, and timely will continue to drive the usage of digital signatures in this field.
Regional Analysis
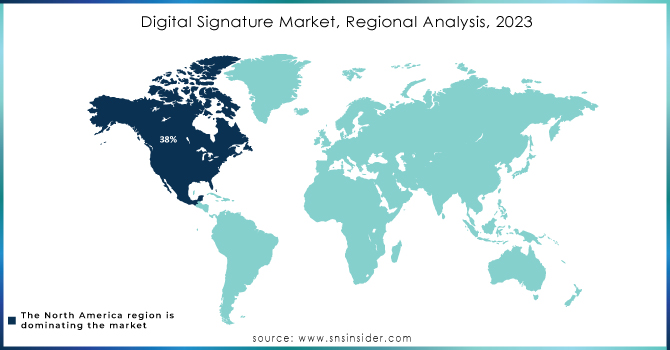
In 2023, North America dominated the digital signature market and held 38% of the market share. This was primarily a result of the early adoption of digital signatures as well as a strong regulatory framework limiting the use of standard digital signatures. In the U.S., the E-SIGN Act together with UETA enforces the adoption of digital signatures in government, businesses, and individuals. On the other hand, in Canada, the Personal Information Protection and Electronic Documents Act established a similar environment favoring the growth of the digital signature market. Moreover, the high receptiveness of digital technologies in various markets including BFSI, healthcare, real estate, and government services creation contributed to this growth. A 2023 report by the U.S. Department of Commerce indicates that North America recorded an approximately 30% increase in using digital signatures in various industrial sectors, reflecting the growing demand for secure digital transactions.
However, the Asia-Pacific region has the highest CAGR. China, India, and Japan were the leading countries in the market accounting for approximately 24% of the market. The growing governments’ and citizens’ adoption of electronic digital signature solutions as part of their digitalization strategies fueled this growth. For example, in India, the Ministry of Communications presented a 40% increase in digitally signed documents in 2023, whereas, In China, the Ministry of Industry and Information Technology announced a set of regulations demanding online sales and government services to utilize standard signatures. The rising adoption of digital services, combined with government support, is positioning Asia-Pacific as a key growth region for the digital signature market.
Key Players
Key Service Providers
DocuSign (DocuSign Agreement Cloud, DocuSign eSignature)
Adobe Systems (Adobe Sign, Adobe Document Cloud)
HelloSign (HelloSign API, HelloSign eSignature)
PandaDoc (PandaDoc eSign, PandaDoc Document Automation)
SignNow (SignNow eSignature, SignNow API)
eSignLive by VASCO (eSignLive, eSignLive API)
OneSpan (OneSpan Sign, OneSpan Identity Verification)
SignEasy (SignEasy for iOS, SignEasy for Android)
RightSignature (RightSignature Document Management, RightSignature API)
CybSafe (CybSafe Digital Signature, CybSafe Compliance)
Key Users of Digital Signature Services
JPMorgan Chase (Digital Document Management, eSigning Solutions)
HSBC (HSBC Digital Banking, eSignatures for Transactions)
Wells Fargo (Wells Fargo Digital Documents, eSigning Services)
Morgan Stanley (Morgan Stanley Client Agreements, Digital Signatures)
CitiBank (CitiBank E-Signature Services, Digital Banking Solutions)
American Express (American Express Digital Accounts, eSigning Features)
Allianz (Allianz Digital Insurance, eSignatures for Policies)
Deloitte (Deloitte Digital Solutions, E-signature Integration)
Pfizer (Pfizer Clinical Trials, Electronic Signatures for Approvals)
Boeing (Boeing Digital Document Management, eSigning for Contracts) and others
Recent Developments
In May 2023, The U.S. National Institute of Standards and Technology reviewed guidelines for digital signatures and released them as a part of the Digital Identity Guidelines to enhance the security standards of AES and QES. Consequently, the NIST guidelines will be used for enhancing security in data transactions for the numerous amounts of federal and private sector entities.
In February 2023, Zoho upgraded a Zoho Sign product for ISVs and OEMs to enable them to include digital signature functionality in other products. Thus, the Zoho Sign application will obtain strong APIs, mobile SDKs, SSO authentication, and fully customized branding features.
In January 2023, DocuSign and TechnoBind established a cooperation to introduce eSignature technology in India, supporting the Digital India rescue. Hence, the agreement process will be facilitated by the embedded eSignature, contract life cycle management, and document generation tools.
Report Attributes | Details |
---|---|
Market Size in 2023 |
USD 5.6 Billion |
Market Size by 2032 |
USD 107.1 Billion |
CAGR | CAGR of 38.9% From 2024 to 2032 |
Base Year | 2023 |
Forecast Period | 2024-2032 |
Historical Data | 2020-2022 |
Report Scope & Coverage | Market Size, Segments Analysis, Competitive Landscape, Regional Analysis, DROC & SWOT Analysis, Forecast Outlook |
Key Segments | • By Component (Solutions, Services) • By Deployment Model (On-premises and Cloud) • By End-user (Individuals, Businesses, Organizations) • By Industry Vertical (BFSI, Health Care & Life Science, IT & Telecom, Government, Retail, Others) • By Level (Advanced Electronic Signatures (AES), Qualified Electronic Signatures (QES)) |
Regional Analysis/Coverage | North America (US, Canada, Mexico), Europe (Eastern Europe [Poland, Romania, Hungary, Turkey, Rest of Eastern Europe] Western Europe] Germany, France, UK, Italy, Spain, Netherlands, Switzerland, Austria, Rest of Western Europe]), Asia Pacific (China, India, Japan, South Korea, Vietnam, Singapore, Australia, Rest of Asia Pacific), Middle East & Africa (Middle East [UAE, Egypt, Saudi Arabia, Qatar, Rest of Middle East], Africa [Nigeria, South Africa, Rest of Africa], Latin America (Brazil, Argentina, Colombia Rest of Latin America) |
Company Profiles |
DocuSign, Adobe Systems, HelloSign, PandaDoc, SignNow, eSignLive by VASCO, OneSpan, SignEasy, RightSignature, CybSafe |
KEY DRIVERS | •The rise in data breaches and cyberattacks has prompted businesses to seek secure solutions, positioning digital signatures as vital for protecting sensitive information •The transition to cloud computing allows businesses to easily implement digital signatures, enhancing flexibility and accessibility while maintaining security •Legislative frameworks like the ESIGN Act and similar laws worldwide legitimize digital signatures, encouraging widespread adoption across various sectors. |
Restraints | •Many organizations are still unaware of the benefits of digital signatures, particularly smaller enterprises that may hesitate to adopt new technologies •Companies with established legacy systems may find it challenging to integrate digital signatures, leading to disruptions and reluctance to change |
Ans: - The Digital Signature market size is estimated to reach USD 89.01 Billion by 2031.
Ans: - Enhancement of the entire client experience and enhanced security through a streamlined and seamless approach.
Ans: - The Digital Signature Market is to grow at a CAGR of 36.7% over the forecast period 2024-2031.
Ans: - The major key players are Adobe., Identrust inc., Ascertia, DocuSign, inc., Entrust corporation, Thales group, Lexmark international, inc., Rpost., Secured signing limited, Vasco data security international, inc. sectors.
Ans: - Key Stakeholders Considered in the study are Raw material vendors, Regulatory authorities, including government agencies and NGOs, Commercial research, and development (R&D) institutions, Importers and exporters, etc.
Table of Contents:
1. Introduction
1.1 Market Definition
1.2 Scope (Inclusion and Exclusions)
1.3 Research Assumptions
2. Executive Summary
2.1 Market Overview
2.2 Regional Synopsis
2.3 Competitive Summary
3. Research Methodology
3.1 Top-Down Approach
3.2 Bottom-up Approach
3.3. Data Validation
3.4 Primary Interviews
4. Market Dynamics Impact Analysis
4.1 Market Driving Factors Analysis
4.1.1 Drivers
4.1.2 Restraints
4.1.3 Opportunities
4.1.4 Challenges
4.2 PESTLE Analysis
4.3 Porter’s Five Forces Model
5. Statistical Insights and Trends Reporting
5.1 Adoption Rates of Emerging Technologies
5.2 Network Infrastructure Expansion, by Region
5.3 Cybersecurity Incidents, by Region (2020-2023)
5.4 Cloud Services Usage, by Region
6. Competitive Landscape
6.1 List of Major Companies, By Region
6.2 Market Share Analysis, By Region
6.3 Product Benchmarking
6.3.1 Product specifications and features
6.3.2 Pricing
6.4 Strategic Initiatives
6.4.1 Marketing and promotional activities
6.4.2 Distribution and supply chain strategies
6.4.3 Expansion plans and new product launches
6.4.4 Strategic partnerships and collaborations
6.5 Technological Advancements
6.6 Market Positioning and Branding
7. Digital Signature Market Segmentation, By Component
7.1 Chapter Overview
7.2 Solutions
7.2.1 Solutions Market Trends Analysis (2020-2032)
7.2.2 Solutions Market Size Estimates And Forecasts To 2032 (USD Billion)
7.3 Service
7.3.1 Service Market Trends Analysis (2020-2032)
7.3.2 Service Deposition Market Size Estimates And Forecasts To 2032 (USD Billion)
8. Digital Signature Market Segmentation, By Deployment Mode
8.1 Chapter Overview
8.2 Cloud
8.2.1 Cloud Market Trends Analysis (2020-2032)
8.2.2 Cloud Market Size Estimates And Forecasts To 2032 (USD Billion)
8.3 On-premise
8.3.1 On-premise Market Trends Analysis (2020-2032)
8.3.2 On-premise Market Size Estimates And Forecasts To 2032 (USD Billion)
9. Digital Signature Market Segmentation, By End-user
9.1 Chapter Overview
9.2 Individuals
9.2.1 Individuals Market Trends Analysis (2020-2032)
9.2.2 Individuals Market Size Estimates And Forecasts To 2032 (USD Billion)
9.3 Businesses
9.3.1 Businesses Market Trends Analysis (2020-2032)
9.3.2 Businesses Market Size Estimates And Forecasts To 2032 (USD Billion)
9.4 Organizations
9.4.1 Organizations Market Trends Analysis (2020-2032)
9.4.2 Organizations Market Size Estimates And Forecasts To 2032 (USD Billion)
10. Digital Signature Market Segmentation, By Level
10.1 Chapter Overview
10.2 Advanced Electronic Signatures (AES)
10.2.1 Advanced Electronic Signatures (AES) Market Trends Analysis (2020-2032)
10.2.2 Advanced Electronic Signatures (AES) Market Size Estimates And Forecasts To 2032 (USD Billion)
10.3 Qualified Electronic Signatures (QES)
10.3.1 Qualified Electronic Signatures (QES) Market Trends Analysis (2020-2032)
10.3.2 Qualified Electronic Signatures (QES) Market Size Estimates And Forecasts To 2032 (USD Billion)
11. Digital Signature Market Segmentation, By Industry Vertical
11.1 Chapter Overview
11.2 BFSI
11.2.1 BFSI Market Trends Analysis (2020-2032)
11.2.2 BFSI Market Size Estimates And Forecasts To 2032 (USD Billion)
11.3 Retail
11.3.1 Retail Market Trends Analysis (2020-2032)
11.3.2 Retail Market Size Estimates And Forecasts To 2032 (USD Billion)
11.4 Health Care & Life Science
11.4.1 Health Care & Life Science Market Trends Analysis (2020-2032)
11.4.2 Health Care & Life Science Market Size Estimates And Forecasts To 2032 (USD Billion)
11.5 IT & Telecom
11.5.1 IT & Telecom Market Trends Analysis (2020-2032)
11.5.2 IT & Telecom Market Size Estimates And Forecasts To 2032 (USD Billion)
11.6 Government
11.6.1 Government Market Trends Analysis (2020-2032)
11.6.2 Government Market Size Estimates And Forecasts To 2032 (USD Billion)
11.7 Others
11.7.1 Others Market Trends Analysis (2020-2032)
11.7.2 Others Market Size Estimates And Forecasts To 2032 (USD Billion)
12. Regional Analysis
12.1 Chapter Overview
12.2 North America
12.2.1 Trends Analysis
12.2.2 North America Digital Signature Market Estimates And Forecasts, By Country (2020-2032) (USD Billion)
12.2.3 North America Digital Signature Market Estimates And Forecasts, By Component (2020-2032) (USD Billion)
12.2.4 North America Digital Signature Market Estimates And Forecasts, By Deployment Mode (2020-2032) (USD Billion)
12.2.5 North America Digital Signature Market Estimates And Forecasts, By End-user (2020-2032) (USD Billion)
12.2.6 North America Digital Signature Market Estimates And Forecasts, By Level (2020-2032) (USD Billion)
12.2.7 North America Digital Signature Market Estimates And Forecasts, By Industry Vertical (2020-2032) (USD Billion)
12.2.8 USA
12.2.8.1 USA Digital Signature Market Estimates And Forecasts, By Component (2020-2032) (USD Billion)
12.2.8.2 USA Digital Signature Market Estimates And Forecasts, By Deployment Mode (2020-2032) (USD Billion)
12.2.8.3 USA Digital Signature Market Estimates And Forecasts, By End-user (2020-2032) (USD Billion)
12.2.8.4 USA Digital Signature Market Estimates And Forecasts, By Level (2020-2032) (USD Billion)
12.2.8.5 USA Digital Signature Market Estimates And Forecasts, By Industry Vertical (2020-2032) (USD Billion)
12.2.9 Canada
12.2.9.1 Canada Digital Signature Market Estimates And Forecasts, By Component (2020-2032) (USD Billion)
12.2.9.2 Canada Digital Signature Market Estimates And Forecasts, By Deployment Mode (2020-2032) (USD Billion)
12.2.9.3 Canada Digital Signature Market Estimates And Forecasts, By End-user (2020-2032) (USD Billion)
12.2.9.4 Canada Digital Signature Market Estimates And Forecasts, By Level (2020-2032) (USD Billion)
12.2.9.5 Canada Digital Signature Market Estimates And Forecasts, By Industry Vertical (2020-2032) (USD Billion)
12.2.10 Mexico
12.2.10.1 Mexico Digital Signature Market Estimates And Forecasts, By Component (2020-2032) (USD Billion)
12.2.10.2 Mexico Digital Signature Market Estimates And Forecasts, By Deployment Mode (2020-2032) (USD Billion)
12.2.10.3 Mexico Digital Signature Market Estimates And Forecasts, By End-user (2020-2032) (USD Billion)
12.2.10.4 Mexico Digital Signature Market Estimates And Forecasts, By Level (2020-2032) (USD Billion)
12.2.10.5 Mexico Digital Signature Market Estimates And Forecasts, By Industry Vertical (2020-2032) (USD Billion)
12.3 Europe
12.3.1 Eastern Europe
12.3.1.1 Trends Analysis
12.3.1.2 Eastern Europe Digital Signature Market Estimates And Forecasts, By Country (2020-2032) (USD Billion)
12.3.1.3 Eastern Europe Digital Signature Market Estimates And Forecasts, By Component (2020-2032) (USD Billion)
12.3.1.4 Eastern Europe Digital Signature Market Estimates And Forecasts, By Deployment Mode (2020-2032) (USD Billion)
12.3.1.5 Eastern Europe Digital Signature Market Estimates And Forecasts, By End-user (2020-2032) (USD Billion)
12.3.1.6 Eastern Europe Digital Signature Market Estimates And Forecasts, By Level (2020-2032) (USD Billion)
12.3.1.7 Eastern Europe Digital Signature Market Estimates And Forecasts, By Industry Vertical (2020-2032) (USD Billion)
12.3.1.8 Poland
12.3.1.8.1 Poland Digital Signature Market Estimates And Forecasts, By Component (2020-2032) (USD Billion)
12.3.1.8.2 Poland Digital Signature Market Estimates And Forecasts, By Deployment Mode (2020-2032) (USD Billion)
12.3.1.8.3 Poland Digital Signature Market Estimates And Forecasts, By End-user (2020-2032) (USD Billion)
12.3.1.8.4 Poland Digital Signature Market Estimates And Forecasts, By Level (2020-2032) (USD Billion)
12.3.1.8.5 Poland Digital Signature Market Estimates And Forecasts, By Industry Vertical (2020-2032) (USD Billion)
12.3.1.9 Romania
12.3.1.9.1 Romania Digital Signature Market Estimates And Forecasts, By Component (2020-2032) (USD Billion)
12.3.1.9.2 Romania Digital Signature Market Estimates And Forecasts, By Deployment Mode (2020-2032) (USD Billion)
12.3.1.9.3 Romania Digital Signature Market Estimates And Forecasts, By End-user (2020-2032) (USD Billion)
12.3.1.9.4 Romania Digital Signature Market Estimates And Forecasts, By Level (2020-2032) (USD Billion)
12.3.1.9.5 Romania Digital Signature Market Estimates And Forecasts, By Industry Vertical (2020-2032) (USD Billion)
12.3.1.10 Hungary
12.3.1.10.1 Hungary Digital Signature Market Estimates And Forecasts, By Component (2020-2032) (USD Billion)
12.3.1.10.2 Hungary Digital Signature Market Estimates And Forecasts, By Deployment Mode (2020-2032) (USD Billion)
12.3.1.10.3 Hungary Digital Signature Market Estimates And Forecasts, By End-user (2020-2032) (USD Billion)
12.3.1.10.4 Hungary Digital Signature Market Estimates And Forecasts, By Level (2020-2032) (USD Billion)
12.3.1.10.5 Hungary Digital Signature Market Estimates And Forecasts, By Industry Vertical (2020-2032) (USD Billion)
12.3.1.11 Turkey
12.3.1.11.1 Turkey Digital Signature Market Estimates And Forecasts, By Component (2020-2032) (USD Billion)
12.3.1.11.2 Turkey Digital Signature Market Estimates And Forecasts, By Deployment Mode (2020-2032) (USD Billion)
12.3.1.11.3 Turkey Digital Signature Market Estimates And Forecasts, By End-user (2020-2032) (USD Billion)
12.3.1.11.4 Turkey Digital Signature Market Estimates And Forecasts, By Level (2020-2032) (USD Billion)
12.3.1.11.5 Turkey Digital Signature Market Estimates And Forecasts, By Industry Vertical (2020-2032) (USD Billion)
12.3.1.12 Rest Of Eastern Europe
12.3.1.12.1 Rest Of Eastern Europe Digital Signature Market Estimates And Forecasts, By Component (2020-2032) (USD Billion)
12.3.1.12.2 Rest Of Eastern Europe Digital Signature Market Estimates And Forecasts, By Deployment Mode (2020-2032) (USD Billion)
12.3.1.12.3 Rest Of Eastern Europe Digital Signature Market Estimates And Forecasts, By End-user (2020-2032) (USD Billion)
12.3.1.12.4 Rest Of Eastern Europe Digital Signature Market Estimates And Forecasts, By Level (2020-2032) (USD Billion)
12.3.1.12.5 Rest Of Eastern Europe Digital Signature Market Estimates And Forecasts, By Industry Vertical (2020-2032) (USD Billion)
12.3.2 Western Europe
12.3.2.1 Trends Analysis
12.3.2.2 Western Europe Digital Signature Market Estimates And Forecasts, By Country (2020-2032) (USD Billion)
12.3.2.3 Western Europe Digital Signature Market Estimates And Forecasts, By Component (2020-2032) (USD Billion)
12.3.2.4 Western Europe Digital Signature Market Estimates And Forecasts, By Deployment Mode (2020-2032) (USD Billion)
12.3.2.5 Western Europe Digital Signature Market Estimates And Forecasts, By End-user (2020-2032) (USD Billion)
12.3.2.6 Western Europe Digital Signature Market Estimates And Forecasts, By Level (2020-2032) (USD Billion)
12.3.2.7 Western Europe Digital Signature Market Estimates And Forecasts, By Industry Vertical (2020-2032) (USD Billion)
12.3.2.8 Germany
12.3.2.8.1 Germany Digital Signature Market Estimates And Forecasts, By Component (2020-2032) (USD Billion)
12.3.2.8.2 Germany Digital Signature Market Estimates And Forecasts, By Deployment Mode (2020-2032) (USD Billion)
12.3.2.8.3 Germany Digital Signature Market Estimates And Forecasts, By End-user (2020-2032) (USD Billion)
12.3.2.8.4 Germany Digital Signature Market Estimates And Forecasts, By Level (2020-2032) (USD Billion)
12.3.2.8.5 Germany Digital Signature Market Estimates And Forecasts, By Industry Vertical (2020-2032) (USD Billion)
12.3.2.9 France
12.3.2.9.1 France Digital Signature Market Estimates And Forecasts, By Component (2020-2032) (USD Billion)
12.3.2.9.2 France Digital Signature Market Estimates And Forecasts, By Deployment Mode (2020-2032) (USD Billion)
12.3.2.9.3 France Digital Signature Market Estimates And Forecasts, By End-user (2020-2032) (USD Billion)
12.3.2.9.4 France Digital Signature Market Estimates And Forecasts, By Level (2020-2032) (USD Billion)
12.3.2.9.5 France Digital Signature Market Estimates And Forecasts, By Industry Vertical (2020-2032) (USD Billion)
12.3.2.10 UK
12.3.2.10.1 UK Digital Signature Market Estimates And Forecasts, By Component (2020-2032) (USD Billion)
12.3.2.10.2 UK Digital Signature Market Estimates And Forecasts, By Deployment Mode (2020-2032) (USD Billion)
12.3.2.10.3 UK Digital Signature Market Estimates And Forecasts, By End-user (2020-2032) (USD Billion)
12.3.2.10.4 UK Digital Signature Market Estimates And Forecasts, By Level (2020-2032) (USD Billion)
12.3.2.10.5 UK Digital Signature Market Estimates And Forecasts, By Industry Vertical (2020-2032) (USD Billion)
12.3.2.11 Italy
12.3.2.11.1 Italy Digital Signature Market Estimates And Forecasts, By Component (2020-2032) (USD Billion)
12.3.2.11.2 Italy Digital Signature Market Estimates And Forecasts, By Deployment Mode (2020-2032) (USD Billion)
12.3.2.11.3 Italy Digital Signature Market Estimates And Forecasts, By End-user (2020-2032) (USD Billion)
12.3.2.11.4 Italy Digital Signature Market Estimates And Forecasts, By Level (2020-2032) (USD Billion)
12.3.2.11.5 Italy Digital Signature Market Estimates And Forecasts, By Industry Vertical (2020-2032) (USD Billion)
12.3.2.12 Spain
12.3.2.12.1 Spain Digital Signature Market Estimates And Forecasts, By Component (2020-2032) (USD Billion)
12.3.2.12.2 Spain Digital Signature Market Estimates And Forecasts, By Deployment Mode (2020-2032) (USD Billion)
12.3.2.12.3 Spain Digital Signature Market Estimates And Forecasts, By End-user (2020-2032) (USD Billion)
12.3.2.12.4 Spain Digital Signature Market Estimates And Forecasts, By Level (2020-2032) (USD Billion)
12.3.2.12.5 Spain Digital Signature Market Estimates And Forecasts, By Industry Vertical (2020-2032) (USD Billion)
12.3.2.13 Netherlands
12.3.2.13.1 Netherlands Digital Signature Market Estimates And Forecasts, By Component (2020-2032) (USD Billion)
12.3.2.13.2 Netherlands Digital Signature Market Estimates And Forecasts, By Deployment Mode (2020-2032) (USD Billion)
12.3.2.13.3 Netherlands Digital Signature Market Estimates And Forecasts, By End-user (2020-2032) (USD Billion)
12.3.2.13.4 Netherlands Digital Signature Market Estimates And Forecasts, By Level (2020-2032) (USD Billion)
12.3.2.13.5 Netherlands Digital Signature Market Estimates And Forecasts, By Industry Vertical (2020-2032) (USD Billion)
12.3.2.14 Switzerland
12.3.2.14.1 Switzerland Digital Signature Market Estimates And Forecasts, By Component (2020-2032) (USD Billion)
12.3.2.14.2 Switzerland Digital Signature Market Estimates And Forecasts, By Deployment Mode (2020-2032) (USD Billion)
12.3.2.14.3 Switzerland Digital Signature Market Estimates And Forecasts, By End-user (2020-2032) (USD Billion)
12.3.2.14.4 Switzerland Digital Signature Market Estimates And Forecasts, By Level (2020-2032) (USD Billion)
12.3.2.12.5 Switzerland Digital Signature Market Estimates And Forecasts, By Industry Vertical (2020-2032) (USD Billion)
12.3.2.15 Austria
12.3.2.15.1 Austria Digital Signature Market Estimates And Forecasts, By Component (2020-2032) (USD Billion)
12.3.2.15.2 Austria Digital Signature Market Estimates And Forecasts, By Deployment Mode (2020-2032) (USD Billion)
12.3.2.15.3 Austria Digital Signature Market Estimates And Forecasts, By End-user (2020-2032) (USD Billion)
12.3.2.15.4 Austria Digital Signature Market Estimates And Forecasts, By Level (2020-2032) (USD Billion)
12.3.2.15.5 Austria Digital Signature Market Estimates And Forecasts, By Industry Vertical (2020-2032) (USD Billion)
12.3.2.16 Rest Of Western Europe
12.3.2.16.1 Rest Of Western Europe Digital Signature Market Estimates And Forecasts, By Component (2020-2032) (USD Billion)
12.3.2.16.2 Rest Of Western Europe Digital Signature Market Estimates And Forecasts, By Deployment Mode (2020-2032) (USD Billion)
12.3.2.16.3 Rest Of Western Europe Digital Signature Market Estimates And Forecasts, By End-user (2020-2032) (USD Billion)
12.3.2.16.4 Rest Of Western Europe Digital Signature Market Estimates And Forecasts, By Level (2020-2032) (USD Billion)
12.3.2.16.5 Rest Of Western Europe Digital Signature Market Estimates And Forecasts, By Industry Vertical (2020-2032) (USD Billion)
12.4 Asia Pacific
12.4.1 Trends Analysis
12.4.2 Asia Pacific Digital Signature Market Estimates And Forecasts, By Country (2020-2032) (USD Billion)
12.4.3 Asia Pacific Digital Signature Market Estimates And Forecasts, By Component (2020-2032) (USD Billion)
12.4.4 Asia Pacific Digital Signature Market Estimates And Forecasts, By Deployment Mode (2020-2032) (USD Billion)
12.4.5 Asia Pacific Digital Signature Market Estimates And Forecasts, By End-user (2020-2032) (USD Billion)
12.4.6 Asia Pacific Digital Signature Market Estimates And Forecasts, By Level (2020-2032) (USD Billion)
12.4.7 Asia Pacific Digital Signature Market Estimates And Forecasts, By Industry Vertical (2020-2032) (USD Billion)
12.4.8 China
12.4.8.1 China Digital Signature Market Estimates And Forecasts, By Component (2020-2032) (USD Billion)
12.4.8.2 China Digital Signature Market Estimates And Forecasts, By Deployment Mode (2020-2032) (USD Billion)
12.4.8.3 China Digital Signature Market Estimates And Forecasts, By End-user (2020-2032) (USD Billion)
12.4.8.4 China Digital Signature Market Estimates And Forecasts, By Level (2020-2032) (USD Billion)
12.4.8.5 China Digital Signature Market Estimates And Forecasts, By Industry Vertical (2020-2032) (USD Billion)
12.4.9 India
12.4.9.1 India Digital Signature Market Estimates And Forecasts, By Component (2020-2032) (USD Billion)
12.4.9.2 India Digital Signature Market Estimates And Forecasts, By Deployment Mode (2020-2032) (USD Billion)
12.4.9.3 India Digital Signature Market Estimates And Forecasts, By End-user (2020-2032) (USD Billion)
12.4.9.4 India Digital Signature Market Estimates And Forecasts, By Level (2020-2032) (USD Billion)
12.4.9.5 India Digital Signature Market Estimates And Forecasts, By Industry Vertical (2020-2032) (USD Billion)
12.4.10 Japan
12.4.10.1 Japan Digital Signature Market Estimates And Forecasts, By Component (2020-2032) (USD Billion)
12.4.10.2 Japan Digital Signature Market Estimates And Forecasts, By Deployment Mode (2020-2032) (USD Billion)
12.4.10.3 Japan Digital Signature Market Estimates And Forecasts, By End-user (2020-2032) (USD Billion)
12.4.10.4 Japan Digital Signature Market Estimates And Forecasts, By Level (2020-2032) (USD Billion)
12.4.10.5 Japan Digital Signature Market Estimates And Forecasts, By Industry Vertical (2020-2032) (USD Billion)
12.4.11 South Korea
12.4.11.1 South Korea Digital Signature Market Estimates And Forecasts, By Component (2020-2032) (USD Billion)
12.4.11.2 South Korea Digital Signature Market Estimates And Forecasts, By Deployment Mode (2020-2032) (USD Billion)
12.4.11.3 South Korea Digital Signature Market Estimates And Forecasts, By End-user (2020-2032) (USD Billion)
12.4.11.4 South Korea Digital Signature Market Estimates And Forecasts, By Level (2020-2032) (USD Billion)
12.4.11.5 South Korea Digital Signature Market Estimates And Forecasts, By Industry Vertical (2020-2032) (USD Billion)
12.4.12 Vietnam
12.4.12.1 Vietnam Digital Signature Market Estimates And Forecasts, By Component (2020-2032) (USD Billion)
12.4.12.2 Vietnam Digital Signature Market Estimates And Forecasts, By Deployment Mode (2020-2032) (USD Billion)
12.4.12.3 Vietnam Digital Signature Market Estimates And Forecasts, By End-user (2020-2032) (USD Billion)
12.4.12.4 Vietnam Digital Signature Market Estimates And Forecasts, By Level (2020-2032) (USD Billion)
12.4.12.5 Vietnam Digital Signature Market Estimates And Forecasts, By Industry Vertical (2020-2032) (USD Billion)
12.4.13 Singapore
12.4.13.1 Singapore Digital Signature Market Estimates And Forecasts, By Component (2020-2032) (USD Billion)
12.4.13.2 Singapore Digital Signature Market Estimates And Forecasts, By Deployment Mode (2020-2032) (USD Billion)
12.4.13.3 Singapore Digital Signature Market Estimates And Forecasts, By End-user (2020-2032) (USD Billion)
12.4.13.4 Singapore Digital Signature Market Estimates And Forecasts, By Level (2020-2032) (USD Billion)
12.4.13.5 Singapore Digital Signature Market Estimates And Forecasts, By Industry Vertical (2020-2032) (USD Billion)
12.4.14 Australia
12.4.14.1 Australia Digital Signature Market Estimates And Forecasts, By Component (2020-2032) (USD Billion)
12.4.14.2 Australia Digital Signature Market Estimates And Forecasts, By Deployment Mode (2020-2032) (USD Billion)
12.4.14.3 Australia Digital Signature Market Estimates And Forecasts, By End-user (2020-2032) (USD Billion)
12.4.14.4 Australia Digital Signature Market Estimates And Forecasts, By Level (2020-2032) (USD Billion)
12.4.14.5 Australia Digital Signature Market Estimates And Forecasts, By Industry Vertical (2020-2032) (USD Billion)
12.4.15 Rest Of Asia Pacific
12.4.15.1 Rest Of Asia Pacific Digital Signature Market Estimates And Forecasts, By Component (2020-2032) (USD Billion)
12.4.15.2 Rest Of Asia Pacific Digital Signature Market Estimates And Forecasts, By Deployment Mode (2020-2032) (USD Billion)
12.4.15.3 Rest Of Asia Pacific Digital Signature Market Estimates And Forecasts, By End-user (2020-2032) (USD Billion)
12.4.15.4 Rest Of Asia Pacific Digital Signature Market Estimates And Forecasts, By Level (2020-2032) (USD Billion)
12.4.15.5 Rest Of Asia Pacific Digital Signature Market Estimates And Forecasts, By Industry Vertical (2020-2032) (USD Billion)
12.5 Middle East And Africa
12.5.1 Middle East
12.5.1.1 Trends Analysis
12.5.1.2 Middle East Digital Signature Market Estimates And Forecasts, By Country (2020-2032) (USD Billion)
12.5.1.3 Middle East Digital Signature Market Estimates And Forecasts, By Component (2020-2032) (USD Billion)
12.5.1.4 Middle East Digital Signature Market Estimates And Forecasts, By Deployment Mode (2020-2032) (USD Billion)
12.5.1.5 Middle East Digital Signature Market Estimates And Forecasts, By End-user (2020-2032) (USD Billion)
12.5.1.6 Middle East Digital Signature Market Estimates And Forecasts, By Level (2020-2032) (USD Billion)
12.5.1.7 Middle East Digital Signature Market Estimates And Forecasts, By Industry Vertical (2020-2032) (USD Billion)
12.5.1.8 UAE
12.5.1.8.1 UAE Digital Signature Market Estimates And Forecasts, By Component (2020-2032) (USD Billion)
12.5.1.8.2 UAE Digital Signature Market Estimates And Forecasts, By Deployment Mode (2020-2032) (USD Billion)
12.5.1.8.3 UAE Digital Signature Market Estimates And Forecasts, By End-user (2020-2032) (USD Billion)
12.5.1.8.4 UAE Digital Signature Market Estimates And Forecasts, By Level (2020-2032) (USD Billion)
12.5.1.8.5 UAE Digital Signature Market Estimates And Forecasts, By Industry Vertical (2020-2032) (USD Billion)
12.5.1.9 Egypt
12.5.1.9.1 Egypt Digital Signature Market Estimates And Forecasts, By Component (2020-2032) (USD Billion)
12.5.1.9.2 Egypt Digital Signature Market Estimates And Forecasts, By Deployment Mode (2020-2032) (USD Billion)
12.5.1.9.3 Egypt Digital Signature Market Estimates And Forecasts, By End-user (2020-2032) (USD Billion)
12.5.1.9.4 Egypt Digital Signature Market Estimates And Forecasts, By Level (2020-2032) (USD Billion)
12.5.1.9.5 Egypt Digital Signature Market Estimates And Forecasts, By Industry Vertical (2020-2032) (USD Billion)
12.5.1.10 Saudi Arabia
12.5.1.10.1 Saudi Arabia Digital Signature Market Estimates And Forecasts, By Component (2020-2032) (USD Billion)
12.5.1.10.2 Saudi Arabia Digital Signature Market Estimates And Forecasts, By Deployment Mode (2020-2032) (USD Billion)
12.5.1.10.3 Saudi Arabia Digital Signature Market Estimates And Forecasts, By End-user (2020-2032) (USD Billion)
12.5.1.10.4 Saudi Arabia Digital Signature Market Estimates And Forecasts, By Level (2020-2032) (USD Billion)
12.5.1.10.5 Saudi Arabia Digital Signature Market Estimates And Forecasts, By Industry Vertical (2020-2032) (USD Billion)
12.5.1.11 Qatar
12.5.1.11.1 Qatar Digital Signature Market Estimates And Forecasts, By Component (2020-2032) (USD Billion)
12.5.1.11.2 Qatar Digital Signature Market Estimates And Forecasts, By Deployment Mode (2020-2032) (USD Billion)
12.5.1.11.3 Qatar Digital Signature Market Estimates And Forecasts, By End-user (2020-2032) (USD Billion)
12.5.1.11.4 Qatar Digital Signature Market Estimates And Forecasts, By Level (2020-2032) (USD Billion)
12.5.1.11.5 Qatar Digital Signature Market Estimates And Forecasts, By Industry Vertical (2020-2032) (USD Billion)
12.5.1.12 Rest Of Middle East
12.5.1.12.1 Rest Of Middle East Digital Signature Market Estimates And Forecasts, By Component (2020-2032) (USD Billion)
12.5.1.12.2 Rest Of Middle East Digital Signature Market Estimates And Forecasts, By Deployment Mode (2020-2032) (USD Billion)
12.5.1.12.3 Rest Of Middle East Digital Signature Market Estimates And Forecasts, By End-user (2020-2032) (USD Billion)
12.5.1.12.4 Rest Of Middle East Digital Signature Market Estimates And Forecasts, By Level (2020-2032) (USD Billion)
12.5.1.12.5 Rest Of Middle East Digital Signature Market Estimates And Forecasts, By Industry Vertical (2020-2032) (USD Billion)
12.5.2 Africa
12.5.2.1 Trends Analysis
12.5.2.2 Africa Digital Signature Market Estimates And Forecasts, By Country (2020-2032) (USD Billion)
12.5.2.3 Africa Digital Signature Market Estimates And Forecasts, By Component (2020-2032) (USD Billion)
12.5.2.4 Africa Digital Signature Market Estimates And Forecasts, By Deployment Mode (2020-2032) (USD Billion)
12.5.2.5 Africa Digital Signature Market Estimates And Forecasts, By End-user (2020-2032) (USD Billion)
12.5.2.6 Africa Digital Signature Market Estimates And Forecasts, By Level (2020-2032) (USD Billion)
12.5.2.7 Africa Digital Signature Market Estimates And Forecasts, By Industry Vertical (2020-2032) (USD Billion)
12.5.2.8 South Africa
12.5.2.8.1 South Africa Digital Signature Market Estimates And Forecasts, By Component (2020-2032) (USD Billion)
12.5.2.8.2 South Africa Digital Signature Market Estimates And Forecasts, By Deployment Mode (2020-2032) (USD Billion)
12.5.2.8.3 South Africa Digital Signature Market Estimates And Forecasts, By End-user (2020-2032) (USD Billion)
12.5.2.8.4 South Africa Digital Signature Market Estimates And Forecasts, By Level (2020-2032) (USD Billion)
12.5.2.8.5 South Africa Digital Signature Market Estimates And Forecasts, By Industry Vertical (2020-2032) (USD Billion)
12.5.2.9 Nigeria
12.5.2.9.1 Nigeria Digital Signature Market Estimates And Forecasts, By Component (2020-2032) (USD Billion)
12.5.2.9.2 Nigeria Digital Signature Market Estimates And Forecasts, By Deployment Mode (2020-2032) (USD Billion)
12.5.2.9.3 Nigeria Digital Signature Market Estimates And Forecasts, By End-user (2020-2032) (USD Billion)
12.5.2.9.4 Nigeria Digital Signature Market Estimates And Forecasts, By Level (2020-2032) (USD Billion)
12.5.2.9.5 Nigeria Digital Signature Market Estimates And Forecasts, By Industry Vertical (2020-2032) (USD Billion)
12.5.2.10 Rest Of Africa
12.5.2.10.1 Rest Of Africa Digital Signature Market Estimates And Forecasts, By Component (2020-2032) (USD Billion)
12.5.2.10.2 Rest Of Africa Digital Signature Market Estimates And Forecasts, By Deployment Mode (2020-2032) (USD Billion)
12.5.2.10.3 Rest Of Africa Digital Signature Market Estimates And Forecasts, By End-user (2020-2032) (USD Billion)
12.5.2.10.4 Rest Of Africa Digital Signature Market Estimates And Forecasts, By Level (2020-2032) (USD Billion)
12.5.2.10.5 Rest Of Africa Digital Signature Market Estimates And Forecasts, By Industry Vertical (2020-2032) (USD Billion)
12.6 Latin America
12.6.1 Trends Analysis
12.6.2 Latin America Digital Signature Market Estimates And Forecasts, By Country (2020-2032) (USD Billion)
12.6.3 Latin America Digital Signature Market Estimates And Forecasts, By Component (2020-2032) (USD Billion)
12.6.4 Latin America Digital Signature Market Estimates And Forecasts, By Deployment Mode (2020-2032) (USD Billion)
12.6.5 Latin America Digital Signature Market Estimates And Forecasts, By End-user (2020-2032) (USD Billion)
12.6.6 Latin America Digital Signature Market Estimates And Forecasts, By Level (2020-2032) (USD Billion)
12.6.7 Latin America Digital Signature Market Estimates And Forecasts, By Industry Vertical (2020-2032) (USD Billion)
12.6.8 Brazil
12.6.8.1 Brazil Digital Signature Market Estimates And Forecasts, By Component (2020-2032) (USD Billion)
12.6.8.2 Brazil Digital Signature Market Estimates And Forecasts, By Deployment Mode (2020-2032) (USD Billion)
12.6.8.3 Brazil Digital Signature Market Estimates And Forecasts, By End-user (2020-2032) (USD Billion)
12.6.8.4 Brazil Digital Signature Market Estimates And Forecasts, By Level (2020-2032) (USD Billion)
12.6.8.5 Brazil Digital Signature Market Estimates And Forecasts, By Industry Vertical (2020-2032) (USD Billion)
12.6.9 Argentina
12.6.9.1 Argentina Digital Signature Market Estimates And Forecasts, By Component (2020-2032) (USD Billion)
12.6.9.2 Argentina Digital Signature Market Estimates And Forecasts, By Deployment Mode (2020-2032) (USD Billion)
12.6.9.3 Argentina Digital Signature Market Estimates And Forecasts, By End-user (2020-2032) (USD Billion)
12.6.9.4 Argentina Digital Signature Market Estimates And Forecasts, By Level (2020-2032) (USD Billion)
12.6.9.5 Argentina Digital Signature Market Estimates And Forecasts, By Industry Vertical (2020-2032) (USD Billion)
12.6.10 Colombia
12.6.10.1 Colombia Digital Signature Market Estimates And Forecasts, By Component (2020-2032) (USD Billion)
12.6.10.2 Colombia Digital Signature Market Estimates And Forecasts, By Deployment Mode (2020-2032) (USD Billion)
12.6.10.3 Colombia Digital Signature Market Estimates And Forecasts, By End-user (2020-2032) (USD Billion)
12.6.10.4 Colombia Digital Signature Market Estimates And Forecasts, By Level (2020-2032) (USD Billion)
12.6.10.5 Colombia Digital Signature Market Estimates And Forecasts, By Industry Vertical (2020-2032) (USD Billion)
12.6.11 Rest Of Latin America
12.6.11.1 Rest Of Latin America Digital Signature Market Estimates And Forecasts, By Component (2020-2032) (USD Billion)
12.6.11.2 Rest Of Latin America Digital Signature Market Estimates And Forecasts, By Deployment Mode (2020-2032) (USD Billion)
12.6.11.3 Rest Of Latin America Digital Signature Market Estimates And Forecasts, By End-user (2020-2032) (USD Billion)
12.6.11.4 Rest Of Latin America Digital Signature Market Estimates And Forecasts, By Level (2020-2032) (USD Billion)
12.6.11.5 Rest Of Latin America Digital Signature Market Estimates And Forecasts, By Industry Vertical (2020-2032) (USD Billion)
13. Company Profiles
13.1 DocuSign
13.1.1 Company Overview
13.1.2 Financial
13.1.3 Products/ Services Offered
13.1.4 SWOT Analysis
13.2 Adobe Systems
13.2.1 Company Overview
13.2.2 Financial
13.2.3 Products/ Services Offered
13.2.4 SWOT Analysis
13.3 HelloSign
13.3.1 Company Overview
13.3.2 Financial
13.3.3 Products/ Services Offered
13.3.4 SWOT Analysis
13.4 PandaDoc
13.4.1 Company Overview
13.4.2 Financial
13.4.3 Products/ Services Offered
13.4.4 SWOT Analysis
13.5 SignNow
13.5.1 Company Overview
13.5.2 Financial
13.5.3 Products/ Services Offered
13.5.4 SWOT Analysis
13.6 eSignLive by VASCO
13.6.1 Company Overview
13.6.2 Financial
13.6.3 Products/ Services Offered
13.6.4 SWOT Analysis
13.7 OneSpan
13.7.1 Company Overview
13.7.2 Financial
13.7.3 Products/ Services Offered
13.7.4 SWOT Analysis
13.8 SignEasy
13.8.1 Company Overview
13.8.2 Financial
13.8.3 Products/ Services Offered
13.8.4 SWOT Analysis
13.9 RightSignature
13.9.1 Company Overview
13.9.2 Financial
13.9.3 Products/ Services Offered
13.9.4 SWOT Analysis
13.10 CybSafe
13.12.1 Company Overview
13.12.2 Financial
13.12.3 Products/ Services Offered
13.12.4 SWOT Analysis
14. Use Cases and Best Practices
15. Conclusion
An accurate research report requires proper strategizing as well as implementation. There are multiple factors involved in the completion of good and accurate research report and selecting the best methodology to compete the research is the toughest part. Since the research reports we provide play a crucial role in any company’s decision-making process, therefore we at SNS Insider always believe that we should choose the best method which gives us results closer to reality. This allows us to reach at a stage wherein we can provide our clients best and accurate investment to output ratio.
Each report that we prepare takes a timeframe of 350-400 business hours for production. Starting from the selection of titles through a couple of in-depth brain storming session to the final QC process before uploading our titles on our website we dedicate around 350 working hours. The titles are selected based on their current market cap and the foreseen CAGR and growth.
The 5 steps process:
Step 1: Secondary Research:
Secondary Research or Desk Research is as the name suggests is a research process wherein, we collect data through the readily available information. In this process we use various paid and unpaid databases which our team has access to and gather data through the same. This includes examining of listed companies’ annual reports, Journals, SEC filling etc. Apart from this our team has access to various associations across the globe across different industries. Lastly, we have exchange relationships with various university as well as individual libraries.
Step 2: Primary Research
When we talk about primary research, it is a type of study in which the researchers collect relevant data samples directly, rather than relying on previously collected data. This type of research is focused on gaining content specific facts that can be sued to solve specific problems. Since the collected data is fresh and first hand therefore it makes the study more accurate and genuine.
We at SNS Insider have divided Primary Research into 2 parts.
Part 1 wherein we interview the KOLs of major players as well as the upcoming ones across various geographic regions. This allows us to have their view over the market scenario and acts as an important tool to come closer to the accurate market numbers. As many as 45 paid and unpaid primary interviews are taken from both the demand and supply side of the industry to make sure we land at an accurate judgement and analysis of the market.
This step involves the triangulation of data wherein our team analyses the interview transcripts, online survey responses and observation of on filed participants. The below mentioned chart should give a better understanding of the part 1 of the primary interview.
Part 2: In this part of primary research the data collected via secondary research and the part 1 of the primary research is validated with the interviews from individual consultants and subject matter experts.
Consultants are those set of people who have at least 12 years of experience and expertise within the industry whereas Subject Matter Experts are those with at least 15 years of experience behind their back within the same space. The data with the help of two main processes i.e., FGDs (Focused Group Discussions) and IDs (Individual Discussions). This gives us a 3rd party nonbiased primary view of the market scenario making it a more dependable one while collation of the data pointers.
Step 3: Data Bank Validation
Once all the information is collected via primary and secondary sources, we run that information for data validation. At our intelligence centre our research heads track a lot of information related to the market which includes the quarterly reports, the daily stock prices, and other relevant information. Our data bank server gets updated every fortnight and that is how the information which we collected using our primary and secondary information is revalidated in real time.
Step 4: QA/QC Process
After all the data collection and validation our team does a final level of quality check and quality assurance to get rid of any unwanted or undesired mistakes. This might include but not limited to getting rid of the any typos, duplication of numbers or missing of any important information. The people involved in this process include technical content writers, research heads and graphics people. Once this process is completed the title gets uploader on our platform for our clients to read it.
Step 5: Final QC/QA Process:
This is the last process and comes when the client has ordered the study. In this process a final QA/QC is done before the study is emailed to the client. Since we believe in giving our clients a good experience of our research studies, therefore, to make sure that we do not lack at our end in any way humanly possible we do a final round of quality check and then dispatch the study to the client.
Key Segments:
By Component
Solutions
Services
By Deployment Mode
Cloud
On-premise
By End-user
Individuals
Businesses
Organizations
By Level
Advanced Electronic Signatures (AES)
Qualified Electronic Signatures (QES)
By Industry Vertical
BFSI
Health Care & Life Science
IT & Telecom
Government
Retail
Others
Request for Segment Customization as per your Business Requirement: Segment Customization Request
REGIONAL COVERAGE:
North America
US
Canada
Mexico
Europe
Eastern Europe
Poland
Romania
Hungary
Turkey
Rest of Eastern Europe
Western Europe
Germany
France
UK
Italy
Spain
Netherlands
Switzerland
Austria
Rest of Western Europe
Asia Pacific
China
India
Japan
South Korea
Vietnam
Singapore
Australia
Rest of Asia Pacific
Middle East & Africa
Middle East
UAE
Egypt
Saudi Arabia
Qatar
Rest of the Middle East
Africa
Nigeria
South Africa
Rest of Africa
Latin America
Brazil
Argentina
Colombia
Request for Country Level Research Report: Country Level Customization Request
Available Customization
With the given market data, SNS Insider offers customization as per the company’s specific needs. The following customization options are available for the report:
Product Analysis
Criss-Cross segment analysis (e.g. Product X Application)
Product Matrix which gives a detailed comparison of product portfolio of each company
Geographic Analysis
Additional countries in any of the regions
Company Information
Detailed analysis and profiling of additional market players (Up to five)
The Cloud Access Security Broker Market size was USD 8.13 billion in 2023 and is expected to reach USD 35.78 billion by 2032 and grow at a CAGR of 17.9% over the forecast period of 2024-2032.
The Extended Reality (XR) Market size was valued at USD 136.9 Billion in 2023 and is expected to grow to USD 1733.5 Billion by 2032 and grow at a CAGR of 32.6 % over the forecast period of 2024-2032.
The AI Image Generator Market size was USD 328.4 Million in 2023 and will reach to USD 1399.5 Million by 2032 and grow at a CAGR of 17.5% by 2024-2032.
Communication Platform-as-a-Service (CPaaS) Market size was valued at USD 15.6 billion in 2023 and is expected to grow to USD 130.8 billion by 2031 and grow at a CAGR of 30.4 % over the forecast period of 2024-2031.
The global serverless architecture market, valued at USD 9.18 Billion in 2023, is projected to reach USD 53.42 Billion by 2032, growing at a compound annual growth rate (CAGR) of 22.94% during the forecast period.
The Video Management System Market size was valued at USD 13.02 Billion in 2023 and is estimated to reach USD 87.01 Billion in 2032 with a growing CAGR of 23.5% Over the Forecast Period of 2024-2032.
Hi! Click one of our member below to chat on Phone