To Get More Information on Digital Logistics Market - Request Sample Report
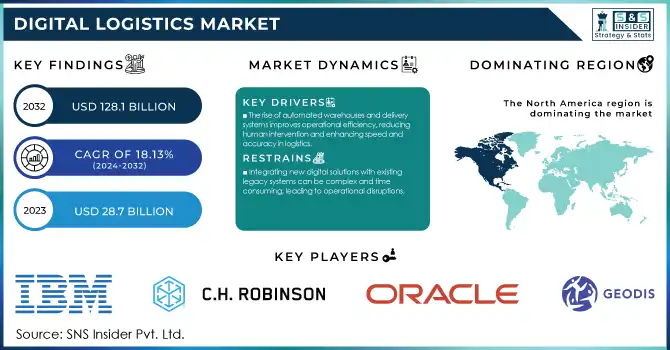
Digital Logistics Market size was USD 29.65 billion in 2023 and is expected to reach USD 160.1 billion by 2032 and grow at a CAGR of 20.6% over the forecast period of 2024-2032.
Digital logistics market is growing with the consistently increasing use of the Internet and the increasing demand for online shopping. The increasing trend in intelligent automation and generative AI also contributes significantly to this growth. As automation in logistics expands, there is a corresponding increase in cloud computing technologies, which fosters potential for market expansion. The rising need for digitalization, data analysis, and technological advancements drives this growth. Moreover, organizations are increasingly investing in new logistics technologies post-pandemic, further fueling market demand.
Generative AI is a valuable tool for logistics companies by enhancing operations and customer satisfaction. It automates traditional tasks and empowers businesses to operate on predictive and progressive models. Generative AI can transform logistics through various applications, such as warehouse management, labour management, and transport management. It enables logistics teams to improve real-time communications with AI-driven chatbots and virtual assistants. This advanced technology tackles labour-intensive tasks like report production and forecasting, setting high standards for productivity. With challenges in the supply chain on the rise, companies must improve decision-making speed and accuracy. Blue Yonder company that offered supply chain solutions, discovered Blue Yonder Orchestrator, an AI tool, designed to improve supply chain coordination and optimize intelligent decision-making, in December 2023. The utilization of real-time tracking and the Internet of Things (IoT) is significantly growing contributing to the growth of the market. Real-time monitoring improves visibility reduces the risk related to operation and enhances decision-making. The use of IoT in logistics enables the integration of different assets into the supply chain and facilitates data analysis, enhancing the efficiency of warehouse logistics, delivery management, and fleet management.
Projected growth in digital logistics solutions is attributed to technological progress and consistently growing demand of cloud services. in April 2022, Locus and Loconav make a strategic alliance with the aim of advancing digital transformation in the logistics industry through the automation of supply chain operations. Suttons International and LogChain started a digitalization collaboration after LogChain's success in enabling the world's initial completely digitalized cross-border delivery, In November 2023. This partnership highlights the dedication of both firms to improve digital transparency and scalability in the logistics industry.
Drivers
Growing demand for the digital logistics market by the proliferation of the internet and a significant increase in online shopping and growth of e-commerce.
Increasing automation and generative AI also substantially contribute to this growth of the market.
The growing use of IoT and real-time tracking additionally drive the marketplace.
The e-commerce industry has experienced substantial growth due to the increase in online transactions among internet users. In the last decade, this expansion necessitated speed-up and more effective delivery options. Online buyers anticipate precise orders, quick delivery, and easy return procedures. As a result, companies are working to decrease shipping expenses and shipment durations. E-commerce demands visibility, affordability, user-friendliness, fast delivery, and effective returns. To meet these demands, new models and technologies are being developed to automate distribution routes, digitize logistics planning, and streamline material movement. As a result, fulfilment services have become faster and more varied, especially for last-mile delivery and returns.
This growth has necessitated faster and green transportation services. Online shoppers expect correct orders, prompt shipping, and trouble-free process of return. E-commerce drives the want for visibility, value-effectiveness, ease of use, delivery velocity, and efficient returns. To meet these demands, new fashions and technology are being advanced to automate distribution routes, digitize logistics planning, and streamline cloth movement.
Restraints
The automation equipment needed for digitizing logistics operations required significant capital investment.
The complexity lies in integrating digital logistics with conventional systems.
Digitization of logistics operations, automation equipment, software, and solutions, which required significant initial costs. Replacing traditional procedures involves high expenses, and acquiring and integrating new technologies is costly. Furthermore, ongoing maintenance and upgrades demand additional capital investment. The complexity of integrating these technologies may require considerable resources, specialized expertise, and dedicated sources.
Industry Opportunity
Self-driving vehicles aim to transform logistics across the board, from trucks to last-mile robots, unlocking new levels of safety, efficiency, and quality. Digital logistics providers can use driverless technologies like platooning and autonomous highways to support driver health and safety. These vehicles can take on labour-intensive tasks, improving both indoor and outdoor logistics operations. Many companies are accelerating the acceptance of fully driverless vehicles. For instance, Google and Tesla have achieved notable progress in this area. Tesla, a top electric vehicle producer, is developing fully autonomous heavy-duty freight vehicles. Likewise, corporations such as Amazon and UPS are allocating resources toward creating aerial drones for streamlining delivery operations.
By Function
Transportation Management
The transportation management segment held the highest market share of more than 38% in 2023. Digitalizing transport management is crucial in this industry for enhancing supply chain operations, as it combines technology, data analysis, and automation. By impacting efficiency, expenses, and velocity, businesses can enhance their overall supply chain performance. The consistently increasing globalization and e-commerce results in increased demand for transportation, emphasizing the importance of digital logistics solutions for efficient management and provide delivery on-time.
The labour-management segment is expected to experience the highest compound annual growth rate 20.9%, During the projected period of forecast. Labor management vendors are increasingly incorporating web and mobile interfaces along with customizable dashboards to improve accessibility of information. Thus, the gamification feature expands upon this and shows the current performance levels of individual users. Gamification, a popular strategy in labour management, offers immediate feedback on user performance by providing information that allows users to modify their performance during the labour process.
The warehouse management system (WMS) segment is anticipated to acquire a significant market share. Technological advancements in the digital market and the rising adoption of cloud solutions are expected to drive demand for digital logistics solutions. For instance, Sinopec's Anhui province branch and JD.com agreed to work together on supply chain services and improve omnichannel operations In March 2022. This partnership includes product and digital supply chains, shared warehouse facilities, and smart logistics, with JD leveraging its technology and supply chain services to help Sinopec Anhui boost productivity and reduce costs.
Advancements in sensors and IoT analytics are expected to attract logistics vendors to invest in digital solutions. IoT in logistics can streamline product storage and ensure efficient warehouse management. Modern technology, such as RFID tags and sensors, allows for monitoring the status and location of inventory items, while warehouse automation minimizes human errors by enabling processes as needed
By components
Solution
Asset Management
Warehouse Management
Data Management and Analytics
Network Management
Tracking and Monitoring System
Security
Services
Planning and Consulting Services
Deployment and Integration Services
Support and Maintenance
By Deployment mode
Cloud
On-premises
On-premises segment accounted for more than 71% of revenue share and dominated the market in 2023. The on-premises strategy enables users to monitor their logistics processes through desktops or other systems from their company's premises, and also give them complete control and administrative access.
The cloud sector is expected to experience the highest growth rate of 20.8% in the forecast period. Cloud-based logistics management models improve an organization's backup capabilities and offer increased flexibility and resilience. The increase in this sector is driven by the growth of online shopping and various methods of delivering orders. Organizations are moving from on-premises systems to cloud delivery models due to the growing use of SaaS and cloud solutions in digital logistics.
By Organization size
Large Enterprises
SMEs
By Vertical
Retail and eCommerce
Manufacturing
Pharmaceuticals and Healthcare
Aerospace and Defence
Automotive
Energy and Utilities
Others
In 2023, the manufacturing segment held the largest revenue share of more than 28%. Digital logistics play a major role in modern production by ensuring the timely arrival of raw materials, which allows businesses to accurately forecast inventory levels. The insights gained from this data aid in making informed decisions regarding production, purchasing, and sales.
The healthcare industry is expected to have a significant annual growth rate 20.75% in the upcoming period. The solutions of Digital logistics support the monitoring of equipment and supplies, leading to increased efficiency, compliance maintenance, and decreased time of healthcare professionals spend on inventory checks. With advancements in technology, in the future, the healthcare sector can expect to see even greater efficiency and a more patient-centric approach.
Do You Need any Customization Research on Digital Logistics Market - Enquire Now
Regional Analysis
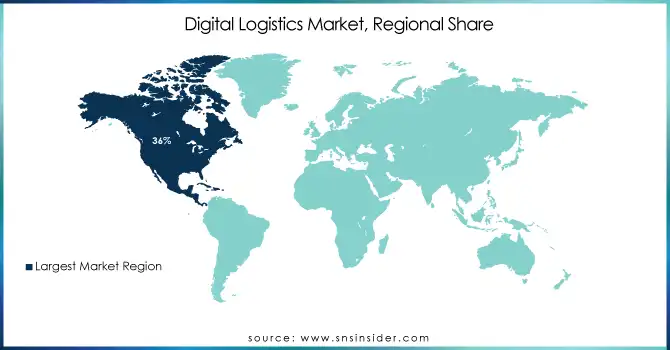
North America region held the largest market share in the digital logistics market and accounted more than 37.5 % of the Revenue share. This growth is driven by the presence of large IT companies that are early adopters of digital technologies. The region benefits from a highly skilled workforce and numerous academic and research institutions specializing in automation R&D, continuously contributing to market innovations. Developed economies like the US and Canada heavily invest in advanced digital logistics solutions, bolstered by their robust commercial transportation and logistics sectors. Regulatory developments such as Compliance, Safety, and Accountability (CSA) and Hours of Service Solution (HOS) revisions also fuel market growth, with retail, utilities, and services being the fastest-growing verticals.
Meanwhile, the Asia-Pacific region is expected to experience the highest growth rate, driven by technological adoption in countries like China and India. In China, the logistics sector is embracing digital technologies to enhance efficiency, with initiatives such as the directive to create a unified domestic market and the promotion of digital platforms for third-party logistics. Full Truck Alliance Co Ltd exemplifies efforts to enhance logistical efficiency using digital technology. India's national logistics policy intends to lower logistics costs and improve the global competitiveness of local merchandise. This policy consists of capabilities including the Unified Logistics Interface Platform and is consistent with national campaigns which includes Make in India and Digital India, with the purpose of revolutionizing the logistics zone.
North America
USA
Canada
Mexico
Europe
Eastern Europe
Poland
Romania
Hungary
Turkey
Rest of Eastern Europe
Western Europe
Germany
France
UK
Italy
Spain
Netherlands
Switzerland
Austria
Rest of Western Europe
Asia Pacific
China
India
Japan
South Korea
Vietnam
Singapore
Australia
Rest of Asia Pacific
Middle East & Africa
Middle East
UAE
Egypt
Saudi Arabia
Qatar
Rest of the Middle East
Africa
Nigeria
South Africa
Rest of Africa
Latin America
Brazil
Argentina
Colombia
Rest of Latin America
The major players in the Digital Logistics Market are Huawei Technologies Co., Ltd, IBM, Honeywell, Oracle Corporation, SAP, Intel, HCL Technologies, Blue Yonder, HCL Technologies Limited, AT&T, Cloud Logistics, Infosys, Eurotech S.P.A, ORBCOMM, Freightgate, WebXpress, Logisuite, ICAT Logistics, Magaya, Hexaware, Tech Mahindra, Advantech and other players in Final Report..
Amazon: In June 2023, Amazon announced that it would be investing $1.2 billion in its logistics network in the United States. The investment will be used to build new warehouses and distribution centers, as well as to improve the efficiency of its existing network.
UPS: In May 2023, UPS announced that it would be acquiring TForce Freight, a leading provider of less-than-truckload (LTL) services. The acquisition will give UPS a stronger presence in the LTL market, which is a growing segment of the logistics industry.
August 2023, a Memorandum of Understanding (MoU) was signed between SGTraDex and the shipping lines OOCL, PIL, and ONE. This MoU, an extension of the Digital Collaboration for Logistics Innovation MoU with partners such as PSA Corporation Ltd, CargoERP, Innosys, Keyfields, Haulio, CDAS, SLA, and STA, aims to create a data-driven logistics ecosystem. It focuses on promoting digital solutions and data connectivity among key land logistics players and industry solution providers through SGTraDex.
In October 2023, UPS revealed a plan to purchase Happy Returns, a reverse logistics firm recognized for its no-box, no-label return offering to customers and businesses. This takeover aims to improve UPS's digital logistics offerings.
Blue Yonder and Seedcom enhanced Seedcom Logistics warehouse capabilities in August 2023 by effectively installing the Blue Yonder Warehouse Management System (WMS).
Report Attributes | Details |
Market Size in 2023 | US$ 29.65 Bn |
Market Size by 2032 | US$ 160.1 Bn |
CAGR | CAGR of 20.6% From 2024 to 2032 |
Base Year | 2023 |
Forecast Period | 2024-2032 |
Historical Data | 2020-2022 |
Report Scope & Coverage | Market Size, Segments Analysis, Competitive Landscape, Regional Analysis, DROC & SWOT Analysis, Forecast Outlook |
Key Segments | • By Component • By Function • By Organization Size • By Deployment Mode • By Vertical |
Regional Analysis/Coverage | North America (US, Canada, Mexico), Europe (Eastern Europe [Poland, Romania, Hungary, Turkey, Rest of Eastern Europe] Western Europe] Germany, France, UK, Italy, Spain, Netherlands, Switzerland, Austria, Rest of Western Europe]), Asia Pacific (China, India, Japan, South Korea, Vietnam, Singapore, Australia, Rest of Asia Pacific), Middle East & Africa (Middle East [UAE, Egypt, Saudi Arabia, Qatar, Rest of Middle East], Africa [Nigeria, South Africa, Rest of Africa], Latin America (Brazil, Argentina, Colombia Rest of Latin America) |
Company Profiles | Huawei Technologies Co., Ltd, IBM, Honeywell, Oracle Corporation, SAP, Intel, HCL Technologies, Blue Yonder, AT&T, Cloud Logistics, Infosys, Eurotech S.P.A, ORBCOMM, Freightgate, WebXpress, Logisuite, ICAT Logistics, Magaya, Hexaware, Tech Mahindra, Advantech |
Key Drivers | • Growing demand for the digital logistics market by the proliferation of the internet and a significant increase in online shopping and growth of e-commerce. • Increasing automation and generative AI also substantially contribute to this growth of the market. |
Market Restraints | • The automation equipment needed for digitizing logistics operations required significant capital investment. • The complexity lies in integrating digital logistics with conventional systems. |
Ans. The projected market size for the Digital Logistics Market is USD 160.1 billion by 2032.
Ans. The CAGR of the Digital Logistics Market is 20.6% During the forecast period of 2024-2032.
Ans: The manufacturing vertical segment dominated the Digital Logistics Market.
Ans: The Asia Pacific region is expected to grow with the highest CAGR during the forecast period of 2024-2032.
Ans:
The automation equipment needed for digitizing logistics operations required significant capital investment.
The complexity lies in integrating digital logistics with conventional systems.
TABLE OF CONTENTS
1. Introduction
1.1 Market Definition
1.2 Scope
1.3 Research Assumptions
2. Industry Flowchart
3. Research Methodology
4. Market Dynamics
4.1 Drivers
4.2 Restraints
4.3 Opportunities
4.4 Challenges
5. Porter’s 5 Forces Model
6. Pest Analysis
7. Digital Logistics Market Segmentation, By Function
7.1 Introduction
7.2 Warehouse Management
7.3 Transportation Management
7.4 Workforce Management
8. Digital Logistics Market Segmentation, By Components
8.1 Introduction
8.2 Solution
8.2.1 Asset Management
8.2.2 Warehouse Management
8.2.3 Data Management and Analytics
8.2.4 Network Management
8.2.5 Tracking and Monitoring System
8.2.6 Security
8.2.7 Fleet Management System
8.3 Services
8.3.1 Planning and Consulting Services
8.3.2 Deployment and Integration Services
8.3.3 Support and Maintenance
9. Digital Logistics Market Segmentation, By Deployment Mode
9.1 Introduction
9.2 Cloud
9.3 On-premises
10. Digital Logistics Market Segmentation, By Organization Size
10.1 Introduction
10.2 Large Enterprises
10.3 SMEs
11. Digital Logistics Market Segmentation, By Vertical
11.1 Introduction
11.2 Retail and eCommerce
11.3 Manufacturing
11.4 Pharmaceuticals and Healthcare
11.5 Aerospace and Defence
11.6 Automotive
11.7 Energy and Utilities
11.8 Others
12. Regional Analysis
12.1 Introduction
12.2 North America
12.2.1 Trend Analysis
12.2.2 North America Digital Logistics Market By Country
12.2.3 North America Digital Logistics Market By Function
12.2.4 North America Digital Logistics Market By Components
12.2.5 North America Digital Logistics Market By Deployment mode
12.2.6 North America Digital Logistics Market, By Organization size
12.2.7 North America Digital Logistics Market, By Vertical
12.2.8 USA
12.2.8.1 USA Digital Logistics Market By Function
12.2.8.2 USA Digital Logistics Market By Components
12.2.8.3 USA Digital Logistics Market By Deployment mode
12.2.8.4 USA Digital Logistics Market, By Organization size
12.2.8.5 USA Digital Logistics Market, By Vertical
12.2.9 Canada
12.2.9.1 Canada Digital Logistics Market By Function
12.2.9.2 Canada Digital Logistics Market By Components
12.2.9.3 Canada Digital Logistics Market By Deployment mode
12.2.9.4 Canada Digital Logistics Market, By Organization size
12.2.9.5 Canada Digital Logistics Market, By Vertical
12.2.10 Mexico
12.2.10.1 Mexico Digital Logistics Market By Function
12.2.10.2 Mexico Digital Logistics Market By Components
12.2.10.3 Mexico Digital Logistics Market By Deployment mode
12.2.10.4 Mexico Digital Logistics Market, By Organization size
12.2.10.5 Mexico Digital Logistics Market, By Vertical
12.3 Europe
12.3.1 Trend Analysis
12.3.2 Eastern Europe
12.3.2.1 Eastern Europe Digital Logistics Market By Country
12.3.2.2 Eastern Europe Digital Logistics Market By Function
12.3.2.3 Eastern Europe Digital Logistics Market By Components
12.3.2.4 Eastern Europe Digital Logistics Market By Deployment mode
12.3.2.5 Eastern Europe Digital Logistics Market By Organization size
12.3.2.6 Eastern Europe Digital Logistics Market, By Vertical
12.3.2.7 Poland
12.3.2.7.1 Poland Digital Logistics Market By Function
12.3.2.7.2 Poland Digital Logistics Market By Components
12.3.2.7.3 Poland Digital Logistics Market By Deployment mode
12.3.2.7.4 Poland Digital Logistics Market By Organization size
12.3.2.7.5 Poland Digital Logistics Market, By Vertical
12.3.2.8 Romania
12.3.2.8.1 Romania Digital Logistics Market By Function
12.3.2.8.2 Romania Digital Logistics Market By Components
12.3.2.8.3 Romania Digital Logistics Market By Deployment mode
12.3.2.8.4 Romania Digital Logistics Market By Organization size
12.3.2.8.5 Romania Digital Logistics Market, By Vertical
12.3.2.9 Hungary
12.3.2.9.1 Hungary Digital Logistics Market By Function
12.3.2.9.2 Hungary Digital Logistics Market By Components
12.3.2.9.3 Hungary Digital Logistics Market By Deployment mode
12.3.2.9.4 Hungary Digital Logistics Market By Organization size
12.3.2.9.5 Hungary Digital Logistics Market, By Vertical
12.3.2.10 Turkey
12.3.2.10.1 Turkey Digital Logistics Market By Function
12.3.2.10.2 Turkey Digital Logistics Market By Components
12.3.2.10.3 Turkey Digital Logistics Market By Deployment mode
12.3.2.10.4 Turkey Digital Logistics Market By Organization size
12.3.2.10.5 Turkey Digital Logistics Market, By Vertical
12.3.2.11 Rest of Eastern Europe
12.3.2.11.1 Rest of Eastern Europe Digital Logistics Market By Function
12.3.2.11.2 Rest of Eastern Europe Digital Logistics Market By Components
12.3.2.11.3 Rest of Eastern Europe Digital Logistics Market By Deployment mode
12.3.2.11.4 Rest of Eastern Europe Digital Logistics Market By Organization size
12.3.2.11.5 Rest of Eastern Europe Digital Logistics Market, By Vertical
12.3.3 Western Europe
12.3.3.1 Western Europe Digital Logistics Market By Country
12.3.3.2 Western Europe Digital Logistics Market By Function
12.3.3.3 Western Europe Digital Logistics Market By Components
12.3.3.4 Western Europe Digital Logistics Market By Deployment mode
12.3.3.5 Western Europe Digital Logistics Market By Organization size
12.3.3.6 Western Europe Digital Logistics Market, By Vertical
12.3.3.7 Germany
12.3.3.7.1 Germany Digital Logistics Market By Function
12.3.3.7.2 Germany Digital Logistics Market By Components
12.3.3.7.3 Germany Digital Logistics Market By Deployment mode
12.3.3.7.4 Germany Digital Logistics Market By Organization size
12.3.3.7.5 Germany Digital Logistics Market, By Vertical
12.3.3.8 France
12.3.3.8.1 France Digital Logistics Market By Function
12.3.3.8.2 France Digital Logistics Market By Components
12.3.3.8.3 France Digital Logistics Market By Deployment mode
12.3.3.8.4 France Digital Logistics Market By Organization size
12.3.3.8.5 France Digital Logistics Market, By Vertical
12.3.3.9 UK
12.3.3.9.1 UK Digital Logistics Market By Function
12.3.3.9.2 UK Digital Logistics Market By Components
12.3.3.9.3 UK Digital Logistics Market By Deployment mode
12.3.3.9.4 UK Digital Logistics Market By Organization size
12.3.3.9.5 UK Digital Logistics Market, By Vertical
12.3.3.10 Italy
12.3.3.10.1 Italy Digital Logistics Market By Function
12.3.3.10.2 Italy Digital Logistics Market By Components
12.3.3.10.3 Italy Digital Logistics Market By Deployment mode
12.3.3.10.4 Italy Digital Logistics Market By Organization size
12.3.3.10.5 Italy Digital Logistics Market, By Vertical
12.3.3.11 Spain
12.3.3.11.1 Spain Digital Logistics Market By Function
12.3.3.11.2 Spain Digital Logistics Market By Components
12.3.3.11.3 Spain Digital Logistics Market By Deployment mode
12.3.3.11.4 Spain Digital Logistics Market By Organization size
12.3.3.11.5 Spain Digital Logistics Market, By Vertical
12.3.3.12 Netherlands
12.3.3.12.1 Netherlands Digital Logistics Market By Function
12.3.3.12.2 Netherlands Digital Logistics Market By Components
12.3.3.12.3 Netherlands Digital Logistics Market By Deployment mode
12.3.3.12.4 Netherlands Digital Logistics Market By Organization size
12.3.3.12.5 Netherlands Digital Logistics Market, By Vertical
12.3.3.13 Switzerland
12.3.3.13.1 Switzerland Digital Logistics Market By Function
12.3.3.13.2 Switzerland Digital Logistics Market By Components
12.3.3.13.3 Switzerland Digital Logistics Market By Deployment mode
12.3.3.13.4 Switzerland Digital Logistics Market By Organization size
12.3.3.13.5 Switzerland Digital Logistics Market, By Vertical
12.3.3.14 Austria
12.3.3.14.1 Austria Digital Logistics Market By Function
12.3.3.14.2 Austria Digital Logistics Market By Components
12.3.3.14.3 Austria Digital Logistics Market By Deployment mode
12.3.3.14.4 Austria Digital Logistics Market By Organization size
12.3.3.14.5 Austria Digital Logistics Market, By Vertical
12.3.3.15 Rest of Western Europe
12.3.3.15.1 Rest of Western Europe Digital Logistics Market By Function
12.3.3.15.2 Rest of Western Europe Digital Logistics Market By Components
12.3.3.15.3 Rest of Western Europe Digital Logistics Market By Deployment mode
12.3.3.15.4 Rest of Western Europe Digital Logistics Market By Organization size
12.3.3.15.5 Rest of Western Europe Digital Logistics Market, By Vertical
12.4 Asia-Pacific
12.4.1 Trend Analysis
12.4.2 Asia-Pacific Digital Logistics Market By Country
12.4.3 Asia-Pacific Digital Logistics Market By Function
12.4.4 Asia-Pacific Digital Logistics Market By Components
12.4.5 Asia-Pacific Digital Logistics Market By Deployment mode
12.4.6 Asia-Pacific Digital Logistics Market By Organization size
12.4.7 Asia-Pacific Digital Logistics Market, By Vertical
12.4.8 China
12.4.8.1 China Digital Logistics Market By Function
12.4.8.2 China Digital Logistics Market By Components
12.4.8.3 China Digital Logistics Market By Deployment mode
12.4.8.4 China Digital Logistics Market By Organization size
12.4.8.5 China Digital Logistics Market, By Vertical
12.4.9 India
12.4.9.1 India Digital Logistics Market By Function
12.4.9.2 India Digital Logistics Market By Components
12.4.9.3 India Digital Logistics Market By Deployment mode
12.4.9.4 India Digital Logistics Market By Organization size
12.4.9.5 India Digital Logistics Market, By Vertical
12.4.10 Japan
12.4.10.1 Japan Digital Logistics Market By Function
12.4.10.2 Japan Digital Logistics Market By Components
12.4.10.3 Japan Digital Logistics Market By Deployment mode
12.4.10.4 Japan Digital Logistics Market By Organization size
12.4.10.5 Japan Digital Logistics Market, By Vertical
12.4.11 South Korea
12.4.11.1 South Korea Digital Logistics Market By Function
12.4.11.2 South Korea Digital Logistics Market By Components
12.4.11.3 South Korea Digital Logistics Market By Deployment mode
12.4.11.4 South Korea Digital Logistics Market By Organization size
12.4.11.5 South Korea Digital Logistics Market, By Vertical
12.4.12 Vietnam
12.4.12.1 Vietnam Digital Logistics Market By Function
12.4.12.2 Vietnam Digital Logistics Market By Components
12.4.12.3 Vietnam Digital Logistics Market By Deployment mode
12.4.12.4 Vietnam Digital Logistics Market By Organization size
12.4.12.5 Vietnam Digital Logistics Market, By Vertical
12.4.13 Singapore
12.4.13.1 Singapore Digital Logistics Market By Function
12.4.13.2 Singapore Digital Logistics Market By Components
12.4.13.3 Singapore Digital Logistics Market By Deployment mode
12.4.13.4 Singapore Digital Logistics Market By Organization size
12.4.13.5 Singapore Digital Logistics Market, By Vertical
12.4.14 Australia
12.4.14.1 Australia Digital Logistics Market By Function
12.4.14.2 Australia Digital Logistics Market By Components
12.4.14.3 Australia Digital Logistics Market By Deployment mode
12.4.14.4 Australia Digital Logistics Market By Organization size
12.4.14.5 Australia Digital Logistics Market, By Vertical
12.4.15 Rest of Asia-Pacific
12.4.15.1 Rest of Asia-Pacific Digital Logistics Market By Function
12.4.15.2 Rest of Asia-Pacific Digital Logistics Market By Components
12.4.15.3 Rest of Asia-Pacific Digital Logistics Market By Deployment mode
12.4.15.4 Rest of Asia-Pacific Digital Logistics Market By Organization size
12.4.15.5 Rest of Asia-Pacific Digital Logistics Market, By Vertical
12.5 Middle East & Africa
12.5.1 Trend Analysis
12.5.2 Middle East
12.5.2.1 Middle East Digital Logistics Market By Country
12.5.2.2 Middle East Digital Logistics Market By Function
12.5.2.3 Middle East Digital Logistics Market By Components
12.5.2.4 Middle East Digital Logistics Market By Deployment mode
12.5.2.5 Middle East Digital Logistics Market By Organization size
12.5.2.6 Middle East Digital Logistics Market, By Vertical
12.5.2.7 UAE
12.5.2.7.1 UAE Digital Logistics Market By Function
12.5.2.7.2 UAE Digital Logistics Market By Components
12.5.2.7.3 UAE Digital Logistics Market By Deployment mode
12.5.2.7.4 UAE Digital Logistics Market By Organization size
12.5.2.7.5 UAE Digital Logistics Market, By Vertical
12.5.2.8 Egypt
12.5.2.8.1 Egypt Digital Logistics Market By Function
12.5.2.8.2 Egypt Digital Logistics Market By Components
12.5.2.8.3 Egypt Digital Logistics Market By Deployment mode
12.5.2.8.4 Egypt Digital Logistics Market By Organization size
12.5.2.8.5 Egypt Digital Logistics Market, By Vertical
12.5.2.9 Saudi Arabia
12.5.2.9.1 Saudi Arabia Digital Logistics Market By Function
12.5.2.9.2 Saudi Arabia Digital Logistics Market By Components
12.5.2.9.3 Saudi Arabia Digital Logistics Market By Deployment mode
12.5.2.9.4 Saudi Arabia Digital Logistics Market By Organization size
12.5.2.9.5 Saudi Arabia Digital Logistics Market, By Vertical
12.5.2.10 Qatar
12.5.2.10.1 Qatar Digital Logistics Market By Function
12.5.2.10.2 Qatar Digital Logistics Market By Components
12.5.2.10.3 Qatar Digital Logistics Market By Deployment mode
12.5.2.10.4 Qatar Digital Logistics Market By Organization size
12.5.2.10.5 Qatar Digital Logistics Market, By Vertical
12.5.2.11 Rest of Middle East
12.5.2.11.1 Rest of Middle East Digital Logistics Market By Function
12.5.2.11.2 Rest of Middle East Digital Logistics Market By Components
12.5.2.11.3 Rest of Middle East Digital Logistics Market By Deployment mode
12.5.2.11.4 Rest of Middle East Digital Logistics Market By Organization size
12.5.2.11.5 Rest of Middle East Digital Logistics Market, By Vertical
12.5.3 Africa
12.5.3.1 Africa Digital Logistics Market By Country
12.5.3.2 Africa Digital Logistics Market By Function
12.5.3.3 Africa Digital Logistics Market By Components
12.5.3.4 Africa Digital Logistics Market By Deployment mode
12.5.3.5 Africa Digital Logistics Market By Organization size
12.5.3.6 Africa Digital Logistics Market, By Vertical
12.5.3.7 Nigeria
12.5.3.7.1 Nigeria Digital Logistics Market By Function
12.5.3.7.2 Nigeria Digital Logistics Market By Components
12.5.3.7.3 Nigeria Digital Logistics Market By Deployment mode
12.5.3.7.4 Nigeria Digital Logistics Market By Organization size
12.5.3.7.5 Nigeria Digital Logistics Market, By Vertical
12.5.3.8 South Africa
12.5.3.8.1 South Africa Digital Logistics Market By Function
12.5.3.8.2 South Africa Digital Logistics Market By Components
12.5.3.8.3 South Africa Digital Logistics Market By Deployment mode
12.5.3.8.4 South Africa Digital Logistics Market By Organization size
12.5.3.8.5 South Africa Digital Logistics Market, By Vertical
12.5.3.9 Rest of Africa
12.5.3.9.1 Rest of Africa Digital Logistics Market By Function
12.5.3.9.2 Rest of Africa Digital Logistics Market By Components
12.5.3.9.3 Rest of Africa Digital Logistics Market By Deployment mode
12.5.3.9.4 Rest of Africa Digital Logistics Market By Organization size
12.5.3.9.5 Rest of Africa Digital Logistics Market, By Vertical
12.6 Latin America
12.6.1 Trend Analysis
12.6.2 Latin America Digital Logistics Market By country
12.6.3 Latin America Digital Logistics Market By Function
12.6.4 Latin America Digital Logistics Market By Components
12.6.5 Latin America Digital Logistics Market By Deployment mode
12.6.6 Latin America Digital Logistics Market By Organization size
12.6.7 Latin America Digital Logistics Market, By Vertical
12.6.8 Brazil
12.6.8.1 Brazil Digital Logistics Market By Function
12.6.8.2 Brazil Digital Logistics Market By Components
12.6.8.3 Brazil Digital Logistics Market By Deployment mode
12.6.8.4 Brazil Digital Logistics Market By Organization size
12.6.8.5 Brazil Digital Logistics Market, By Vertical
12.6.9 Argentina
12.6.9.1 Argentina Digital Logistics Market By Function
12.6.9.2 Argentina Digital Logistics Market By Components
12.6.9.3 Argentina Digital Logistics Market By Deployment mode
12.6.9.4 Argentina Digital Logistics Market By Organization size
12.6.9.5 Argentina Digital Logistics Market, By Vertical
12.6.10 Colombia
12.6.10.1 Colombia Digital Logistics Market By Function
12.6.10.2 Colombia Digital Logistics Market By Components
12.6.10.3 Colombia Digital Logistics Market By Deployment mode
12.6.10.4 Colombia Digital Logistics Market By Organization size
12.6.10.5 Colombia Digital Logistics Market, By Vertical
12.6.11 Rest of Latin America
12.6.11.1 Rest of Latin America Digital Logistics Market By Function
12.6.11.2 Rest of Latin America Digital Logistics Market By Components
12.6.11.3 Rest of Latin America Digital Logistics Market By Deployment mode
12.6.11.4 Rest of Latin America Digital Logistics Market By Organization size
12.6.11.5 Rest of Latin America Digital Logistics Market, By Vertical
13. Company Profiles
13.1 Huawei Technologies Co., Ltd
13.1.1 Company Overview
13.1.2 Financial
13.1.3 Products/ Services Offered
13.1.4 The SNS View
13.2 IBM
13.2.1 Company Overview
13.2.2 Financial
13.2.3 Products/ Services Offered
13.2.4 The SNS View
13.3 Honeywell
13.3.1 Company Overview
13.3.2 Financial
13.3.3 Products/ Services Offered
13.3.4 The SNS View
13.4 Oracle Corporation
13.4.1 Company Overview
13.4.2 Financial
13.4.3 Products/ Services Offered
13.4.4 The SNS View
13.5 SAP
13.5.1 Company Overview
13.5.2 Financial
13.5.3 Products/ Services Offered
13.5.4 The SNS View
13.6 Intel
13.6.1 Company Overview
13.6.2 Financial
13.6.3 Products/ Services Offered
13.6.4 The SNS View
13.7 HCL Technologies
13.7.1 Company Overview
13.7.2 Financial
13.7.3 Products/ Services Offered
13.7.4 The SNS View
13.8 Blue Yonder
13.8.1 Company Overview
13.8.2 Financial
13.8.3 Products/ Services Offered
13.8.4 The SNS View
13.9 AT&T
13.9.1 Company Overview
13.9.2 Financial
13.9.3 Products/ Services Offered
13.9.4 The SNS View
13.10 Intel
13.10.1 Company Overview
13.10.2 Financial
13.10.3 Products/ Services Offered
13.10.4 The SNS View
14. Competitive Landscape
14.1 Competitive Benchmarking
14.2 Market Share Analysis
14.3 Recent Developments
14.3.1 Industry News
14.3.2 Company News
14.3.3 Mergers & Acquisitions
15. Use Case and Best Practices
16. Conclusion
An accurate research report requires proper strategizing as well as implementation. There are multiple factors involved in the completion of good and accurate research report and selecting the best methodology to compete the research is the toughest part. Since the research reports we provide play a crucial role in any company’s decision-making process, therefore we at SNS Insider always believe that we should choose the best method which gives us results closer to reality. This allows us to reach at a stage wherein we can provide our clients best and accurate investment to output ratio.
Each report that we prepare takes a timeframe of 350-400 business hours for production. Starting from the selection of titles through a couple of in-depth brain storming session to the final QC process before uploading our titles on our website we dedicate around 350 working hours. The titles are selected based on their current market cap and the foreseen CAGR and growth.
The 5 steps process:
Step 1: Secondary Research:
Secondary Research or Desk Research is as the name suggests is a research process wherein, we collect data through the readily available information. In this process we use various paid and unpaid databases which our team has access to and gather data through the same. This includes examining of listed companies’ annual reports, Journals, SEC filling etc. Apart from this our team has access to various associations across the globe across different industries. Lastly, we have exchange relationships with various university as well as individual libraries.
Step 2: Primary Research
When we talk about primary research, it is a type of study in which the researchers collect relevant data samples directly, rather than relying on previously collected data. This type of research is focused on gaining content specific facts that can be sued to solve specific problems. Since the collected data is fresh and first hand therefore it makes the study more accurate and genuine.
We at SNS Insider have divided Primary Research into 2 parts.
Part 1 wherein we interview the KOLs of major players as well as the upcoming ones across various geographic regions. This allows us to have their view over the market scenario and acts as an important tool to come closer to the accurate market numbers. As many as 45 paid and unpaid primary interviews are taken from both the demand and supply side of the industry to make sure we land at an accurate judgement and analysis of the market.
This step involves the triangulation of data wherein our team analyses the interview transcripts, online survey responses and observation of on filed participants. The below mentioned chart should give a better understanding of the part 1 of the primary interview.
Part 2: In this part of primary research the data collected via secondary research and the part 1 of the primary research is validated with the interviews from individual consultants and subject matter experts.
Consultants are those set of people who have at least 12 years of experience and expertise within the industry whereas Subject Matter Experts are those with at least 15 years of experience behind their back within the same space. The data with the help of two main processes i.e., FGDs (Focused Group Discussions) and IDs (Individual Discussions). This gives us a 3rd party nonbiased primary view of the market scenario making it a more dependable one while collation of the data pointers.
Step 3: Data Bank Validation
Once all the information is collected via primary and secondary sources, we run that information for data validation. At our intelligence centre our research heads track a lot of information related to the market which includes the quarterly reports, the daily stock prices, and other relevant information. Our data bank server gets updated every fortnight and that is how the information which we collected using our primary and secondary information is revalidated in real time.
Step 4: QA/QC Process
After all the data collection and validation our team does a final level of quality check and quality assurance to get rid of any unwanted or undesired mistakes. This might include but not limited to getting rid of the any typos, duplication of numbers or missing of any important information. The people involved in this process include technical content writers, research heads and graphics people. Once this process is completed the title gets uploader on our platform for our clients to read it.
Step 5: Final QC/QA Process:
This is the last process and comes when the client has ordered the study. In this process a final QA/QC is done before the study is emailed to the client. Since we believe in giving our clients a good experience of our research studies, therefore, to make sure that we do not lack at our end in any way humanly possible we do a final round of quality check and then dispatch the study to the client.
The Industry 4.0 Market was valued at USD 166.1 billion in 2023 and is expected to grow at a CAGR of 20.1% over 2024-2032 to reach USD 862.0 billion by 2032.
The Private LTE market, valued at USD 5.48 Billion in 2023, is projected to reach USD 14.88 Billion by 2032, growing at a compound annual growth rate CAGR of 12.41% during the forecast period.
The Cyber Insurance Market size was valued at USD 15.3 Billion in 2023. It is expected to grow to USD 97.3 Billion by 2032 and grow at a CAGR of 22.8% over the forecast period of 2024-2032.
The Affective Computing Market size was valued at USD 66.1 Billion in 2023 and is expected to grow to USD 702.5 Billion by 2032 and grow at a CAGR of 30.1% over the forecast period of 2024-2032.
Finance and Accounting Business Process Outsourcing Market size was valued at USD 60.93 Billion in 2023. It is expected to Reach USD 134.65 Billion by 2032 and grow at a CAGR of 9.22% over the forecast period of 2024-2032.
The Mobile Device Management Market Size was USD 9.04 Billion in 2023 and will reach USD 74.90 Billion by 2032 and grow at a CAGR of 26.5% by 2024-2032.
Hi! Click one of our member below to chat on Phone