image

Digital Isolator Market Report Scope & Overview:

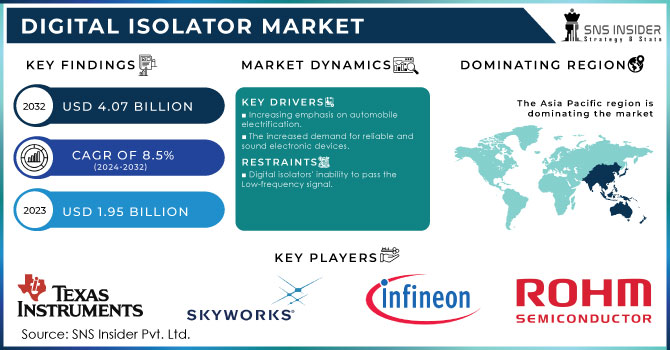
The Digital Isolator Market Size was valued at USD 1.93 Billion in 2023 and is expected to reach USD 3.55 Billion by 2032 and grow at a CAGR of 7.03% over the forecast period 2024-2032. Rising demand for digital isolators in industrial automation, electric vehicles (EVs), and high-speed communication fuels the growth of the digital isolator market. Organizations are emphasizing technology upgradation, product performance, and channeling functional fields within the healthcare, telecom, and energy industries. Digital isolators are rapidly replacing traditional optocouplers with impressive improvements in switching speed, power efficiency, and reliability. On one hand, customer behavior points to the trend towards more miniaturized, more efficient, and more secured isolation solutions, and on the other hand regulatory requirements, supply chain evolution, and increasing demand for miniaturization of electronics dictate the market.

Digital-Isolator-Market Revenue Analysis

Get more information on Digital Isolator Market - Request Sample Report

Market Dynamics

Key Drivers: 

  • Rising Demand for Digital Isolators Driven by EVs, Industrial Automation, and High-Speed Electronics

The digital isolator market is primarily driven by the adoption of high-speed and energy-efficient electronic systems across different industries including automotive, industrial automation, and telecommunications. One of the main driving forces behind market growth is the increasing need for galvanic isolation in power electronics including gate drivers and DC/DC converters. The trend towards electric vehicles (EVs), as well as renewable energy solutions, has increased the digital isolator demand as the performance of digital isolators is higher compared to the constational optocouplers, in terms of speed as well as reliability and power efficiency. Moreover, industrial automation and Industry 4.0 trends have strengthened the usage of digital isolators in motor drives, sensors as well as PLC to ensure safer and more reliable operations.

Restrain:

  • Challenges in Digital Isolator Integration Due to Design Complexity High-Voltage Stability and Stringent Regulations

Integration is a key restraint for the digital isolator market – their integration into existing electronic systems is complicated. Digital isolators have several design considerations that should be taken into account to ensure good signal integrity and electromagnetic compatibility which often represents a challenge for manufacturers. However, especially for high voltage applications, achieving the functional long-term stability and the environmental endurance of insulators particularly in the case of effective electric field conditions, is challenging. Also, specific sectors like aerospace and healthcare impose a more robust regulatory and safety standard that digital isolators must conform to, thereby prolonging validation, and should be checked thoroughly before getting approved.

Opportunity: 

  • Advancements in Semiconductor Materials and Growing Healthcare Demand Boost Digital Isolator Market Expansion

The digital isolator market is gaining from continuous research growth in semiconductor materials including silicon carbide (SiC) and gallium nitride (GaN) which further improve the performance and robustness of the isolator. Moreover, the healthcare industry is also becoming a significant expansion channel for digital isolators owing to their increasing utilization in medical imaging, patient monitoring systems, and implantable devices. In addition, there are great opportunities for players as there is rising demand for high-speed, noise-immune isolation solutions for data centers and IoT applications. Investments in smart grids and energy-efficient power systems provide some additional growth opportunities as digital isolators are key to ensuring that data can be reliably transferred and power can be managed.

Challenges:

  • Lack of Awareness of Legacy Compatibility and Signal Integrity Challenges Hinder Digital Isolator Adoption

The big challenge is the lack of awareness and technical skills to implement it in the best way. Traditional isolation has been a time-tested solution in several industries however, migrating to digital isolators requires engineering expertise and a redesign of the circuit. Transitioning to digital isolators may not always be feasible because of compatibility issues with legacy systems, especially in industries where upgrading infrastructures is expensive and is a time-consuming process. In addition, there are other technical challenges related to the possible distortion or failure of the signal in applications using high-speed data transmission. Addressing these challenges will necessitate ongoing innovation, strong testing regimes, and more collaboration between semiconductor makers and customers to help ease integration and ensure reliability in critical-end applications.

Segment Analysis

By Type

The market for digital isolators was led by capacitive coupling with a 43.3% market share in 2023. This dominance is mainly attributed to its ability to transmit data at high speed while consuming less power and providing better Electromagnetic Interference (EMI) immunity. Capacitive coupling isolators are used commonly in industrial Automation, Automotive Electronics, and Telecommunications,  as they provide good signal isolation while maintaining the integrity of data. This drives their extensive application in gate drivers, DC/DC converters, and high-frequency switching power supplies due to their advantages.

Magnetic coupling is anticipated to witness the highest CAGR during the forecast period of 2024 to 2032 on account of various benefits such as excellent noise immunity, high reliability, and operation in a high-temperature environment. Customary patterns for isolators during this procedure rely upon sneak and vitality board illustrative advances, which give scientifically relevant portrayals of isolator execution in the quick and reasonableness scope. High-power applications witness the use of magnetic coupling isolators for increased efficiency and the increasing penetration of electric vehicles (EVs) and renewable energy systems is anticipated to initiate a new wave with enhanced demand for magnetic coupling isolators.

By Data Rate

The 25 Mbps to 75 Mbps segment accounted for 42.7% of the market share. It dominates due to the large number of applications (industrial automation, automotive systems, and power electronics) that require moderate-speed data transmission for effective signal processing and isolation. In this performance, power, and cost range, digital isolators are primarily used for gate drivers, DC/DC converters, and motor control applications. Even with communication interfaces, microcontrollers, and sensors, they are preferred to be used with these as they provide isolation reliability but very little faster/Pace levels & stability.

The above 75 Mbps segment is anticipated to register the fastest CAGR during the forecast period 2024 to 2032, owing to the rising need for high-speed data transmission in telecom, data centers, and sophisticated industrial applications. The necessity of isolators that enable ultra-low latency transmission such as a few nanoseconds of the signal is driven by the rapid growth of 5G networks, high-speed communication systems, and real-time data processing. Furthermore, faster digital isolators are essential for new technologies like autonomous vehicles, AI-based industrial automation, and IoT-based smart systems for data persistence and to avoid signal degradation.

By Channel

In 2023, the digital isolator Market share of the Channel Four segment has crossed 38.3% of the market. Such dominance is due to its extensive use in industrial automation, automotive electronics, and power management applications that must provide a tradeoff between isolation performance and cost. Four-channel digital isolators are a great fit for mid-range systems like motor drives, PLCs, and communication interfaces since they provide robustness in data transmission and electrical isolation. The efficiency in multi-signal management with a low footprint has also cemented their place in the market.

Channel Eight is projected to grow at the fastest CAGR during the forecast period from 2024 to 2032 due to the increasing requirement of high-density isolation versatility across many high-performance industrial and telecommunication systems. Advancements in communication and automation like high-speed data communication and complex automation networks, combined with the growth in electric vehicle power systems are driving the need for eight-channel isolators enabling higher integration and smaller PCB footprints. This segment is expected to grow at a rapid pace due to the increasing demand for multi-channel digital isolators as industries are moving towards miniaturized, high-performance electronics.

By Application

In 2023, the digital isolator market was dominated by the Gate Drivers segment, which had a 41.7% market share. The main factor responsible for this dominance is the rapid adoption of power electronics in industrial automation, electric vehicles (EVs), and renewable energy systems. Simply put, there is always a need for gate drivers in applications such as motor control, inverters, and power converters that deliver isolation, high-speed switching, and provide high gate current for the high voltage MOSFETs and IGBTs to operate. Due to the requirement of high efficiency, miniaturization, and reliable isolation performance, the application of digital isolators has greatly promoted the gate driver under a high-voltage environment.

The DC/DC Converter segment is expected to have the highest CAGR during the period from 2024 to 2032 as the need for efficient power management solutions across industries such as automotive, telecommunications, and industrial automation is expected to drive the growth of the segment. The continued push for more energy-efficient systems and miniaturized power supplies continues to drive the demand for digital isolators, as they offer great performance within DC/DC converters with their higher voltage regulation and noise immunity properties, putting them front and center in battery management systems (BMS) in EVs, IoT devices, and 5G infrastructure.

By Vertical

In 2023, the Industrial segment accounted for the largest share of 27.8% of the digital isolator market. This domination is due to growing implementations of automation, robotics, and Industry 4.0 technologies in manufacturing and process industries. Digital isolators have a wide range of applications in the fields of motor drives, factory automation systems, PLCs, and industrial power supplies where they provide reliable signal transmission and electrical isolation in demanding operating conditions. The increasing shift toward smart factories and IIoT (Industrial Internet of Things) interfaces has propelled the demand for performance-oriented isolation solutions, thus further consolidating the share of the industrial sector in the global market.

The automotive segment is projected to exhibit the fastest CAGR during the forecast period 2024-2032, owing to the swift growth of electric vehicles (EVs), advanced driver-assistance systems (ADAS), and battery management systems (BMS). Digital isolators are vital for safe and effective power management, data communication, and noise immunity automakers are not moving toward electrification and autonomous driving technologies without them. Automotive will be the fastest-growing segment in the upcoming years, with the rising integration of high-voltage power electronics, onboard chargers, and infotainment systems further driving the demand.

Regional Analysis

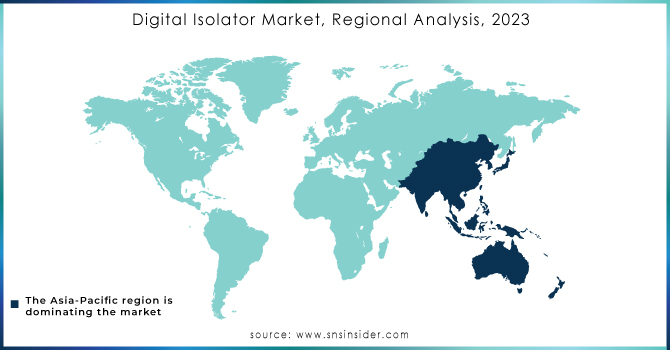
The North American region accounted for 34.4% of market share. Such dominance is due to a vast concentration of semiconductor giants, robust industrial automation, and swift penetration of EVs and renewable energy solutions. For decades, the high-speed communication infrastructure, industrial robotics, and aerospace & defense applications across the U.S. and Canada have motivated the demand for digital isolators that can ensure signal integrity and electrical isolation. Concrete use cases can be found in Texas Instruments and Analog Devices as well as Skyworks Solution providing state-of-the-art digital isolator solutions for EV powertrains, industrial motor drives as well and medical imaging equipment.

Asia Pacific is projected to be the fastest-growing region with the highest CAGR from 2024 to 2032, owing to the strong Consumer Electronics, Automotive electrification & Smart Grid infrastructure. The data about countries such as China, Japan, South Korea, and India, which are heavily investing in 5G, electric mobility, and industrial automation, opens new potential needs for high-performance isolation solutions. In EV platforms and autonomous driving systems, digital isolators are being integrated by BYD and Hyundai, while in 5G base stations and high-speed data transmission equipment, Huawei and Samsung have adopted digital isolators.

Digital-Isolator-Market-Regional-Analysis-2023

 Get Customized Report as per your Business Requirement - Request For Customized Report

Key players

Some of the major players in the Digital Isolator Market are:

  • Texas Instruments (ISO6163, ISO6520)

  • Analog Devices (ADuM362N, ADuM321N)

  • Infineon Technologies (ISOFACE Dual-Channel, ISOFACE Quad-Channel)

  • STMicroelectronics (STISO621, STISO621W)

  • Vicor Corporation (PI3586-00-LGIZ, PI3740-00-LGIZ)

  • Silicon Labs (Si86xx, Si88xx)

  • Broadcom (ACPL-C87B, ACPL-K73L)

  • NXP Semiconductors (NX3DV42GU10, NX3L1T53GU10)

  • Maxim Integrated (MAX22441, MAX22666)

  • Rohm Semiconductor (BD7F100HFN-LB, BD7F200HFN-LB)

  • Murata Manufacturing (MGJ2D121505SC, MGJ6D121505SC)

  • ON Semiconductor (NCS21xR, NCS21xR2)

  • Renesas Electronics (ISL32704E, ISL32705E)

  • Toshiba Electronic Devices & Storage (TLP2361, TLP2363)

  • Broadcom (ACPL-P480, ACPL-W480)


Recent Trends

  • In November 2024, Texas Instruments (TI) launched new MCUs with edge AI and enhanced real-time control, boosting efficiency, safety, and sustainability in automotive and industrial applications.

  • In February 2024, Infineon launched new Solid-State Isolators with coreless transformer technology, enabling faster switching with up to 70% lower power dissipation.

Digital Isolator Market Report Scope:

Report Attributes Details
Market Size in 2023 USD 1.93 Billion
Market Size by 2032 USD 3.55 Billion
CAGR CAGR of 7.03% From 2024 to 2032
Base Year 2023
Forecast Period 2024-2032
Historical Data 2020-2022
Report Scope & Coverage Market Size, Segments Analysis, Competitive  Landscape, Regional Analysis, DROC & SWOT Analysis, Forecast Outlook
Key Segments • By Type (Capacitive Coupling, GMR, Magnetic Coupling)
• By Data Rate (Less Than 25 Mbps, 25 Mbps to 75 Mbps, above 75 Mbps)
• By Channel (Channel Two, Channel Four, Channel Six, Channel Eight)
• By Application (Gate Drivers, DC/DC Converter, ADC)
• By Vertical (Industrial, Healthcare, Automotive, Telecommunication, Aerospace & Defense, Energy & Power)
Regional Analysis/Coverage North America (US, Canada, Mexico), Europe (Eastern Europe [Poland, Romania, Hungary, Turkey, Rest of Eastern Europe] Western Europe] Germany, France, UK, Italy, Spain, Netherlands, Switzerland, Austria, Rest of Western Europe]), Asia Pacific (China, India, Japan, South Korea, Vietnam, Singapore, Australia, Rest of Asia Pacific), Middle East & Africa (Middle East [UAE, Egypt, Saudi Arabia, Qatar, Rest of Middle East], Africa [Nigeria, South Africa, Rest of Africa], Latin America (Brazil, Argentina, Colombia, Rest of Latin America)
Company Profiles Texas Instruments, Analog Devices, Infineon Technologies, STMicroelectronics, Vicor Corporation, Silicon Labs, Broadcom, NXP Semiconductors, Maxim Integrated, Rohm Semiconductor, Murata Manufacturing, ON Semiconductor, Renesas Electronics, Toshiba Electronic Devices & Storage, Broadcom.

Frequently Asked Questions

Ans:  The Digital Isolator Market is expected to grow at a CAGR of 7.03%.

Ans: Digital Isolator Market size was USD 1.93 billion in 2023 and is expected to Reach USD 3.55 billion by 2032.

Ans: The major key drivers for the growth of the Digital Isolator Market include the rising adoption of industrial automation, electric vehicles (EVs), high-speed data communication, renewable energy systems, and advanced power management solutions.

Ans: The 25 Mbps to 75 Mbps segment dominated the Industrial battery market in 2023.

Ans: In 2023, the North American region led the Digital Isolator market, capturing approximately 34.46% of the total market share.

Table of Contents:

1. Introduction

1.1 Market Definition

1.2 Scope (Inclusion and Exclusions)

1.3 Research Assumptions

2. Executive Summary

2.1 Market Overview

2.2 Regional Synopsis

2.3 Competitive Summary

3. Research Methodology

3.1 Top-Down Approach

3.2 Bottom-up Approach

3.3. Data Validation

3.4 Primary Interviews

4. Market Dynamics Impact Analysis

4.1 Market Driving Factors Analysis

4.1.1 Drivers

4.1.2 Restraints

4.1.3 Opportunities

4.1.4 Challenges

4.2 PESTLE Analysis

4.3 Porter’s Five Forces Model

5. Statistical Insights and Trends Reporting

5.1 Market Demand & Adoption Metrics

5.2 Business Performance

5.3 Technical & Performance Insights

5.4 Market Dynamics & Customer Behavior

6. Competitive Landscape

6.1 List of Major Companies, By Region

6.2 Market Share Analysis, By Region

6.3 Product Benchmarking

6.3.1 Product specifications and features

6.3.2 Pricing

6.4 Strategic Initiatives

6.4.1 Marketing and promotional activities

6.4.2 Distribution and Supply Chain Strategies

6.4.3 Expansion plans and new product launches

6.4.4 Strategic partnerships and collaborations

6.5 Technological Advancements

6.6 Market Positioning and Branding

7. Digital Isolator Market Segmentation, By Type

7.1 Chapter Overview

7.2 Capacitive Coupling

7.2.1 Capacitive Coupling Market Trends Analysis (2020-2032)

7.2.2 Capacitive Coupling Market Size Estimates and Forecasts to 2032 (USD Billion)

7.3 GMR

7.3.1 GMR Market Trends Analysis (2020-2032)

7.3.2 GMR Market Size Estimates and Forecasts to 2032 (USD Billion)

7.4 Magnetic Coupling

7.4.1 Magnetic Coupling Market Trends Analysis (2020-2032)

           7.4.2 Magnetic Coupling Market Size Estimates and Forecasts to 2032 (USD Billion)

8. Digital Isolator Market Segmentation, By Data Rate

8.1 Chapter Overview

8.2 Less Than 25 Mbps

8.2.1 Less Than 25 Mbps Market Trends Analysis (2020-2032)

8.2.2 Less Than 25 Mbps Market Size Estimates and Forecasts To 2032 (USD Billion)

8.3 25 Mbps to 75 Mbps

8.3.1 25 Mbps to 75 Mbps Market Trends Analysis (2020-2032)

8.3.2 25 Mbps to 75 Mbps Market Size Estimates and Forecasts To 2032 (USD Billion)

8.4 above 75 Mbps

8.4.1 above 75 Mbps Market Trends Analysis (2020-2032)

8.4.2 above 75 Mbps Market Size Estimates and Forecasts To 2032 (USD Billion)

9. Digital Isolator Market Segmentation, By Channel

9.1 Chapter Overview

9.2 Channel Two

9.2.1 Channel Two Market Trends Analysis (2020-2032)

9.2.2 Channel Two Market Size Estimates and Forecasts To 2032 (USD Billion)

9.3 Channel Four

9.3.1 Channel Four Market Trends Analysis (2020-2032)

9.3.2 Channel Four Market Size Estimates and Forecasts To 2032 (USD Billion)

9.4 Channel Six

9.4.1 Channel Six Market Trends Analysis (2020-2032)

9.4.2 Channel Six Market Size Estimates and Forecasts To 2032 (USD Billion)

9.5 Channel Eight

9.5.1 Channel Eight Market Trends Analysis (2020-2032)

9.5.2 Channel Eight Market Size Estimates and Forecasts To 2032 (USD Billion)

10. Digital Isolator Market Segmentation, By Application

10.1 Chapter Overview

10.2 Gate Drivers

10.2.1 Gate Drivers Market Trends Analysis (2020-2032)

10.2.2 Gate Drivers Market Size Estimates and Forecasts To 2032 (USD Billion)

10.3 DC/DC Converter

10.3.1 DC/DC Converter Market Trends Analysis (2020-2032)

10.3.2 DC/DC Converter Market Size Estimates and Forecasts To 2032 (USD Billion)

10.4 ADC

10.4.1 ADC Market Trends Analysis (2020-2032)

10.4.2 ADC Market Size Estimates and Forecasts To 2032 (USD Billion)

11. Digital Isolator Market Segmentation, By Vertical

11.1 Chapter Overview

11.2 Industrial

11.2.1 Industrial Market Trends Analysis (2020-2032)

11.2.2 Industrial Market Size Estimates and Forecasts To 2032 (USD Billion)

11.3 Healthcare

11.3.1 Healthcare Market Trends Analysis (2020-2032)

11.3.2 Healthcare Market Size Estimates and Forecasts To 2032 (USD Billion)

11.4 Automotive

11.4.1 Automotive Market Trends Analysis (2020-2032)

11.4.2 Automotive Market Size Estimates and Forecasts To 2032 (USD Billion)

11.5 Telecommunication

11.5.1 Telecommunication Market Trends Analysis (2020-2032)

11.5.2 Telecommunication Market Size Estimates and Forecasts To 2032 (USD Billion)

11.6 Aerospace & Defence

11.6.1 Aerospace & Defence Market Trends Analysis (2020-2032)

11.6.2 Aerospace & Defence Market Size Estimates and Forecasts To 2032 (USD Billion)

11.7 Energy & Power

11.7.1 Energy & Power Market Trends Analysis (2020-2032)

11.7.2 Energy & Power Market Size Estimates and Forecasts To 2032 (USD Billion)

12. Regional Analysis

12.1 Chapter Overview

12.2 North America

12.2.1 Trends Analysis

12.2.2 North America Digital Isolator Market Estimates and Forecasts, By Country (2020-2032) (USD Billion)

12.2.3 North America Digital Isolator Market Estimates and Forecasts, By Type (2020-2032) (USD Billion)

12.2.4 North America Digital Isolator Market Estimates and Forecasts, By Data Rate (2020-2032) (USD Billion)

12.2.5 North America Digital Isolator Market Estimates and Forecasts, By Channel (2020-2032) (USD Billion)

12.2.6 North America Digital Isolator Market Estimates and Forecasts, By Application (2020-2032) (USD Billion)

12.2.7 North America Digital Isolator Market Estimates and Forecasts, By Vertical (2020-2032) (USD Billion)

12.2.8 USA

12.2.8.1 USA Digital Isolator Market Estimates and Forecasts, By Type (2020-2032) (USD Billion)

12.2.8.2 USA Digital Isolator Market Estimates and Forecasts, By Data Rate (2020-2032) (USD Billion)

12.2.8.3 USA Digital Isolator Market Estimates and Forecasts, By Channel (2020-2032) (USD Billion)

12.2.8.4 USA Digital Isolator Market Estimates and Forecasts, By Application (2020-2032) (USD Billion)

12.2.8.5 USA Digital Isolator Market Estimates and Forecasts, By Vertical (2020-2032) (USD Billion)

12.2.9 Canada

12.2.9.1 Canada Digital Isolator Market Estimates and Forecasts, By Type (2020-2032) (USD Billion)

12.2.9.2 Canada Digital Isolator Market Estimates and Forecasts, By Data Rate (2020-2032) (USD Billion)

12.2.9.3 Canada Digital Isolator Market Estimates and Forecasts, By Channel (2020-2032) (USD Billion)

12.2.9.4 Canada Digital Isolator Market Estimates and Forecasts, By Application (2020-2032) (USD Billion)

12.2.9.5 Canada Digital Isolator Market Estimates and Forecasts, By Vertical (2020-2032) (USD Billion)

12.2.10 Mexico

12.2.10.1 Mexico Digital Isolator Market Estimates and Forecasts, By Type (2020-2032) (USD Billion)

12.2.10.2 Mexico Digital Isolator Market Estimates and Forecasts, By Data Rate (2020-2032) (USD Billion)

12.2.10.3 Mexico Digital Isolator Market Estimates and Forecasts, By Channel (2020-2032) (USD Billion)

12.2.10.4 Mexico Digital Isolator Market Estimates and Forecasts, By Application (2020-2032) (USD Billion)

12.2.10.5 Mexico Digital Isolator Market Estimates and Forecasts, By Vertical (2020-2032) (USD Billion)

12.3 Europe

12.3.1 Eastern Europe

12.3.1.1 Trends Analysis

12.3.1.2 Eastern Europe Digital Isolator Market Estimates and Forecasts, By Country (2020-2032) (USD Billion)

12.3.1.3 Eastern Europe Digital Isolator Market Estimates and Forecasts, By Type (2020-2032) (USD Billion)

12.3.1.4 Eastern Europe Digital Isolator Market Estimates and Forecasts, By Data Rate (2020-2032) (USD Billion)

12.3.1.5 Eastern Europe Digital Isolator Market Estimates and Forecasts, By Channel (2020-2032) (USD Billion)

12.3.1.6 Eastern Europe Digital Isolator Market Estimates and Forecasts, By Application (2020-2032) (USD Billion)

12.3.1.7 Eastern Europe Digital Isolator Market Estimates and Forecasts, By Vertical (2020-2032) (USD Billion)

12.3.1.8 Poland

12.3.1.8.1 Poland Digital Isolator Market Estimates and Forecasts, By Type (2020-2032) (USD Billion)

12.3.1.8.2 Poland Digital Isolator Market Estimates and Forecasts, By Data Rate (2020-2032) (USD Billion)

12.3.1.8.3 Poland Digital Isolator Market Estimates and Forecasts, By Channel (2020-2032) (USD Billion)

12.3.1.8.4 Poland Digital Isolator Market Estimates and Forecasts, By Application (2020-2032) (USD Billion)

12.3.1.8.5 Poland Digital Isolator Market Estimates and Forecasts, By Vertical (2020-2032) (USD Billion)

12.3.1.9 Romania

12.3.1.9.1 Romania Digital Isolator Market Estimates and Forecasts, By Type (2020-2032) (USD Billion)

12.3.1.9.2 Romania Digital Isolator Market Estimates and Forecasts, By Data Rate (2020-2032) (USD Billion)

12.3.1.9.3 Romania Digital Isolator Market Estimates and Forecasts, By Channel (2020-2032) (USD Billion)

12.3.1.9.4 Romania Digital Isolator Market Estimates and Forecasts, By Application (2020-2032) (USD Billion)

12.3.1.9.5 Romania Digital Isolator Market Estimates and Forecasts, By Vertical (2020-2032) (USD Billion)

12.3.1.10 Hungary

12.3.1.10.1 Hungary Digital Isolator Market Estimates and Forecasts, By Type (2020-2032) (USD Billion)

12.3.1.10.2 Hungary Digital Isolator Market Estimates and Forecasts, By Data Rate (2020-2032) (USD Billion)

12.3.1.10.3 Hungary Digital Isolator Market Estimates and Forecasts, By Channel (2020-2032) (USD Billion)

12.3.1.10.4 Hungary Digital Isolator Market Estimates and Forecasts, By Application (2020-2032) (USD Billion)

12.3.1.10.5 Hungary Digital Isolator Market Estimates and Forecasts, By Vertical (2020-2032) (USD Billion)

12.3.1.11 Turkey

12.3.1.11.1 Turkey Digital Isolator Market Estimates and Forecasts, By Type (2020-2032) (USD Billion)

12.3.1.11.2 Turkey Digital Isolator Market Estimates and Forecasts, By Data Rate (2020-2032) (USD Billion)

12.3.1.11.3 Turkey Digital Isolator Market Estimates and Forecasts, By Channel (2020-2032) (USD Billion)

12.3.1.11.4 Turkey Digital Isolator Market Estimates and Forecasts, By Application (2020-2032) (USD Billion)

12.3.1.11.5 Turkey Digital Isolator Market Estimates and Forecasts, By Vertical (2020-2032) (USD Billion)

12.3.1.12 Rest Of Eastern Europe

12.3.1.12.1 Rest Of Eastern Europe Digital Isolator Market Estimates and Forecasts, By Type (2020-2032) (USD Billion)

12.3.1.12.2 Rest Of Eastern Europe Digital Isolator Market Estimates and Forecasts, By Data Rate (2020-2032) (USD Billion)

12.3.1.12.3 Rest Of Eastern Europe Digital Isolator Market Estimates and Forecasts, By Channel (2020-2032) (USD Billion)

12.3.1.12.4 Rest Of Eastern Europe Digital Isolator Market Estimates and Forecasts, By Application (2020-2032) (USD Billion)

12.3.1.12.5 Rest Of Eastern Europe Digital Isolator Market Estimates and Forecasts, By Vertical (2020-2032) (USD Billion)

12.3.2 Western Europe

12.3.2.1 Trends Analysis

12.3.2.2 Western Europe Digital Isolator Market Estimates and Forecasts, By Country (2020-2032) (USD Billion)

12.3.2.3 Western Europe Digital Isolator Market Estimates and Forecasts, By Type (2020-2032) (USD Billion)

12.3.2.4 Western Europe Digital Isolator Market Estimates and Forecasts, By Data Rate (2020-2032) (USD Billion)

12.3.2.5 Western Europe Digital Isolator Market Estimates and Forecasts, By Channel (2020-2032) (USD Billion)

12.3.2.6 Western Europe Digital Isolator Market Estimates and Forecasts, By Application (2020-2032) (USD Billion)

12.3.2.7 Western Europe Digital Isolator Market Estimates and Forecasts, By Vertical (2020-2032) (USD Billion)

12.3.2.8 Germany

12.3.2.8.1 Germany Digital Isolator Market Estimates and Forecasts, By Type (2020-2032) (USD Billion)

12.3.2.8.2 Germany Digital Isolator Market Estimates and Forecasts, By Data Rate (2020-2032) (USD Billion)

12.3.2.8.3 Germany Digital Isolator Market Estimates and Forecasts, By Channel (2020-2032) (USD Billion)

12.3.2.8.4 Germany Digital Isolator Market Estimates and Forecasts, By Application (2020-2032) (USD Billion)

12.3.2.8.5 Germany Digital Isolator Market Estimates and Forecasts, By Vertical (2020-2032) (USD Billion)

12.3.2.9 France

12.3.2.9.1 France Digital Isolator Market Estimates and Forecasts, By Type (2020-2032) (USD Billion)

12.3.2.9.2 France Digital Isolator Market Estimates and Forecasts, By Data Rate (2020-2032) (USD Billion)

12.3.2.9.3 France Digital Isolator Market Estimates and Forecasts, By Channel (2020-2032) (USD Billion)

12.3.2.9.4 France Digital Isolator Market Estimates and Forecasts, By Application (2020-2032) (USD Billion)

12.3.2.9.5 France Digital Isolator Market Estimates and Forecasts, By Vertical (2020-2032) (USD Billion)

12.3.2.10 UK

12.3.2.10.1 UK Digital Isolator Market Estimates and Forecasts, By Type (2020-2032) (USD Billion)

12.3.2.10.2 UK Digital Isolator Market Estimates and Forecasts, By Data Rate (2020-2032) (USD Billion)

12.3.2.10.3 UK Digital Isolator Market Estimates and Forecasts, By Channel (2020-2032) (USD Billion)

12.3.2.10.4 UK Digital Isolator Market Estimates and Forecasts, By Application (2020-2032) (USD Billion)

12.3.2.10.5 UK Digital Isolator Market Estimates and Forecasts, By Vertical (2020-2032) (USD Billion)

12.3.2.11 Italy

12.3.2.11.1 Italy Digital Isolator Market Estimates and Forecasts, By Type (2020-2032) (USD Billion)

12.3.2.11.2 Italy Digital Isolator Market Estimates and Forecasts, By Data Rate (2020-2032) (USD Billion)

12.3.2.11.3 Italy Digital Isolator Market Estimates and Forecasts, By Channel (2020-2032) (USD Billion)

12.3.2.11.4 Italy Digital Isolator Market Estimates and Forecasts, By Application (2020-2032) (USD Billion)

12.3.2.11.5 Italy Digital Isolator Market Estimates and Forecasts, By Vertical (2020-2032) (USD Billion)

12.3.2.12 Spain

12.3.2.12.1 Spain Digital Isolator Market Estimates and Forecasts, By Type (2020-2032) (USD Billion)

12.3.2.12.2 Spain Digital Isolator Market Estimates and Forecasts, By Data Rate (2020-2032) (USD Billion)

12.3.2.12.3 Spain Digital Isolator Market Estimates and Forecasts, By Channel (2020-2032) (USD Billion)

12.3.2.12.4 Spain Digital Isolator Market Estimates and Forecasts, By Application (2020-2032) (USD Billion)

12.3.2.12.5 Spain Digital Isolator Market Estimates and Forecasts, By Vertical (2020-2032) (USD Billion)

12.3.2.13 Netherlands

12.3.2.13.1 Netherlands Digital Isolator Market Estimates and Forecasts, By Type (2020-2032) (USD Billion)

12.3.2.13.2 Netherlands Digital Isolator Market Estimates and Forecasts, By Data Rate (2020-2032) (USD Billion)

12.3.2.13.3 Netherlands Digital Isolator Market Estimates and Forecasts, By Channel (2020-2032) (USD Billion)

12.3.2.13.4 Netherlands Digital Isolator Market Estimates and Forecasts, By Application (2020-2032) (USD Billion)

12.3.2.13.5 Netherlands Digital Isolator Market Estimates and Forecasts, By Vertical (2020-2032) (USD Billion)

12.3.2.14 Switzerland

12.3.2.14.1 Switzerland Digital Isolator Market Estimates and Forecasts, By Type (2020-2032) (USD Billion)

12.3.2.14.2 Switzerland Digital Isolator Market Estimates and Forecasts, By Data Rate (2020-2032) (USD Billion)

12.3.2.14.3 Switzerland Digital Isolator Market Estimates and Forecasts, By Channel (2020-2032) (USD Billion)

12.3.2.14.4 Switzerland Digital Isolator Market Estimates and Forecasts, By Application (2020-2032) (USD Billion)

12.3.2.12.5 Switzerland Digital Isolator Market Estimates and Forecasts, By Vertical (2020-2032) (USD Billion)

12.3.2.15 Austria

12.3.2.15.1 Austria Digital Isolator Market Estimates and Forecasts, By Type (2020-2032) (USD Billion)

12.3.2.15.2 Austria Digital Isolator Market Estimates and Forecasts, By Data Rate (2020-2032) (USD Billion)

12.3.2.15.3 Austria Digital Isolator Market Estimates and Forecasts, By Channel (2020-2032) (USD Billion)

12.3.2.15.4 Austria Digital Isolator Market Estimates and Forecasts, By Application (2020-2032) (USD Billion)

12.3.2.15.5 Austria Digital Isolator Market Estimates and Forecasts, By Vertical (2020-2032) (USD Billion)

12.3.2.16 Rest Of Western Europe

12.3.2.16.1 Rest Of Western Europe Digital Isolator Market Estimates and Forecasts, By Type (2020-2032) (USD Billion)

12.3.2.16.2 Rest Of Western Europe Digital Isolator Market Estimates and Forecasts, By Data Rate (2020-2032) (USD Billion)

12.3.2.16.3 Rest Of Western Europe Digital Isolator Market Estimates and Forecasts, By Channel (2020-2032) (USD Billion)

12.3.2.16.4 Rest Of Western Europe Digital Isolator Market Estimates and Forecasts, By Application (2020-2032) (USD Billion)

12.3.2.16.5 Rest Of Western Europe Digital Isolator Market Estimates and Forecasts, By Vertical (2020-2032) (USD Billion)

12.4 Asia Pacific

12.4.1 Trends Analysis

12.4.2 Asia Pacific Digital Isolator Market Estimates and Forecasts, By Country (2020-2032) (USD Billion)

12.4.3 Asia Pacific Digital Isolator Market Estimates and Forecasts, By Type (2020-2032) (USD Billion)

12.4.4 Asia Pacific Digital Isolator Market Estimates and Forecasts, By Data Rate (2020-2032) (USD Billion)

12.4.5 Asia Pacific Digital Isolator Market Estimates and Forecasts, By Channel (2020-2032) (USD Billion)

12.4.6 Asia Pacific Digital Isolator Market Estimates and Forecasts, By Application (2020-2032) (USD Billion)

12.4.7 Asia Pacific Digital Isolator Market Estimates and Forecasts, By Vertical (2020-2032) (USD Billion)

12.4.8 China

12.4.8.1 China Digital Isolator Market Estimates and Forecasts, By Type (2020-2032) (USD Billion)

12.4.8.2 China Digital Isolator Market Estimates and Forecasts, By Data Rate (2020-2032) (USD Billion)

12.4.8.3 China Digital Isolator Market Estimates and Forecasts, By Channel (2020-2032) (USD Billion)

12.4.8.4 China Digital Isolator Market Estimates and Forecasts, By Application (2020-2032) (USD Billion)

12.4.8.5 China Digital Isolator Market Estimates and Forecasts, By Vertical (2020-2032) (USD Billion)

12.4.9 India

12.4.9.1 India Digital Isolator Market Estimates and Forecasts, By Type (2020-2032) (USD Billion)

12.4.9.2 India Digital Isolator Market Estimates and Forecasts, By Data Rate (2020-2032) (USD Billion)

12.4.9.3 India Digital Isolator Market Estimates and Forecasts, By Channel (2020-2032) (USD Billion)

12.4.9.4 India Digital Isolator Market Estimates and Forecasts, By Application (2020-2032) (USD Billion)

12.4.9.5 India Digital Isolator Market Estimates and Forecasts, By Vertical (2020-2032) (USD Billion)

12.4.10 Japan

12.4.10.1 Japan Digital Isolator Market Estimates and Forecasts, By Type (2020-2032) (USD Billion)

12.4.10.2 Japan Digital Isolator Market Estimates and Forecasts, By Data Rate (2020-2032) (USD Billion)

12.4.10.3 Japan Digital Isolator Market Estimates and Forecasts, By Channel (2020-2032) (USD Billion)

12.4.10.4 Japan Digital Isolator Market Estimates and Forecasts, By Application (2020-2032) (USD Billion)

12.4.10.5 Japan Digital Isolator Market Estimates and Forecasts, By Vertical (2020-2032) (USD Billion)

12.4.11 South Korea

12.4.11.1 South Korea Digital Isolator Market Estimates and Forecasts, By Type (2020-2032) (USD Billion)

12.4.11.2 South Korea Digital Isolator Market Estimates and Forecasts, By Data Rate (2020-2032) (USD Billion)

12.4.11.3 South Korea Digital Isolator Market Estimates and Forecasts, By Channel (2020-2032) (USD Billion)

12.4.11.4 South Korea Digital Isolator Market Estimates and Forecasts, By Application (2020-2032) (USD Billion)

12.4.11.5 South Korea Digital Isolator Market Estimates and Forecasts, By Vertical (2020-2032) (USD Billion)

12.4.12 Vietnam

12.4.12.1 Vietnam Digital Isolator Market Estimates and Forecasts, By Type (2020-2032) (USD Billion)

12.4.12.2 Vietnam Digital Isolator Market Estimates and Forecasts, By Data Rate (2020-2032) (USD Billion)

12.4.12.3 Vietnam Digital Isolator Market Estimates and Forecasts, By Channel (2020-2032) (USD Billion)

12.4.12.4 Vietnam Digital Isolator Market Estimates and Forecasts, By Application (2020-2032) (USD Billion)

12.4.12.5 Vietnam Digital Isolator Market Estimates and Forecasts, By Vertical (2020-2032) (USD Billion)

12.4.13 Singapore

12.4.13.1 Singapore Digital Isolator Market Estimates and Forecasts, By Type (2020-2032) (USD Billion)

12.4.13.2 Singapore Digital Isolator Market Estimates and Forecasts, By Data Rate (2020-2032) (USD Billion)

12.4.13.3 Singapore Digital Isolator Market Estimates and Forecasts, By Channel (2020-2032) (USD Billion)

12.4.13.4 Singapore Digital Isolator Market Estimates and Forecasts, By Application (2020-2032) (USD Billion)

12.4.13.5 Singapore Digital Isolator Market Estimates and Forecasts, By Vertical (2020-2032) (USD Billion)

12.4.14 Australia

12.4.14.1 Australia Digital Isolator Market Estimates and Forecasts, By Type (2020-2032) (USD Billion)

12.4.14.2 Australia Digital Isolator Market Estimates and Forecasts, By Data Rate (2020-2032) (USD Billion)

12.4.14.3 Australia Digital Isolator Market Estimates and Forecasts, By Channel (2020-2032) (USD Billion)

12.4.14.4 Australia Digital Isolator Market Estimates and Forecasts, By Application (2020-2032) (USD Billion)

12.4.14.5 Australia Digital Isolator Market Estimates and Forecasts, By Vertical (2020-2032) (USD Billion)

12.4.15 Rest Of Asia Pacific

12.4.15.1 Rest Of Asia Pacific Digital Isolator Market Estimates and Forecasts, By Type (2020-2032) (USD Billion)

12.4.15.2 Rest Of Asia Pacific Digital Isolator Market Estimates and Forecasts, By Data Rate (2020-2032) (USD Billion)

12.4.15.3 Rest Of Asia Pacific Digital Isolator Market Estimates and Forecasts, By Channel (2020-2032) (USD Billion)

12.4.15.4 Rest Of Asia Pacific Digital Isolator Market Estimates and Forecasts, By Application (2020-2032) (USD Billion)

12.4.15.5 Rest Of Asia Pacific Digital Isolator Market Estimates and Forecasts, By Vertical (2020-2032) (USD Billion)

12.5 Middle East and Africa

12.5.1 Middle East

12.5.1.1 Trends Analysis

12.5.1.2 Middle East Digital Isolator Market Estimates and Forecasts, By Country (2020-2032) (USD Billion)

12.5.1.3 Middle East Digital Isolator Market Estimates and Forecasts, By Type (2020-2032) (USD Billion)

12.5.1.4 Middle East Digital Isolator Market Estimates and Forecasts, By Data Rate (2020-2032) (USD Billion)

12.5.1.5 Middle East Digital Isolator Market Estimates and Forecasts, By Channel (2020-2032) (USD Billion)

12.5.1.6 Middle East Digital Isolator Market Estimates and Forecasts, By Application (2020-2032) (USD Billion)

12.5.1.7 Middle East Digital Isolator Market Estimates and Forecasts, By Vertical (2020-2032) (USD Billion)

12.5.1.8 UAE

12.5.1.8.1 UAE Digital Isolator Market Estimates and Forecasts, By Type (2020-2032) (USD Billion)

12.5.1.8.2 UAE Digital Isolator Market Estimates and Forecasts, By Data Rate (2020-2032) (USD Billion)

12.5.1.8.3 UAE Digital Isolator Market Estimates and Forecasts, By Channel (2020-2032) (USD Billion)

12.5.1.8.4 UAE Digital Isolator Market Estimates and Forecasts, By Application (2020-2032) (USD Billion)

12.5.1.8.5 UAE Digital Isolator Market Estimates and Forecasts, By Vertical (2020-2032) (USD Billion)

12.5.1.9 Egypt

12.5.1.9.1 Egypt Digital Isolator Market Estimates and Forecasts, By Type (2020-2032) (USD Billion)

12.5.1.9.2 Egypt Digital Isolator Market Estimates and Forecasts, By Data Rate (2020-2032) (USD Billion)

12.5.1.9.3 Egypt Digital Isolator Market Estimates and Forecasts, By Channel (2020-2032) (USD Billion)

12.5.1.9.4 Egypt Digital Isolator Market Estimates and Forecasts, By Application (2020-2032) (USD Billion)

12.5.1.9.5 Egypt Digital Isolator Market Estimates and Forecasts, By Vertical (2020-2032) (USD Billion)

12.5.1.10 Saudi Arabia

12.5.1.10.1 Saudi Arabia Digital Isolator Market Estimates and Forecasts, By Type (2020-2032) (USD Billion)

12.5.1.10.2 Saudi Arabia Digital Isolator Market Estimates and Forecasts, By Data Rate (2020-2032) (USD Billion)

12.5.1.10.3 Saudi Arabia Digital Isolator Market Estimates and Forecasts, By Channel (2020-2032) (USD Billion)

12.5.1.10.4 Saudi Arabia Digital Isolator Market Estimates and Forecasts, By Application (2020-2032) (USD Billion)

12.5.1.10.5 Saudi Arabia Digital Isolator Market Estimates and Forecasts, By Vertical (2020-2032) (USD Billion)

12.5.1.11 Qatar

12.5.1.11.1 Qatar Digital Isolator Market Estimates and Forecasts, By Type (2020-2032) (USD Billion)

12.5.1.11.2 Qatar Digital Isolator Market Estimates and Forecasts, By Data Rate (2020-2032) (USD Billion)

12.5.1.11.3 Qatar Digital Isolator Market Estimates and Forecasts, By Channel (2020-2032) (USD Billion)

12.5.1.11.4 Qatar Digital Isolator Market Estimates and Forecasts, By Application (2020-2032) (USD Billion)

12.5.1.11.5 Qatar Digital Isolator Market Estimates and Forecasts, By Vertical (2020-2032) (USD Billion)

12.5.1.12 Rest Of Middle East

12.5.1.12.1 Rest Of Middle East Digital Isolator Market Estimates and Forecasts, By Type (2020-2032) (USD Billion)

12.5.1.12.2 Rest Of Middle East Digital Isolator Market Estimates and Forecasts, By Data Rate (2020-2032) (USD Billion)

12.5.1.12.3 Rest Of Middle East Digital Isolator Market Estimates and Forecasts, By Channel (2020-2032) (USD Billion)

12.5.1.12.4 Rest Of Middle East Digital Isolator Market Estimates and Forecasts, By Application (2020-2032) (USD Billion)

12.5.1.12.5 Rest Of Middle East Digital Isolator Market Estimates and Forecasts, By Vertical (2020-2032) (USD Billion)

12.5.2 Africa

12.5.2.1 Trends Analysis

12.5.2.2 Africa Digital Isolator Market Estimates and Forecasts, By Country (2020-2032) (USD Billion)

12.5.2.3 Africa Digital Isolator Market Estimates and Forecasts, By Type (2020-2032) (USD Billion)

12.5.2.4 Africa Digital Isolator Market Estimates and Forecasts, By Data Rate (2020-2032) (USD Billion)

12.5.2.5 Africa Digital Isolator Market Estimates and Forecasts, By Channel (2020-2032) (USD Billion)

12.5.2.6 Africa Digital Isolator Market Estimates and Forecasts, By Application (2020-2032) (USD Billion)

12.5.2.7 Africa Digital Isolator Market Estimates and Forecasts, By Vertical (2020-2032) (USD Billion)

12.5.2.8 South Africa

12.5.2.8.1 South Africa Digital Isolator Market Estimates and Forecasts, By Type (2020-2032) (USD Billion)

12.5.2.8.2 South Africa Digital Isolator Market Estimates and Forecasts, By Data Rate (2020-2032) (USD Billion)

12.5.2.8.3 South Africa Digital Isolator Market Estimates and Forecasts, By Channel (2020-2032) (USD Billion)

12.5.2.8.4 South Africa Digital Isolator Market Estimates and Forecasts, By Application (2020-2032) (USD Billion)

12.5.2.8.5 South Africa Digital Isolator Market Estimates and Forecasts, By Vertical (2020-2032) (USD Billion)

12.5.2.9 Nigeria

12.5.2.9.1 Nigeria Digital Isolator Market Estimates and Forecasts, By Type (2020-2032) (USD Billion)

12.5.2.9.2 Nigeria Digital Isolator Market Estimates and Forecasts, By Data Rate (2020-2032) (USD Billion)

12.5.2.9.3 Nigeria Digital Isolator Market Estimates and Forecasts, By Channel (2020-2032) (USD Billion)

12.5.2.9.4 Nigeria Digital Isolator Market Estimates and Forecasts, By Application (2020-2032) (USD Billion)

12.5.2.9.5 Nigeria Digital Isolator Market Estimates and Forecasts, By Vertical (2020-2032) (USD Billion)

12.5.2.10 Rest Of Africa

12.5.2.10.1 Rest Of Africa Digital Isolator Market Estimates and Forecasts, By Type (2020-2032) (USD Billion)

12.5.2.10.2 Rest Of Africa Digital Isolator Market Estimates and Forecasts, By Data Rate (2020-2032) (USD Billion)

12.5.2.10.3 Rest Of Africa Digital Isolator Market Estimates and Forecasts, By Channel (2020-2032) (USD Billion)

12.5.2.10.4 Rest Of Africa Digital Isolator Market Estimates and Forecasts, By Application (2020-2032) (USD Billion)

12.5.2.10.5 Rest Of Africa Digital Isolator Market Estimates and Forecasts, By Vertical (2020-2032) (USD Billion)

12.6 Latin America

12.6.1 Trends Analysis

12.6.2 Latin America Digital Isolator Market Estimates and Forecasts, By Country (2020-2032) (USD Billion)

12.6.3 Latin America Digital Isolator Market Estimates and Forecasts, By Type (2020-2032) (USD Billion)

12.6.4 Latin America Digital Isolator Market Estimates and Forecasts, By Data Rate (2020-2032) (USD Billion)

12.6.5 Latin America Digital Isolator Market Estimates and Forecasts, By Channel (2020-2032) (USD Billion)

12.6.6 Latin America Digital Isolator Market Estimates and Forecasts, By Application (2020-2032) (USD Billion)

12.6.7 Latin America Digital Isolator Market Estimates and Forecasts, By Vertical (2020-2032) (USD Billion)

12.6.8 Brazil

12.6.8.1 Brazil Digital Isolator Market Estimates and Forecasts, By Type (2020-2032) (USD Billion)

12.6.8.2 Brazil Digital Isolator Market Estimates and Forecasts, By Data Rate (2020-2032) (USD Billion)

12.6.8.3 Brazil Digital Isolator Market Estimates and Forecasts, By Channel (2020-2032) (USD Billion)

12.6.8.4 Brazil Digital Isolator Market Estimates and Forecasts, By Application (2020-2032) (USD Billion)

12.6.8.5 Brazil Digital Isolator Market Estimates and Forecasts, By Vertical (2020-2032) (USD Billion)

12.6.9 Argentina

12.6.9.1 Argentina Digital Isolator Market Estimates and Forecasts, By Type (2020-2032) (USD Billion)

12.6.9.2 Argentina Digital Isolator Market Estimates and Forecasts, By Data Rate (2020-2032) (USD Billion)

12.6.9.3 Argentina Digital Isolator Market Estimates and Forecasts, By Channel (2020-2032) (USD Billion)

12.6.9.4 Argentina Digital Isolator Market Estimates and Forecasts, By Application (2020-2032) (USD Billion)

12.6.9.5 Argentina Digital Isolator Market Estimates and Forecasts, By Vertical (2020-2032) (USD Billion)

12.6.10 Colombia

12.6.10.1 Colombia Digital Isolator Market Estimates and Forecasts, By Type (2020-2032) (USD Billion)

12.6.10.2 Colombia Digital Isolator Market Estimates and Forecasts, By Data Rate (2020-2032) (USD Billion)

12.6.10.3 Colombia Digital Isolator Market Estimates and Forecasts, By Channel (2020-2032) (USD Billion)

12.6.10.4 Colombia Digital Isolator Market Estimates and Forecasts, By Application (2020-2032) (USD Billion)

12.6.10.5 Colombia Digital Isolator Market Estimates and Forecasts, By Vertical (2020-2032) (USD Billion)

12.6.11 Rest Of Latin America

12.6.11.1 Rest Of Latin America Digital Isolator Market Estimates and Forecasts, By Type (2020-2032) (USD Billion)

12.6.11.2 Rest Of Latin America Digital Isolator Market Estimates and Forecasts, By Data Rate (2020-2032) (USD Billion)

12.6.11.3 Rest Of Latin America Digital Isolator Market Estimates and Forecasts, By Channel (2020-2032) (USD Billion)

12.6.11.4 Rest Of Latin America Digital Isolator Market Estimates and Forecasts, By Application (2020-2032) (USD Billion)

12.6.11.5 Rest Of Latin America Digital Isolator Market Estimates and Forecasts, By Vertical (2020-2032) (USD Billion)

13. Company Profiles

10.1 Texas Instruments

10.1.1 Company Overview

10.1.2 Financial

10.1.3 Products/ Services Offered

110.1.4 SWOT Analysis

10.2 Analog Devices

10.2.1 Company Overview

10.2.2 Financial

10.2.3 Products/ Services Offered

10.2.4 SWOT Analysis

10.3 Infineon Technologies.

10.3.1 Company Overview

10.3.2 Financial

10.3.3 Products/ Services Offered

10.3.4 SWOT Analysis

10.4 STMicroelectronics

10.4.1 Company Overview

10.4.2 Financial

10.4.3 Products/ Services Offered

10.4.4 SWOT Analysis

10.5 Vicor Corporation

10.5.1 Company Overview

10.5.2 Financial

10.5.3 Products/ Services Offered

10.5.4 SWOT Analysis

10.6 Silicon Labs

10.6.1 Company Overview

10.6.2 Financial

10.6.3 Products/ Services Offered

10.6.4 SWOT Analysis

10.7 Broadcom

10.7.1 Company Overview

10.7.2 Financial

10.7.3 Products/ Services Offered

10.7.4 SWOT Analysis

10.8 NXP Semiconductors

10.8.1 Company Overview

10.8.2 Financial

10.8.3 Products/ Services Offered

10.8.4 SWOT Analysis

10.9 Maxim Integrated

10.9.1 Company Overview

10.9.2 Financial

10.9.3 Products/ Services Offered

10.9.4 SWOT Analysis

10.10 Rohm Semiconductor

             10.9.1 Company Overview

10.9.2 Financial

10.9.3 Products/ Services Offered

10.9.4 SWOT Analysis

14. Use Cases and Best Practices

15. Conclusion

An accurate research report requires proper strategizing as well as implementation. There are multiple factors involved in the completion of good and accurate research report and selecting the best methodology to compete the research is the toughest part. Since the research reports we provide play a crucial role in any company’s decision-making process, therefore we at SNS Insider always believe that we should choose the best method which gives us results closer to reality. This allows us to reach at a stage wherein we can provide our clients best and accurate investment to output ratio.

Each report that we prepare takes a timeframe of 350-400 business hours for production. Starting from the selection of titles through a couple of in-depth brain storming session to the final QC process before uploading our titles on our website we dedicate around 350 working hours. The titles are selected based on their current market cap and the foreseen CAGR and growth.


The 5 steps process:

Step 1: Secondary Research:

Secondary Research or Desk Research is as the name suggests is a research process wherein, we collect data through the readily available information. In this process we use various paid and unpaid databases which our team has access to and gather data through the same. This includes examining of listed companies’ annual reports, Journals, SEC filling etc. Apart from this our team has access to various associations across the globe across different industries. Lastly, we have exchange relationships with various university as well as individual libraries.

Secondary Research

Step 2: Primary Research

When we talk about primary research, it is a type of study in which the researchers collect relevant data samples directly, rather than relying on previously collected data.  This type of research is focused on gaining content specific facts that can be sued to solve specific problems. Since the collected data is fresh and first hand therefore it makes the study more accurate and genuine.

We at SNS Insider have divided Primary Research into 2 parts.

Part 1 wherein we interview the KOLs of major players as well as the upcoming ones across various geographic regions. This allows us to have their view over the market scenario and acts as an important tool to come closer to the accurate market numbers. As many as 45 paid and unpaid primary interviews are taken from both the demand and supply side of the industry to make sure we land at an accurate judgement and analysis of the market.

This step involves the triangulation of data wherein our team analyses the interview transcripts, online survey responses and observation of on filed participants. The below mentioned chart should give a better understanding of the part 1 of the primary interview.

Primary Research

Part 2: In this part of primary research the data collected via secondary research and the part 1 of the primary research is validated with the interviews from individual consultants and subject matter experts.

Consultants are those set of people who have at least 12 years of experience and expertise within the industry whereas Subject Matter Experts are those with at least 15 years of experience behind their back within the same space. The data with the help of two main processes i.e., FGDs (Focused Group Discussions) and IDs (Individual Discussions). This gives us a 3rd party nonbiased primary view of the market scenario making it a more dependable one while collation of the data pointers.

Step 3: Data Bank Validation

Once all the information is collected via primary and secondary sources, we run that information for data validation. At our intelligence centre our research heads track a lot of information related to the market which includes the quarterly reports, the daily stock prices, and other relevant information. Our data bank server gets updated every fortnight and that is how the information which we collected using our primary and secondary information is revalidated in real time.

Data Bank Validation

Step 4: QA/QC Process

After all the data collection and validation our team does a final level of quality check and quality assurance to get rid of any unwanted or undesired mistakes. This might include but not limited to getting rid of the any typos, duplication of numbers or missing of any important information. The people involved in this process include technical content writers, research heads and graphics people. Once this process is completed the title gets uploader on our platform for our clients to read it.

Step 5: Final QC/QA Process:

This is the last process and comes when the client has ordered the study. In this process a final QA/QC is done before the study is emailed to the client. Since we believe in giving our clients a good experience of our research studies, therefore, to make sure that we do not lack at our end in any way humanly possible we do a final round of quality check and then dispatch the study to the client.

Key Segments:

By Type

  • Capacitive Coupling

  • GMR

  • Magnetic Coupling

By Data Rate

  • Less Than 25 Mbps

  • 25 Mbps to 75 Mbps

  • above 75 Mbps

By Channel

  • Channel Two

  • Channel Four

  • Channel Six

  • Channel Eight

By Application

  • Gate Drivers

  • DC/DC Converter

  • ADC

By Vertical

  • Industrial

  • Healthcare

  • Automotive

  • Telecommunication

  • Aerospace & Defence

  • Energy & Power

Request for Segment Customization as per your Business Requirement: Segment Customization Request

Regional Coverage:

North America

  • US

  • Canada

  • Mexico

Europe

  • Eastern Europe

    • Poland

    • Romania

    • Hungary

    • Turkey

    • Rest of Eastern Europe

  • Western Europe

    • Germany

    • France

    • UK

    • Italy

    • Spain

    • Netherlands

    • Switzerland

    • Austria

    • Rest of Western Europe

Asia Pacific

  • China

  • India

  • Japan

  • South Korea

  • Vietnam

  • Singapore

  • Australia

  • Rest of Asia Pacific

Middle East & Africa

  • Middle East

    • UAE

    • Egypt

    • Saudi Arabia

    • Qatar

    • Rest of Middle East

  • Africa

    • Nigeria

    • South Africa

    • Rest of Africa

Latin America

  • Brazil

  • Argentina

  • Colombia

  • Rest of Latin America

Request for Country Level Research Report: Country Level Customization Request

Available Customization

With the given market data, SNS Insider offers customization as per the company’s specific needs. The following customization options are available for the report:

  • Detailed Volume Analysis

  • Criss-Cross segment analysis (e.g. Product X Application)

  • Competitive Product Benchmarking

  • Geographic Analysis

  • Additional countries in any of the regions

  • Customized Data Representation

  • Detailed analysis and profiling of additional market players


  •            5000 (33% Discount)


  •            8950 (40% Discount)


  •            3050 (23% Discount)

Start a Conversation

Hi! Click one of our member below to chat on Phone