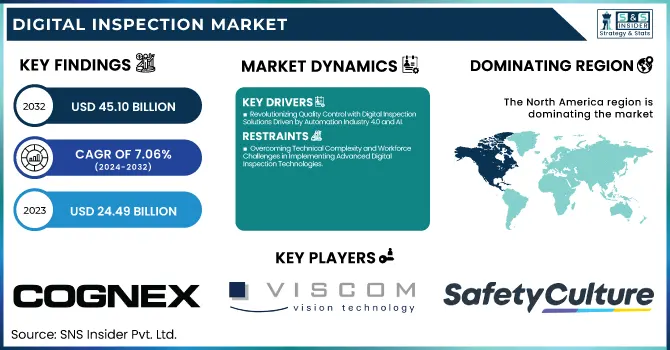
The Digital Inspection Market Size was valued at USD 24.49 Billion in 2023 and is expected to reach USD 45.10 Billion by 2032 and grow at a CAGR of 7.06% over the forecast period 2024-2032. The growing need for precision, efficiency, and regulatory compliance is propelling the digital inspection market for diverse uses across evolving industry verticals. Improvements in performance Accurate devices Improvements to high-resolution imaging, cloud-enabled inspection through the Internet of Things (IoT), and cloud-enabled analytics are enhancing performance.
To Get more information on Digital Inspection Market - Request Free Sample Report
The use of AI and automation has enhanced real-time fault detection, predictive maintenance, and adaptive learning capabilities. For specific inspection traditional methods are being replaced by new-age technologies, thanks to better 3D metrology, non-destructive testing (NDT), and machine vision which are helping improve accuracy and throughput while reducing the possibility of human error. Such improvements enable the market to grow as a whole and make inspection smarter, more scalable, and more economically efficient across sectors.
The U.S. market for Digital Inspection was valued at USD 6.37 Billion in 2023 and is expected to attain a CAGR of 6.73% between 2024 and 2032. The U.S. market for digital inspection is driven by stringent product quality regulations, high adoption of advanced manufacturing, increased automation, growing use of AI-enabled inspection solutions for defect detection, and strong industrial digitization initiatives.
Key Drivers:
Revolutionizing Quality Control with Digital Inspection Solutions Driven by Automation Industry 4.0 and AI
The rise of automation and Industry 4.0 has also driven demand for digital inspection solutions across industries, with growing quality control, lower defects, and improved efficiency. The demand for advanced inspection technologies is further driven by stringent regulatory compliance and safety standards prevalent across the automotive, aerospace, and, oil & gas industries. The increasing adoption of AI, machine learning, and IoT in the digital inspection space also improves real-time defect identification and predictive maintenance, resulting in lower downtime and operational costs. As the semiconductor and electronics industry continues to grow exponentially, there is an increasing demand for precision inspection systems to ensure product integrity at miniaturized levels.
Restrain:
Overcoming Technical Complexity and Workforce Challenges in Implementing Advanced Digital Inspection Technologies
Some of the key factors restraining the market growth are the rise in technical complexity and the integration of digital inspection systems. Specialized expertise, combined with the ability to integrate seamlessly with existing manufacturing processes, is required when implementing more advanced inspection technologies such as machine vision driven by AI, 3D metrology, or non-destructive testing (NDT). This represents a major challenge across several industries, especially small and medium enterprises (SMEs) that are facing a deficit of qualified personnel, alongside the extensive training that would be needed in many cases, to enable the use of these technologies. Furthermore, parsing between distinct hardware and software solutions poses an additional barrier to achieving a seamless, automated inspection pipeline.
Opportunity:
Expanding Opportunities in Digital Inspection with 3D AI Cloud Solutions and Growing Industrial Automation
This market provides ample space considering the advent of 3D inspection and AI-based inspection solutions. With cloud-based Digital inspection and remote monitoring being the new normal, an increasing shift in the trend creates newer opportunities for Scalable and Economical solutions. There is also a growing acceptance of non-destructive testing (NDT) in sectors like aerospace and infrastructure development which is creating huge opportunities. In addition, several economies in Asia-Pacific and Latin America are emerging, indicating an increasing opportunity owing to industrialization, ongoing smart manufacturing initiatives, and rising investments in automation technologies in these regions.
Challenges:
Addressing Data Security Privacy and Standardization Challenges in AI and IoT-Enabled Digital Inspection
Data security and privacy issues related to the cloud and using AI-driven inspection solutions are other pertinent challenges. The growing dependency on IoT-enabled digital inspection systems has made businesses prone to cybersecurity attacks, data breaches, and theft of intellectual property. Also, compliance with stringent data protection laws continues to be a major obstacle, especially for sensitive industries such as aerospace and defense. Further, the lack of standardization of digital inspection protocols across industries creates barriers to widespread adoption, resulting in inefficiencies around implementation and interoperability between different inspection technologies.
By Dimension
The 3D accounted for a dominant portion of the global market in 2023, with a 63.2% cumulative share, and is projected to reach the fastest CAGR over the forecast period from 2024 to 2032, due to the high precision, accuracy, and capacity of creating large surface and structural data sets (the product of the 3D measurement technologies), making easier quantitative analysis. Market growth can be attributed to the rising adoption of AI-based 3D inspection systems in various industries including automotive, aerospace, electronics, and pharmaceuticals among others. In contrast to legacy 2D inspection, 3D inspection is capable of full defect detection, accurate measurements, and in-line quality control, and is a crucial component of modern manufacturing and industrial automation.
By Technology
Machine vision is the most prominent technology segment, which accounted for 47.7% of the digital inspection market in 2023 due to widespread application in automation quality control, defect detection, and high-throughput inspection in the automotive, electronics, and manufacturing industries, among others. With the higher adoption of AI-driven Vision systems, deep learning algorithms have improved the accuracy level as well as assisted in providing a real-time analysis while reducing human interference. With its high precision and automation capabilities, machine vision has become a common choice among manufacturers that require large-scale production lines.
The non-destructive testing (NDT) segment is anticipated to fast CAGR throughout 2024-2032 owing to increasing application in safety-critical industries such as aerospace, oil & gas, and infrastructure. The rising demand for structural health monitoring, predictive maintenance, and stringent safety regulations is expected to drive the adoption of NDT. Continuous innovation in ultrasonic, radiographic, and thermographic inspection techniques will continue to raise the demand for the market.
By Component
The hardware segment topped the digital inspection market in 2023, accounting for 56.7% of the market share, attributed to the high consumption volumes for cameras, sensors, scanners, and other equipment used in inspection systems. A rise in demand for machine vision, 3D metrology, and non-destructive testing (NDT) solutions has driven the need for improved hardware components. Precise inspection hardware is the backbone of various high-precision industries like automotive, aerospace, and electronics, where engineers leave no one unturned to assure quality, test metrics, and compliance with safety standards.
From 2024-2032, the software segment is predicted to develop at a most file-breaking CAGR, propelled using exploitation in AI, system studying, and cloud-based inspection solutions. Digital Inspection Software Continues to Evolve With the growing capabilities of real-time data analytics, automation, and predictive maintenance, digital inspection software is also evolving. With the trigger to Smart Manufacturing and Industry 4.0, different solutions will come into prominence but overall software-driven solutions will be the most powerful enablers optimizing efficiency and increased defect detection accuracy.
By Vertical
The largest digital inspection market segment in 2023 was manufacturing, which accounted for 31.6% of the market share, driven by a greater implementation of automated quality control, defect detection, and precision inspection in industrial production. Over the last few years, the demand for digital inspection solutions has increased, owing to the growing adoption of Industry 4.0, robotics, and smart manufacturing to improve efficiency and reduce errors. From automotive to aerospace to consumer goods, manufacturers are adopting machine vision, 3D metrology, and non-destructive (NDT) testing to ensure quality, reduce waste, and meet strict regulatory standards.
During the period 2024-2032, the electronics and semiconductor sector is anticipated to reach a maximum CAGR due to the miniaturization of electronic components, increasing demand for high-precision inspection, and rapid development of semiconductor fabrication. Automated optical inspection (AOI) and metrology systems are being used in conjunction with AI-powered inspection solutions that are increasing in adoption to ensure defect-free production in chips, circuits, and electronic assemblies consequently increasing the market opportunity being held by such solutions.
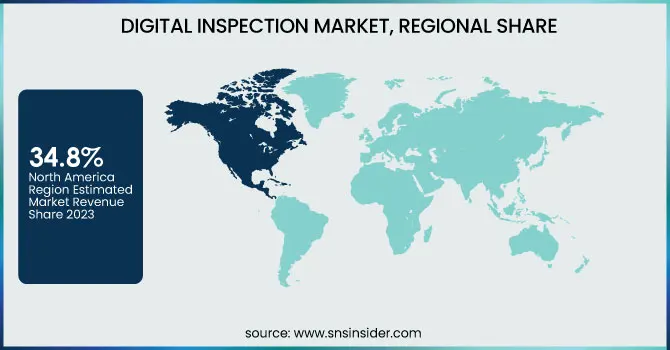
North America held the largest share of the digital inspection market in 2023 at 34.8%, owing to the large presence of technologically advanced manufacturing, aerospace, and automotive industries. Increasing adoption of AI-based machine vision systems, stringent quality regulations, and large investments in Industry 4.0 and automation have led to growth in this region. Cognex Corporation (U.S.) and General Electric (U.S.) are a few of the prominent market players steering innovative digital inspection solutions. For instance, Tesla relies heavily on machine vision, and automated optical inspection (AOI) in its Gigafactories to achieve high levels of precision in EV manufacturing. Likewise, Boeing uses non-destructive testing (NDT) technologies to inspect aircraft components to ensure they are structurally sound and safe to operate.
The Asia Pacific region is anticipated to witness the highest growth rate over the forecasted duration of 2024-2032 due to swift industrial growth, a fast-growing adoption of smart manufacturing, and robust government initiatives supporting automation specifically across China, Japan, and India. The electronics and semiconductor industry is one of the major propellers TSMC (Taiwan Semiconductor Manufacturing Company) is one of the companies utilizing 3D metrology and AI-powered inspection to deliver defect-free semiconductors. We are seeing this strategy in place in China where BYD and Huawei are ramping up machine vision and an AI-based inspection process for improved quality control in automotive and consumer electronics manufacturing. Market expansion will be largely fuelled in this area by the still-strong manufacturing base and the growing demand for high-precision inspection systems.
Get Customized Report as per Your Business Requirement - Enquiry Now
Some of the major players in the Digital Inspection Market are:
Cognex Corporation (In-Sight)
Viscom AG (3D AOI Systems)
SafetyCulture (iAuditor)
UVeye (Vehicle Inspection Systems)
Wabtec Corporation (Remote Visual Inspection Solutions)
Axonator (Digital Inspection Software)
MISTRAS Group (Smart NDT Solutions)
Nikon Metrology (XT H 225 ST)
Zetec (UltraVision)
SPECTOR (ThermoScan)
Shenzhen Sipotek Info Technology Co., Ltd. (Automated Optical Inspection Machines)
Olympus Corporation (OmniScan X3)
GE Inspection Technologies (Mentor Visual iQ)
Carl Zeiss AG (ZEISS Metrotom)
Hexagon AB (Leica Absolute Tracker)
In January 2025, Cognex launched the DataMan 290 and DataMan 390 barcode readers, featuring AI-driven decoding, enhanced lighting, and intuitive setup to improve efficiency in industrial applications.
In September 2024, Viscom Inc. introduced the iX7059 PCB Inspection XL and iX7059 One, featuring cutting-edge 3D X-ray and AI-driven AOI technology to enhance defect detection and quality assurance in electronics manufacturing.
| Report Attributes | Details |
|---|---|
| Market Size in 2023 | USD 24.49 Billion |
| Market Size by 2032 | USD 45.10 Billion |
| CAGR | CAGR of 7.06 % From 2024 to 2032 |
| Base Year | 2023 |
| Forecast Period | 2024-2032 |
| Historical Data | 2020-2022 |
| Report Scope & Coverage | Market Size, Segments Analysis, Competitive Landscape, Regional Analysis, DROC & SWOT Analysis, Forecast Outlook |
| Key Segments | • By Dimension (2D, 3D) • By Technology (Machine Vision, Metrology, NDT) • By Component (Hardware, Software, Services) • By Vertical (Manufacturing, Electronics and Semiconductor, Oil & Gas, Aerospace & Defense, Automotive) |
| Regional Analysis/Coverage | North America (US, Canada, Mexico), Europe (Eastern Europe [Poland, Romania, Hungary, Turkey, Rest of Eastern Europe] Western Europe] Germany, France, UK, Italy, Spain, Netherlands, Switzerland, Austria, Rest of Western Europe]), Asia Pacific (China, India, Japan, South Korea, Vietnam, Singapore, Australia, Rest of Asia Pacific), Middle East & Africa (Middle East [UAE, Egypt, Saudi Arabia, Qatar, Rest of Middle East], Africa [Nigeria, South Africa, Rest of Africa], Latin America (Brazil, Argentina, Colombia, Rest of Latin America) |
| Company Profiles | Cognex Corporation, Viscom AG, SafetyCulture, UVeye, Wabtec Corporation, Axonator, MISTRAS Group, Nikon Metrology, Zetec, SPECTOR, Shenzhen Sipotek Info Technology Co., Ltd., Olympus Corporation, GE Inspection Technologies, Carl Zeiss AG, Hexagon AB. |
Ans: The Digital Inspection Market is expected to grow at a CAGR of 7.08%.
Ans: The Digital Inspection Market size was USD 24.49 Billion in 2023 and is expected to Reach USD 45.10 Billion by 2032.
Ans: The major key drivers for the growth of the Digital Inspection Market include increasing automation, stringent quality regulations, advancements in AI & machine vision, rising industrial digitization, and growing demand for cost-effective defect detection.
Ans: The 3D segment dominated the Digital Inspection market in 2023.
Ans: In 2023, the North American region led the Digital Inspection market, capturing approximately 34.83% of the total market share.
1. Introduction
1.1 Market Definition
1.2 Scope (Inclusion and Exclusions)
1.3 Research Assumptions
2. Executive Summary
2.1 Market Overview
2.2 Regional Synopsis
2.3 Competitive Summary
3. Research Methodology
3.1 Top-Down Approach
3.2 Bottom-up Approach
3.3. Data Validation
3.4 Primary Interviews
4. Market Dynamics Impact Analysis
4.1 Market Driving Factors Analysis
4.1.1 Drivers
4.1.2 Restraints
4.1.3 Opportunities
4.1.4 Challenges
4.2 PESTLE Analysis
4.3 Porter’s Five Forces Model
5. Statistical Insights and Trends Reporting
5.1 Adoption & Utilization
5.2 Inspection System Performance & Efficiency
5.3 AI & Advanced Technology Adoption
5.4 Supply Chain & Operational Metrics
6. Competitive Landscape
6.1 List of Major Companies, By Region
6.2 Market Share Analysis, By Region
6.3 Product Benchmarking
6.3.1 Product specifications and features
6.3.2 Pricing
6.4 Strategic Initiatives
6.4.1 Marketing and promotional activities
6.4.2 Distribution and Supply Chain Strategies
6.4.3 Expansion plans and new product launches
6.4.4 Strategic partnerships and collaborations
6.5 Technological Advancements
6.6 Market Positioning and Branding
7. Digital Inspection Market Segmentation, By Dimension
7.1 Chapter Overview
7.2 2D
7.2.1 2D Market Trends Analysis (2020-2032)
7.2.2 2D Market Size Estimates and Forecasts to 2032 (USD Billion)
7.3 3D
7.3.1 3D Trends Analysis (2020-2032)
7.3.2 3D Estimates and Forecasts to 2032 (USD Billion)
8. Digital Inspection Market Segmentation, By Technology
8.1 Chapter Overview
8.2 Machine Vision
8.2.1 Machine Vision Market Trends Analysis (2020-2032)
8.2.2 Machine Vision Market Size Estimates and Forecasts to 2032 (USD Billion)
8.3 Metrology
8.3.1 Metrology Market Trends Analysis (2020-2032)
8.3.2 Metrology Market Size Estimates and Forecasts to 2032 (USD Billion)
8.4 NDT
8.4.1 NDT Market Trends Analysis (2020-2032)
8.4.2 NDT Market Size Estimates and Forecasts to 2032 (USD Billion)
9. Digital Inspection Market Segmentation, By Component
9.1 Chapter Overview
9.2 Hardware
9.2.1 Hardware Market Trends Analysis (2020-2032)
9.2.2 Hardware Market Size Estimates and Forecasts to 2032 (USD Billion)
9.3 Software
9.3.1 Software Market Trends Analysis (2020-2032)
9.3.2 Software Market Size Estimates and Forecasts to 2032 (USD Billion)
9.4 Services
9.4.1 Services Market Trends Analysis (2020-2032)
9.4.2 Services Market Size Estimates and Forecasts to 2032 (USD Billion)
10. Digital Inspection Market Segmentation, By Vertical
10.1 Chapter Overview
10.2 Manufacturing
10.2.1 Manufacturing Market Trends Analysis (2020-2032)
10.2.2 Manufacturing Market Size Estimates and Forecasts to 2032 (USD Billion)
10.3 Electronics and Semiconductor
10.3.1 Electronics and Semiconductor Market Trends Analysis (2020-2032)
10.3.2 Electronics and Semiconductor Market Size Estimates and Forecasts to 2032 (USD Billion)
10.4 Oil & Gas
10.4.1 Oil & Gas Market Trends Analysis (2020-2032)
10.4.2 Oil & Gas Market Size Estimates and Forecasts to 2032 (USD Billion)
10.5 Aerospace & Defense
10.5.1 Aerospace & Defense Market Trends Analysis (2020-2032)
10.5.2 Aerospace & Defense Market Size Estimates and Forecasts to 2032 (USD Billion)
10.6 Automotive
10.6.1 Automotive Market Trends Analysis (2020-2032)
10.6.2 Automotive Market Size Estimates and Forecasts to 2032 (USD Billion)
11. Regional Analysis
11.1 Chapter Overview
11.2 North America
11.2.1 Trends Analysis
11.2.2 North America Digital Inspection Market Estimates and Forecasts, by Country (2020-2032) (USD Billion)
11.2.3 North America Digital Inspection Market Estimates and Forecasts, By Dimension (2020-2032) (USD Billion)
11.2.4 North America Digital Inspection Market Estimates and Forecasts, By Technology (2020-2032) (USD Billion)
11.2.5 North America Digital Inspection Market Estimates and Forecasts, By Component (2020-2032) (USD Billion)
11.2.6 North America Digital Inspection Market Estimates and Forecasts, By Vertical (2020-2032) (USD Billion)
11.2.7 USA
11.2.7.1 USA Digital Inspection Market Estimates and Forecasts, By Dimension (2020-2032) (USD Billion)
11.2.7.2 USA Digital Inspection Market Estimates and Forecasts, By Technology (2020-2032) (USD Billion)
11.2.7.3 USA Digital Inspection Market Estimates and Forecasts, By Component (2020-2032) (USD Billion)
11.2.7.4 USA Digital Inspection Market Estimates and Forecasts, By Vertical (2020-2032) (USD Billion)
11.2.8 Canada
11.2.8.1 Canada Digital Inspection Market Estimates and Forecasts, By Dimension (2020-2032) (USD Billion)
11.2.8.2 Canada Digital Inspection Market Estimates and Forecasts, By Technology (2020-2032) (USD Billion)
11.2.8.3 Canada Digital Inspection Market Estimates and Forecasts, By Component (2020-2032) (USD Billion)
11.2.8.4 Canada Digital Inspection Market Estimates and Forecasts, By Vertical (2020-2032) (USD Billion)
11.2.9 Mexico
11.2.9.1 Mexico Digital Inspection Market Estimates and Forecasts, By Dimension (2020-2032) (USD Billion)
11.2.9.2 Mexico Digital Inspection Market Estimates and Forecasts, By Technology (2020-2032) (USD Billion)
11.2.9.3 Mexico Digital Inspection Market Estimates and Forecasts, By Component (2020-2032) (USD Billion)
11.2.9.4 Mexico Digital Inspection Market Estimates and Forecasts, By Vertical (2020-2032) (USD Billion)
11.3 Europe
11.3.1 Eastern Europe
11.3.1.1 Trends Analysis
11.3.1.2 Eastern Europe Digital Inspection Market Estimates and Forecasts, by Country (2020-2032) (USD Billion)
11.3.1.3 Eastern Europe Digital Inspection Market Estimates and Forecasts, By Dimension (2020-2032) (USD Billion)
11.3.1.4 Eastern Europe Digital Inspection Market Estimates and Forecasts, By Technology (2020-2032) (USD Billion)
11.3.1.5 Eastern Europe Digital Inspection Market Estimates and Forecasts, By Component (2020-2032) (USD Billion)
11.3.1.6 Eastern Europe Digital Inspection Market Estimates and Forecasts, By Vertical (2020-2032) (USD Billion)
11.3.1.7 Poland
11.3.1.7.1 Poland Digital Inspection Market Estimates and Forecasts, By Dimension (2020-2032) (USD Billion)
11.3.1.7.2 Poland Digital Inspection Market Estimates and Forecasts, By Technology (2020-2032) (USD Billion)
11.3.1.7.3 Poland Digital Inspection Market Estimates and Forecasts, By Component (2020-2032) (USD Billion)
11.3.1.7.4 Poland Digital Inspection Market Estimates and Forecasts, By Vertical (2020-2032) (USD Billion)
11.3.1.8 Romania
11.3.1.8.1 Romania Digital Inspection Market Estimates and Forecasts, By Dimension (2020-2032) (USD Billion)
11.3.1.8.2 Romania Digital Inspection Market Estimates and Forecasts, By Technology (2020-2032) (USD Billion)
11.3.1.8.3 Romania Digital Inspection Market Estimates and Forecasts, By Component (2020-2032) (USD Billion)
11.3.1.8.4 Romania Digital Inspection Market Estimates and Forecasts, By Vertical (2020-2032) (USD Billion)
11.3.1.9 Hungary
11.3.1.9.1 Hungary Digital Inspection Market Estimates and Forecasts, By Dimension (2020-2032) (USD Billion)
11.3.1.9.2 Hungary Digital Inspection Market Estimates and Forecasts, By Technology (2020-2032) (USD Billion)
11.3.1.9.3 Hungary Digital Inspection Market Estimates and Forecasts, By Component (2020-2032) (USD Billion)
11.3.1.9.4 Hungary Digital Inspection Market Estimates and Forecasts, By Vertical (2020-2032) (USD Billion)
11.3.1.10 Turkey
11.3.1.10.1 Turkey Digital Inspection Market Estimates and Forecasts, By Dimension (2020-2032) (USD Billion)
11.3.1.10.2 Turkey Digital Inspection Market Estimates and Forecasts, By Technology (2020-2032) (USD Billion)
11.3.1.10.3 Turkey Digital Inspection Market Estimates and Forecasts, By Component (2020-2032) (USD Billion)
11.3.1.10.4 Turkey Digital Inspection Market Estimates and Forecasts, By Vertical (2020-2032) (USD Billion)
11.3.1.11 Rest of Eastern Europe
11.3.1.11.1 Rest of Eastern Europe Digital Inspection Market Estimates and Forecasts, By Dimension (2020-2032) (USD Billion)
11.3.1.11.2 Rest of Eastern Europe Digital Inspection Market Estimates and Forecasts, By Technology (2020-2032) (USD Billion)
11.3.1.11.3 Rest of Eastern Europe Digital Inspection Market Estimates and Forecasts, By Component (2020-2032) (USD Billion)
11.3.1.11.4 Rest of Eastern Europe Digital Inspection Market Estimates and Forecasts, By Vertical (2020-2032) (USD Billion)
11.3.2 Western Europe
11.3.2.1 Trends Analysis
11.3.2.2 Western Europe Digital Inspection Market Estimates and Forecasts, by Country (2020-2032) (USD Billion)
11.3.2.3 Western Europe Digital Inspection Market Estimates and Forecasts, By Dimension (2020-2032) (USD Billion)
11.3.2.4 Western Europe Digital Inspection Market Estimates and Forecasts, By Technology (2020-2032) (USD Billion)
11.3.2.5 Western Europe Digital Inspection Market Estimates and Forecasts, By Component (2020-2032) (USD Billion)
11.3.2.6 Western Europe Digital Inspection Market Estimates and Forecasts, By Vertical (2020-2032) (USD Billion)
11.3.2.7 Germany
11.3.2.7.1 Germany Digital Inspection Market Estimates and Forecasts, By Dimension (2020-2032) (USD Billion)
11.3.2.7.2 Germany Digital Inspection Market Estimates and Forecasts, By Technology (2020-2032) (USD Billion)
11.3.2.7.3 Germany Digital Inspection Market Estimates and Forecasts, By Component (2020-2032) (USD Billion)
11.3.2.7.4 Germany Digital Inspection Market Estimates and Forecasts, By Vertical (2020-2032) (USD Billion)
11.3.2.8 France
11.3.2.8.1 France Digital Inspection Market Estimates and Forecasts, By Dimension (2020-2032) (USD Billion)
11.3.2.8.2 France Digital Inspection Market Estimates and Forecasts, By Technology (2020-2032) (USD Billion)
11.3.2.8.3 France Digital Inspection Market Estimates and Forecasts, By Component (2020-2032) (USD Billion)
11.3.2.8.4 France Digital Inspection Market Estimates and Forecasts, By Vertical (2020-2032) (USD Billion)
11.3.2.9 UK
11.3.2.9.1 UK Digital Inspection Market Estimates and Forecasts, By Dimension (2020-2032) (USD Billion)
11.3.2.9.2 UK Digital Inspection Market Estimates and Forecasts, By Technology (2020-2032) (USD Billion)
11.3.2.9.3 UK Digital Inspection Market Estimates and Forecasts, By Component (2020-2032) (USD Billion)
11.3.2.9.4 UK Digital Inspection Market Estimates and Forecasts, By Vertical (2020-2032) (USD Billion)
11.3.2.10 Italy
11.3.2.10.1 Italy Digital Inspection Market Estimates and Forecasts, By Dimension (2020-2032) (USD Billion)
11.3.2.10.2 Italy Digital Inspection Market Estimates and Forecasts, By Technology (2020-2032) (USD Billion)
11.3.2.10.3 Italy Digital Inspection Market Estimates and Forecasts, By Component (2020-2032) (USD Billion)
11.3.2.10.4 Italy Digital Inspection Market Estimates and Forecasts, By Vertical (2020-2032) (USD Billion)
11.3.2.11 Spain
11.3.2.11.1 Spain Digital Inspection Market Estimates and Forecasts, By Dimension (2020-2032) (USD Billion)
11.3.2.11.2 Spain Digital Inspection Market Estimates and Forecasts, By Technology (2020-2032) (USD Billion)
11.3.2.11.3 Spain Digital Inspection Market Estimates and Forecasts, By Component (2020-2032) (USD Billion)
11.3.2.11.4 Spain Digital Inspection Market Estimates and Forecasts, By Vertical (2020-2032) (USD Billion)
11.3.2.12 Netherlands
11.3.2.12.1 Netherlands Digital Inspection Market Estimates and Forecasts, By Dimension (2020-2032) (USD Billion)
11.3.2.12.2 Netherlands Digital Inspection Market Estimates and Forecasts, By Technology (2020-2032) (USD Billion)
11.3.2.12.3 Netherlands Digital Inspection Market Estimates and Forecasts, By Component (2020-2032) (USD Billion)
11.3.2.12.4 Netherlands Digital Inspection Market Estimates and Forecasts, By Vertical (2020-2032) (USD Billion)
11.3.2.13 Switzerland
11.3.2.13.1 Switzerland Digital Inspection Market Estimates and Forecasts, By Dimension (2020-2032) (USD Billion)
11.3.2.13.2 Switzerland Digital Inspection Market Estimates and Forecasts, By Technology (2020-2032) (USD Billion)
11.3.2.13.3 Switzerland Digital Inspection Market Estimates and Forecasts, By Component (2020-2032) (USD Billion)
11.3.2.13.4 Switzerland Digital Inspection Market Estimates and Forecasts, By Vertical (2020-2032) (USD Billion)
11.3.2.14 Austria
11.3.2.14.1 Austria Digital Inspection Market Estimates and Forecasts, By Dimension (2020-2032) (USD Billion)
11.3.2.14.2 Austria Digital Inspection Market Estimates and Forecasts, By Technology (2020-2032) (USD Billion)
11.3.2.14.3 Austria Digital Inspection Market Estimates and Forecasts, By Component (2020-2032) (USD Billion)
11.3.2.14.4 Austria Digital Inspection Market Estimates and Forecasts, By Vertical (2020-2032) (USD Billion)
11.3.2.15 Rest of Western Europe
11.3.2.15.1 Rest of Western Europe Digital Inspection Market Estimates and Forecasts, By Dimension (2020-2032) (USD Billion)
11.3.2.15.2 Rest of Western Europe Digital Inspection Market Estimates and Forecasts, By Technology (2020-2032) (USD Billion)
11.3.2.15.3 Rest of Western Europe Digital Inspection Market Estimates and Forecasts, By Component (2020-2032) (USD Billion)
11.3.2.15.4 Rest of Western Europe Digital Inspection Market Estimates and Forecasts, By Vertical (2020-2032) (USD Billion)
11.4 Asia-Pacific
11.4.1 Trends Analysis
11.4.2 Asia-Pacific Digital Inspection Market Estimates and Forecasts, by Country (2020-2032) (USD Billion)
11.4.3 Asia-Pacific Digital Inspection Market Estimates and Forecasts, By Dimension (2020-2032) (USD Billion)
11.4.4 Asia-Pacific Digital Inspection Market Estimates and Forecasts, By Technology (2020-2032) (USD Billion)
11.4.5 Asia-Pacific Digital Inspection Market Estimates and Forecasts, By Component (2020-2032) (USD Billion)
11.4.6 Asia-Pacific Digital Inspection Market Estimates and Forecasts, By Vertical (2020-2032) (USD Billion)
11.4.7 China
11.4.7.1 China Digital Inspection Market Estimates and Forecasts, By Dimension (2020-2032) (USD Billion)
11.4.7.2 China Digital Inspection Market Estimates and Forecasts, By Technology (2020-2032) (USD Billion)
11.4.7.3 China Digital Inspection Market Estimates and Forecasts, By Component (2020-2032) (USD Billion)
11.4.7.4 China Digital Inspection Market Estimates and Forecasts, By Vertical (2020-2032) (USD Billion)
11.4.8 India
11.4.8.1 India Digital Inspection Market Estimates and Forecasts, By Dimension (2020-2032) (USD Billion)
11.4.8.2 India Digital Inspection Market Estimates and Forecasts, By Technology (2020-2032) (USD Billion)
11.4.8.3 India Digital Inspection Market Estimates and Forecasts, By Component (2020-2032) (USD Billion)
11.4.8.4 India Digital Inspection Market Estimates and Forecasts, By Vertical (2020-2032) (USD Billion)
11.4.9 Japan
11.4.9.1 Japan Digital Inspection Market Estimates and Forecasts, By Dimension (2020-2032) (USD Billion)
11.4.9.2 Japan Digital Inspection Market Estimates and Forecasts, By Technology (2020-2032) (USD Billion)
11.4.9.3 Japan Digital Inspection Market Estimates and Forecasts, By Component (2020-2032) (USD Billion)
11.4.9.4 Japan Digital Inspection Market Estimates and Forecasts, By Vertical (2020-2032) (USD Billion)
11.4.10 South Korea
11.4.10.1 South Korea Digital Inspection Market Estimates and Forecasts, By Dimension (2020-2032) (USD Billion)
11.4.10.2 South Korea Digital Inspection Market Estimates and Forecasts, By Technology (2020-2032) (USD Billion)
11.4.10.3 South Korea Digital Inspection Market Estimates and Forecasts, By Component (2020-2032) (USD Billion)
11.4.10.4 South Korea Digital Inspection Market Estimates and Forecasts, By Vertical (2020-2032) (USD Billion)
11.4.11 Vietnam
11.4.11.1 Vietnam Digital Inspection Market Estimates and Forecasts, By Dimension (2020-2032) (USD Billion)
11.4.11.2 Vietnam Digital Inspection Market Estimates and Forecasts, By Technology (2020-2032) (USD Billion)
11.4.11.3 Vietnam Digital Inspection Market Estimates and Forecasts, By Component (2020-2032) (USD Billion)
11.4.11.4 Vietnam Digital Inspection Market Estimates and Forecasts, By Vertical (2020-2032) (USD Billion)
11.4.12 Singapore
11.4.12.1 Singapore Digital Inspection Market Estimates and Forecasts, By Dimension (2020-2032) (USD Billion)
11.4.12.2 Singapore Digital Inspection Market Estimates and Forecasts, By Technology (2020-2032) (USD Billion)
11.4.12.3 Singapore Digital Inspection Market Estimates and Forecasts, By Component (2020-2032) (USD Billion)
11.4.12.4 Singapore Digital Inspection Market Estimates and Forecasts, By Vertical (2020-2032) (USD Billion)
11.4.13 Australia
11.4.13.1 Australia Digital Inspection Market Estimates and Forecasts, By Dimension (2020-2032) (USD Billion)
11.4.13.2 Australia Digital Inspection Market Estimates and Forecasts, By Technology (2020-2032) (USD Billion)
11.4.13.3 Australia Digital Inspection Market Estimates and Forecasts, By Component (2020-2032) (USD Billion)
11.4.13.4 Australia Digital Inspection Market Estimates and Forecasts, By Vertical (2020-2032) (USD Billion)
11.4.14 Rest of Asia-Pacific
11.4.14.1 Rest of Asia-Pacific Digital Inspection Market Estimates and Forecasts, By Dimension (2020-2032) (USD Billion)
11.4.14.2 Rest of Asia-Pacific Digital Inspection Market Estimates and Forecasts, By Technology (2020-2032) (USD Billion)
11.4.14.3 Rest of Asia-Pacific Digital Inspection Market Estimates and Forecasts, By Component (2020-2032) (USD Billion)
11.4.14.4 Rest of Asia-Pacific Digital Inspection Market Estimates and Forecasts, By Vertical (2020-2032) (USD Billion)
11.5 Middle East and Africa
11.5.1 Middle East
11.5.1.1 Trends Analysis
11.5.1.2 Middle East Digital Inspection Market Estimates and Forecasts, by Country (2020-2032) (USD Billion)
11.5.1.3 Middle East Digital Inspection Market Estimates and Forecasts, By Dimension (2020-2032) (USD Billion)
11.5.1.4 Middle East Digital Inspection Market Estimates and Forecasts, By Technology (2020-2032) (USD Billion)
11.5.1.5 Middle East Digital Inspection Market Estimates and Forecasts, By Component (2020-2032) (USD Billion)
11.5.1.6 Middle East Digital Inspection Market Estimates and Forecasts, By Vertical (2020-2032) (USD Billion)
11.5.1.7 UAE
11.5.1.7.1 UAE Digital Inspection Market Estimates and Forecasts, By Dimension (2020-2032) (USD Billion)
11.5.1.7.2 UAE Digital Inspection Market Estimates and Forecasts, By Technology (2020-2032) (USD Billion)
11.5.1.7.3 UAE Digital Inspection Market Estimates and Forecasts, By Component (2020-2032) (USD Billion)
11.5.1.7.4 UAE Digital Inspection Market Estimates and Forecasts, By Vertical (2020-2032) (USD Billion)
11.5.1.8 Egypt
11.5.1.8.1 Egypt Digital Inspection Market Estimates and Forecasts, By Dimension (2020-2032) (USD Billion)
11.5.1.8.2 Egypt Digital Inspection Market Estimates and Forecasts, By Technology (2020-2032) (USD Billion)
11.5.1.8.3 Egypt Digital Inspection Market Estimates and Forecasts, By Component (2020-2032) (USD Billion)
11.5.1.8.4 Egypt Digital Inspection Market Estimates and Forecasts, By Vertical (2020-2032) (USD Billion)
11.5.1.9 Saudi Arabia
11.5.1.9.1 Saudi Arabia Digital Inspection Market Estimates and Forecasts, By Dimension (2020-2032) (USD Billion)
11.5.1.9.2 Saudi Arabia Digital Inspection Market Estimates and Forecasts, By Technology (2020-2032) (USD Billion)
11.5.1.9.3 Saudi Arabia Digital Inspection Market Estimates and Forecasts, By Component (2020-2032) (USD Billion)
11.5.1.9.4 Saudi Arabia Digital Inspection Market Estimates and Forecasts, By Vertical (2020-2032) (USD Billion)
11.5.1.10 Qatar
11.5.1.10.1 Qatar Digital Inspection Market Estimates and Forecasts, By Dimension (2020-2032) (USD Billion)
11.5.1.10.2 Qatar Digital Inspection Market Estimates and Forecasts, By Technology (2020-2032) (USD Billion)
11.5.1.10.3 Qatar Digital Inspection Market Estimates and Forecasts, By Component (2020-2032) (USD Billion)
11.5.1.10.4 Qatar Digital Inspection Market Estimates and Forecasts, By Vertical (2020-2032) (USD Billion)
11.5.1.11 Rest of Middle East
11.5.1.11.1 Rest of Middle East Digital Inspection Market Estimates and Forecasts, By Dimension (2020-2032) (USD Billion)
11.5.1.11.2 Rest of Middle East Digital Inspection Market Estimates and Forecasts, By Technology (2020-2032) (USD Billion)
11.5.1.11.3 Rest of Middle East Digital Inspection Market Estimates and Forecasts, By Component (2020-2032) (USD Billion)
11.5.1.11.4 Rest of Middle East Digital Inspection Market Estimates and Forecasts, By Vertical (2020-2032) (USD Billion)
11.5.2 Africa
11.5.2.1 Trends Analysis
11.5.2.2 Africa Digital Inspection Market Estimates and Forecasts, by Country (2020-2032) (USD Billion)
11.5.2.3 Africa Digital Inspection Market Estimates and Forecasts, By Dimension (2020-2032) (USD Billion)
11.5.2.4 Africa Digital Inspection Market Estimates and Forecasts, By Technology (2020-2032) (USD Billion)
11.5.2.5 Africa Digital Inspection Market Estimates and Forecasts, By Component (2020-2032) (USD Billion)
11.5.2.6 Africa Digital Inspection Market Estimates and Forecasts, By Vertical (2020-2032) (USD Billion)
11.5.2.7 South Africa
11.5.2.7.1 South Africa Digital Inspection Market Estimates and Forecasts, By Dimension (2020-2032) (USD Billion)
11.5.2.7.2 South Africa Digital Inspection Market Estimates and Forecasts, By Technology (2020-2032) (USD Billion)
11.5.2.7.3 South Africa Digital Inspection Market Estimates and Forecasts, By Component (2020-2032) (USD Billion)
11.5.2.7.4 South Africa Digital Inspection Market Estimates and Forecasts, By Vertical (2020-2032) (USD Billion)
11.5.2.8 Nigeria
11.5.2.8.1 Nigeria Digital Inspection Market Estimates and Forecasts, By Dimension (2020-2032) (USD Billion)
11.5.2.8.2 Nigeria Digital Inspection Market Estimates and Forecasts, By Technology (2020-2032) (USD Billion)
11.5.2.8.3 Nigeria Digital Inspection Market Estimates and Forecasts, By Component (2020-2032) (USD Billion)
11.5.2.8.4 Nigeria Digital Inspection Market Estimates and Forecasts, By Vertical (2020-2032) (USD Billion)
11.5.2.9 Rest of Africa
11.5.2.9.1 Rest of Africa Digital Inspection Market Estimates and Forecasts, By Dimension (2020-2032) (USD Billion)
11.5.2.9.2 Rest of Africa Digital Inspection Market Estimates and Forecasts, By Technology (2020-2032) (USD Billion)
11.5.2.9.3 Rest of Africa Digital Inspection Market Estimates and Forecasts, By Component (2020-2032) (USD Billion)
11.5.2.9.4 Rest of Africa Digital Inspection Market Estimates and Forecasts, By Vertical (2020-2032) (USD Billion)
11.6 Latin America
11.6.1 Trends Analysis
11.6.2 Latin America Digital Inspection Market Estimates and Forecasts, by Country (2020-2032) (USD Billion)
11.6.3 Latin America Digital Inspection Market Estimates and Forecasts, By Dimension (2020-2032) (USD Billion)
11.6.4 Latin America Digital Inspection Market Estimates and Forecasts, By Technology (2020-2032) (USD Billion)
11.6.5 Latin America Digital Inspection Market Estimates and Forecasts, By Component (2020-2032) (USD Billion)
11.6.6 Latin America Digital Inspection Market Estimates and Forecasts, By Vertical (2020-2032) (USD Billion)
11.6.7 Brazil
11.6.7.1 Brazil Digital Inspection Market Estimates and Forecasts, By Dimension (2020-2032) (USD Billion)
11.6.7.2 Brazil Digital Inspection Market Estimates and Forecasts, By Technology (2020-2032) (USD Billion)
11.6.7.3 Brazil Digital Inspection Market Estimates and Forecasts, By Component (2020-2032) (USD Billion)
11.6.7.4 Brazil Digital Inspection Market Estimates and Forecasts, By Vertical (2020-2032) (USD Billion)
11.6.8 Argentina
11.6.8.1 Argentina Digital Inspection Market Estimates and Forecasts, By Dimension (2020-2032) (USD Billion)
11.6.8.2 Argentina Digital Inspection Market Estimates and Forecasts, By Technology (2020-2032) (USD Billion)
11.6.8.3 Argentina Digital Inspection Market Estimates and Forecasts, By Component (2020-2032) (USD Billion)
11.6.8.4 Argentina Digital Inspection Market Estimates and Forecasts, By Vertical (2020-2032) (USD Billion)
11.6.9 Colombia
11.6.9.1 Colombia Digital Inspection Market Estimates and Forecasts, By Dimension (2020-2032) (USD Billion)
11.6.9.2 Colombia Digital Inspection Market Estimates and Forecasts, By Technology (2020-2032) (USD Billion)
11.6.9.3 Colombia Digital Inspection Market Estimates and Forecasts, By Component (2020-2032) (USD Billion)
11.6.9.4 Colombia Digital Inspection Market Estimates and Forecasts, By Vertical (2020-2032) (USD Billion)
11.6.10 Rest of Latin America
11.6.10.1 Rest of Latin America Digital Inspection Market Estimates and Forecasts, By Dimension (2020-2032) (USD Billion)
11.6.10.2 Rest of Latin America Digital Inspection Market Estimates and Forecasts, By Technology (2020-2032) (USD Billion)
11.6.10.3 Rest of Latin America Digital Inspection Market Estimates and Forecasts, By Component (2020-2032) (USD Billion)
11.6.10.4 Rest of Latin America Digital Inspection Market Estimates and Forecasts, By Vertical (2020-2032) (USD Billion)
12. Company Profiles
12.1 Cognex Corporation.
12.1.1 Company Overview
12.1.2 Financial
12.1.3 Products/ Services Offered
12.1.4 SWOT Analysis
12.2 Viscom AG.
12.2.1 Company Overview
12.2.2 Financial
12.2.3 Products/ Services Offered
12.2.4 SWOT Analysis
12.3 SafetyCulture
12.3.1 Company Overview
12.3.2 Financial
12.3.3 Products/ Services Offered
12.3.4 SWOT Analysis
12.4 UVeye
12.4.1 Company Overview
12.4.2 Financial
12.4.3 Products/ Services Offered
12.4.4 SWOT Analysis
12.5 Wabtec Corporation.
12.5.1 Company Overview
12.5.2 Financial
12.5.3 Products/ Services Offered
12.5.4 SWOT Analysis
12.6 Axonator
12.6.1 Company Overview
12.6.2 Financial
12.6.3 Products/ Services Offered
12.6.4 SWOT Analysis
12.7 MISTRAS Group
12.7.1 Company Overview
12.7.2 Financial
12.7.3 Products/ Services Offered
12.7.4 SWOT Analysis
12.8 Nikon Metrology
12.8.1 Company Overview
12.8.2 Financial
12.8.3 Products/ Services Offered
12.8.4 SWOT Analysis
12.9 Zetec
12.9.1 Company Overview
12.9.2 Financial
12.9.3 Products/ Services Offered
12.9.4 SWOT Analysis
12.10 SPECTOR
12.10.1 Company Overview
12.10.2 Financial
12.10.3 Products/ Services Offered
12.10.4 SWOT Analysis
13. Use Cases and Best Practices
14. Conclusion
An accurate research report requires proper strategizing as well as implementation. There are multiple factors involved in the completion of good and accurate research report and selecting the best methodology to compete the research is the toughest part. Since the research reports we provide play a crucial role in any company’s decision-making process, therefore we at SNS Insider always believe that we should choose the best method which gives us results closer to reality. This allows us to reach at a stage wherein we can provide our clients best and accurate investment to output ratio.
Each report that we prepare takes a timeframe of 350-400 business hours for production. Starting from the selection of titles through a couple of in-depth brain storming session to the final QC process before uploading our titles on our website we dedicate around 350 working hours. The titles are selected based on their current market cap and the foreseen CAGR and growth.
The 5 steps process:
Step 1: Secondary Research:
Secondary Research or Desk Research is as the name suggests is a research process wherein, we collect data through the readily available information. In this process we use various paid and unpaid databases which our team has access to and gather data through the same. This includes examining of listed companies’ annual reports, Journals, SEC filling etc. Apart from this our team has access to various associations across the globe across different industries. Lastly, we have exchange relationships with various university as well as individual libraries.

Step 2: Primary Research
When we talk about primary research, it is a type of study in which the researchers collect relevant data samples directly, rather than relying on previously collected data. This type of research is focused on gaining content specific facts that can be sued to solve specific problems. Since the collected data is fresh and first hand therefore it makes the study more accurate and genuine.
We at SNS Insider have divided Primary Research into 2 parts.
Part 1 wherein we interview the KOLs of major players as well as the upcoming ones across various geographic regions. This allows us to have their view over the market scenario and acts as an important tool to come closer to the accurate market numbers. As many as 45 paid and unpaid primary interviews are taken from both the demand and supply side of the industry to make sure we land at an accurate judgement and analysis of the market.
This step involves the triangulation of data wherein our team analyses the interview transcripts, online survey responses and observation of on filed participants. The below mentioned chart should give a better understanding of the part 1 of the primary interview.

Part 2: In this part of primary research the data collected via secondary research and the part 1 of the primary research is validated with the interviews from individual consultants and subject matter experts.
Consultants are those set of people who have at least 12 years of experience and expertise within the industry whereas Subject Matter Experts are those with at least 15 years of experience behind their back within the same space. The data with the help of two main processes i.e., FGDs (Focused Group Discussions) and IDs (Individual Discussions). This gives us a 3rd party nonbiased primary view of the market scenario making it a more dependable one while collation of the data pointers.
Step 3: Data Bank Validation
Once all the information is collected via primary and secondary sources, we run that information for data validation. At our intelligence centre our research heads track a lot of information related to the market which includes the quarterly reports, the daily stock prices, and other relevant information. Our data bank server gets updated every fortnight and that is how the information which we collected using our primary and secondary information is revalidated in real time.

Step 4: QA/QC Process
After all the data collection and validation our team does a final level of quality check and quality assurance to get rid of any unwanted or undesired mistakes. This might include but not limited to getting rid of the any typos, duplication of numbers or missing of any important information. The people involved in this process include technical content writers, research heads and graphics people. Once this process is completed the title gets uploader on our platform for our clients to read it.
Step 5: Final QC/QA Process:
This is the last process and comes when the client has ordered the study. In this process a final QA/QC is done before the study is emailed to the client. Since we believe in giving our clients a good experience of our research studies, therefore, to make sure that we do not lack at our end in any way humanly possible we do a final round of quality check and then dispatch the study to the client.
By Dimension
2D
3D
By Technology
Machine Vision
Metrology
NDT
By Component
Hardware
Software
Services
By Vertical
Manufacturing
Electronics and Semiconductor
Oil & Gas
Aerospace & Defense
Automotive
Request for Segment Customization as per your Business Requirement: Segment Customization Request
Regional Coverage:
North America
US
Canada
Mexico
Europe
Eastern Europe
Poland
Romania
Hungary
Turkey
Rest of Eastern Europe
Western Europe
Germany
France
UK
Italy
Spain
Netherlands
Switzerland
Austria
Rest of Western Europe
Asia Pacific
China
India
Japan
South Korea
Vietnam
Singapore
Australia
Rest of Asia Pacific
Middle East & Africa
Middle East
UAE
Egypt
Saudi Arabia
Qatar
Rest of Middle East
Africa
Nigeria
South Africa
Rest of Africa
Latin America
Brazil
Argentina
Colombia
Rest of Latin America
Request for Country Level Research Report: Country Level Customization Request
Available Customization
With the given market data, SNS Insider offers customization as per the company’s specific needs. The following customization options are available for the report:
Detailed Volume Analysis
Criss-Cross segment analysis (e.g. Product X Application)
Competitive Product Benchmarking
Geographic Analysis
Additional countries in any of the regions
Customized Data Representation
Detailed analysis and profiling of additional market players
The Near-Eye Display Market Size was valued at USD 2.31 Billion in 2023 and is expected to grow at a CAGR of 24.90% to reach USD 17.08 Billion by 2032.
The Medical Electronic Market size was valued at USD 10.51 billion in 2023 and expected to reach USD 19.04 billion by 2032 and grow at a CAGR of 6.83% over the forecast period 2024-2032.
The AI Chip Market Size was valued at USD 61.45 Billion in 2023 and is estimated to reach USD 621.15 Billion by 2032, at a CAGR of 29.4% from 2024 to 2032.
The Drone Sensor Market Size was valued at USD 1.26 Billion in 2023 and is expected to grow at a CAGR of 11.12% to reach USD 3.25 Billion by 2032.
The Machine Automation Controller Market was valued at USD 42.08 billion in 2023 and is expected to reach USD 61.66 billion by 2032, growing at a CAGR of 4.39% over the forecast period 2024-2032
The Analog Semiconductor Market Size was valued at USD 88.65 Billion in 2023 and is expected to reach USD 156.4 Billion, at a CAGR of 6.52% During 2024-2032

Hi! Click one of our member below to chat on Phone
© 2025 All Rights Reserved by SNS Insider Pvt Ltd


