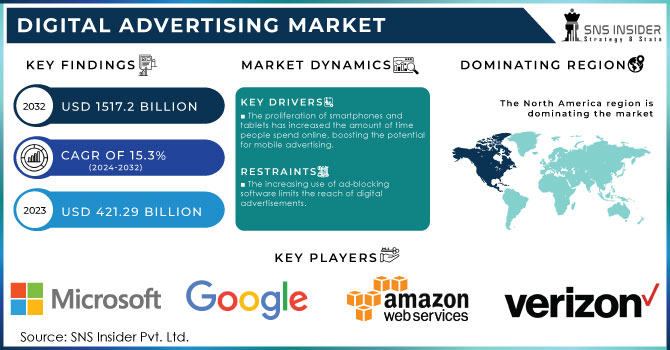
The Digital Advertising Market Size was valued at USD 416.01 Billion in 2023 and is expected to reach USD 1478.03 Billion by 2032 and grow at a CAGR of 15.16% over the forecast period 2024-2032.
Get more information on Digital Advertising Market - Request Sample Report
A key market growth is the rising penetration of the Internet and the widespread adoption of smartphones, which have led to a more expansive online ad audience. With consumers spending the majority of their time on digital platforms, advertisers have been dedicating less and fewer dollars to traditional media like TV & print, focusing more on digital channels. With the advent of social media platforms, search engines, and streaming services, advertisers were given fresh personalized tools to reach the right people. Moreover, the development of artificial intelligence (AI) and data analytics, which enable more personalized and efficient ad targeting will help the companies maximize the investment made on ads and achieve better return on investment (ROI). The world as of 2024 has 5.52 billion Internet users or 67.5% of the global population. There are more than 7 billion Smartphone users around the planet, and an average of 143 minutes each day is spent by internet users on social media. U.S. digital ad spend exceeded USD 25 billion and 3.3T impressions were served in Q1 2024 Moreover, AI is going to increase the efficiency level of ad targeting by 30–40%, leading to more personalized and effective campaigns.
E-commerce adoption, especially post-COVID-19, is also a significant driver of digital advertising growth. With the rising momentum of online shopping, businesses are aware that they need to maintain a strong digital presence or risk losing market share. This change has led to a greater number of digital ad undeniable fact that paintings in driving sales such as search engine marketing (SEM), social media ads, video ads, and many others. Additionally, inventions such as programmatic and real-time bidding (RTB) have expedited digital ad purchasing, bringing efficiency and scalability improvements. Together with changing consumer behaviors and the continuous growth of the digital space, these factors are driving the persistent growth of the digital ad market. March 2024 total global e-commerce sales were USD 6.09 trillion with 2.14 billion online shoppers. Google Ads is still the king of SEM with annual ad spend exceeding USD 200 billion, while the combined ad revenue of Facebook and Instagram amounted to USD 35 billion. YouTube has 2 billion monthly users, with views on mobile driving 70% of views, and is responsible for much of the growth within video ads. U.S. display ads 88.2% bought programmatically Global programmatic transactions USD 595 billion Real-time bidding 50% of programmatic media traded via RTB.
Key Drivers:
Video Content Dominates Digital Advertising Growth with High Engagement Mobile Consumption and Platform Expansion
The increasing significance of video content on different digital platforms is one of the major factors attributed to the growth of the digital advertising market. As video advertising has become one of the most captivating, appealing forms of content for consumers to engage with, it may be one of the best tools in the advertiser's arsenal. The growth of video streaming platforms like YouTube and TikTok, as well as streaming services like Netflix and Hulu, have played a massive role in driving up the consumption of video ads. Video ads offer advertisers the richness of an interactive medium with high-impact engagement − short-form ads, live-streaming, or long-form. Video ads also do an excellent job of demonstrating products or services more visually and engagingly, leading to higher engagement and, subsequently, larger returns on investment for advertisers. Given the rise in mobile device use to consume video, this format should continue to be one of the main engines of growth within the digital advertising space. According to 2024 statistics, 92% of internet users consume online video content and 1 billion hours of video is watched on YouTube every day. 70% of digital video consumption comes from smartphones, and 75% of all video plays are on mobile. YouTube has 2 billion monthly users and 70% of views from mobile. Over on TikTok, the short-form video platform broke through 1 billion monthly active users while users spent an average of 52 minutes per day on the app. These trends indicate the increasing highness of video files, particularly on cell phones.
Programmatic Advertising Drives Digital Market Growth with Automation AI Big Data and Real-Time Bidding
The growing acceptance of programmatic advertising is another major factor driving the digital advertising market. Programmatic advertising refers to the automated buying and selling of online ads through a sophisticated blend of technology and algorithms. This form of advertisement delivery guarantees ads are served to the appropriate audience, at the appropriate time. The transition from manual ad procurement to automated processes has streamlined advertising campaigns, making them more effective, cheaper, and scalable. Programmatic offers RTB and optimization, but it also enhances targeting accuracy through the use of big data i.e. data collected from consumer behavior. Programmatic advertising is made to grow more as it helps enhance ad performance and return on investment by utilizing sophisticated data-driven insights. The scale of advertising campaigns it manages and the richness of the analytics it provides into advertiser behavior make it a major engine of the digital advertising market, driving the overall migration from static, traditional advertising to a more fluid, automated form of advertising. In 2024, 75% of global digital display ads were purchased programmatically, yet 50% of those were purchased via real-time bidding (RTB). 35% of video ads were programmatic and big data was used for targeting 70% of campaigns. Moreover, 40% of programmatic campaigns apply AI for real-time optimization to enhance ad performance ROI.
Restrain:
Rising Ad Fraud and Privacy Regulations Pose Major Challenges to the Growth of Digital Advertising Market
The digital advertising market suffers from one of the biggest ad fraud problems. With the evolution of digital ads, the more advanced the fraud activities come i.e. click fraud and fake impressions. This can result in ad budgets going to waste, and this makes marketing campaigns ineffective. This means advertisers are always having to scramble and always on the lookout to ensure their ad dollars do indeed reach real humans through much more than cast-iron monitoring tools and anti-fraud technologies. Privacy concerns and regulations are another major limitation. As consumers become more conscious about data privacy, and with regulations such as the General Data Protection Regulation (GDPR) and the California Consumer Privacy Act (CCPA) coming into full effect, advertisers have to navigate a host of legal factors surrounding the use of consumer data. It restricts the amount of data that advertisers can collect for targeting and tracking, which in turn means ads will not be so targeted. Even with major advances in privacy protection from companies like Apple and the European Union, striking the balance between targeting customers with efficient and relevant ads and proper consumer privacy remains a challenge for marketers in the digital advertising space.
By Platform
Smartphones dominated the digital advertising market in 2023 accounting for 46.7% of the total share. Mobile phones provide advertisers with the possibility to target users with location-based services and ads, mobile apps, and social media platforms, which enables advertisers to impact consumers profoundly. Mobile internet usage growth and increase in app use time as well as mobile commerce (m-commerce) are the biggest enablers of this domination. Advertisers can reach users wherever they are in the world at any time on mobile, leading to greater engagement and conversions. The seamless adoption of mobile devices into consumers' bone structure has designed them to the partners for investigating imitation for digital advertising.
Computers are anticipated to have the highest CAGR during the forecast period of 2024-2032. With the rise in productivity tools, remote work, and digitized services across various sectors, targeted advertising on computers (desktops, laptops, and tablets) is becoming more widespread. Also, computers have bigger screen real-estate, allowing for more immersive and functional ad formats and placements like long-form video and HD banners. Increasing e-commerce usage on desktops and the expansion of digital subscriptions and services (e.g., streaming, and software tools) will catalyze computer-based advertising and pull forward revenue growth for the segment.
By Offering
Solutions remained the largest segment in the digital advertising market in 2023 with 67.7% of the market. Solutions such as programmatic advertising platforms, analytics tools, and automated bidding systems empower advertisers to target their intended audiences much more accurately and efficiently. With businesses increasing their focus on data-driven strategies and technology to enhance advertising efficiencies, the need for end-to-end advertising solutions is rising. These solutions have become fundamental in the marketer's toolkit as organizations have wanted to combine data analytics, machine learning, and real-time optimization all under one umbrella to drive ROI and customer engagement.
Services are projected to grow at the highest CAGR between 2024 and 2032 owing to the rising demand for specialized expertise in managing and optimizing digital campaigns. With increased complexity in digital advertising, the current trend for businesses is to rely on an agency and third-party solution provider for services like campaign management, creative services, data analytics, as well as social media strategy. These services empower businesses to utilize the power of digital platforms, particularly for a myriad of functions ranging from influencer marketing, and content creation, to multi-platform campaigns. In a rapidly changing digital landscape, coupled with increasing demand for personalized marketing, the need for specialist services will expand, allocating the largest surge over the coming years in this category.
By Type
Search Advertising was the leading digital ad format in 2023, taking 37.5% of the total, continuing to benefit from the high specificity of its targeting options and the worldwide scale of search engines such as Google. With search advertising, advertisers can target users in the immediate moment that they are searching for certain products, services, or information. Because the user is already interested in what's being advertised, this intention-based advertising format results in higher conversion rates. This, in addition to the fact that search ads are less disruptive than other types of ads and are therefore more attractive to customers, is why search ads will continue to prevail. Search adverts have remained a mainstay of digital internet marketing tactics because of the potential to accurately target key phrases, and provide targeted adverts.
Interstitial Advertising is anticipated to witness the fastest CAGR during 2024-2032. Highly engaging in nature, ad placements captured in interstitials are usually full-screen ads coming in between the natural transitions of the app or website. As Mobile apps and games are becoming popular, interstitial ads can catch your attention completely during a user experience. With mobile continuing to grow globally, particularly for gaming and other app-based scenarios interstitial ads are becoming a popular and effective tool for advertisers. It can deliver rich, high-impact, non-skippable ads that are likely to accelerate the adoption and growth trajectory of this format making them a very important part of the future digital ad ecosystem.
By Format
Video continued its dominance in the digital advertising market in 2023, accounting for 46.3% of their share. Video ads allow advertisers to communicate more complicated messages and demonstrate their products in dynamic and visually appealing ways. This dominance has largely been fueled by the rising demand for video consumption on platforms like YouTube, TikTok, Instagram, and streaming services. Video is more engaging and promotes a better experience, which means consumers engage with them more and develop a stronger emotional connection. With the advent of short-form, live streaming, and video-centric social media, video advertising continues to be in the driver's seat, buoyed by improving mobile devices and broadband connectivity.
Text is anticipated to exhibit the fastest-growing CAGR (Cumulative Annual Growth Rate) from 2024 to 2032. Text-based advertising on platforms like search engine ads, display ads, and text in social media posts provides advertisers with a simple and quick way to get their specific messages to consumers. AI-powered marketing has changed how things work now, especially with personalized text-based ads. Additionally, they are ideal for low-bandwidth platforms or environments with very short engagement, like mobile and chat-based ads. Supported by the constant evolution of these platforms and technologies, text-based advertising is likely to face increasing demand and is expected to grow faster than other ad formats.
By End-Use Industry
Retail accounted for 30.5% of digital advertising spending in 2023, continuing the trend from previous years that reflects the sector's significant dependence on digital channels to reach consumers. When it comes to websites retailers have become better at driving them to make purchases as well, particularly around unrealistic holiday shopping times or other season sales events. With the boom of e-commerce, digital advertising in retail has rapidly expanded, targeting the consumption behavior of consumers who are online browsing or searching for products to buy. In e-commerce, digital channels like search engines, social media, and video ads will be used by retail advertisers to hook prospective buyers, enticing them with personalized experiences and deals to evoke purchase behaviors. Coupled with high-volume consumer interest and fast-moving commerce, it has left retail at the forefront of digital advertising.
Education is projected to have the highest CAGR growth from 2024 to 2032 due to the rising trend of online learning and the rising demand for digital marketing in the education industry. With the increasing number of educational institutions, online courses, and e-learning platforms, everyone is targeting students and learners through digital advertising. This encompasses strategies such as search and display ads for prospecting students and employing social media and video content to create brand visibility. Increasing conversion of classrooms to digital and remote-based learning after the pandemic is driving the demand for digital-based education advertisements. Finally, with the continued evolution of education technology, personalized messaging for students, and promotion of online courses and virtual events, education will become one of the fastest-growing categories of digital advertising in the next ten years.
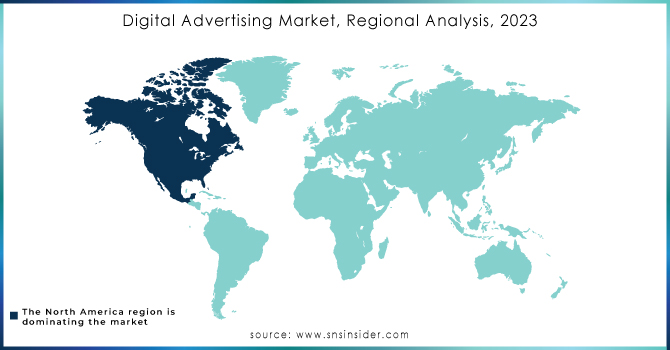
In 2023, North America held the largest share of the digital advertising market at 34.2%, primarily due to high internet penetration, a better technological infrastructure, and the presence of major tech giants like Google, Facebook (Meta), and Amazon. Digital advertising markets are most mature in North America, offering advertisers the ability to access large, diverse audiences across multiple channels including search, social, and video. The region's aggressive approach towards data-driven marketing and innovations such as programmatic advertising has further played an integral part in its dominance. For instance, Amazon's advertising platform, which helps retailers gain the attention of shoppers on its e-commerce site, is one of the most successful in the realm, allowing businesses the ability to reach a delicately wide statistic.
Asia Pacific is projected to have the highest growth CAGR from 2024 to 2032. Faster adoption of smartphones, expanding middle class, and growing digital platforms in nations such as India, China, and Southeast Asia are accountable for the high regionally-based spending. Key drivers of the growth of digital ads in the region include a disproportionate shift from traditional to digital media and high investments in mobile and video ads. For example, TikTok, a short video app that is massive in Asia, seems to be crushing the digital ad game. Brands are using TikTok's algorithm to their advantage to connect with younger audiences with hyper-creative personalized content. Likewise, in China, Alibaba and Baidu built huge digital advertising ecosystems to target tens of millions of consumers through mobile access, e-commerce marketing, and search engine marketing. With fast-growing internet penetration and usage of mobile internet, Asia Pacific has become one of the fundamental growth engines of digital advertising.
Need any customization research on Digital Advertising market - Enquiry Now
Some of the major players in the Digital Advertising Market are:
Adobe (Adobe Experience Cloud, Adobe Advertising Cloud)
The Trade Desk (Demand-Side Platform, Data Management Platform)
WPP plc (GroupM, Ogilvy)
Omnicom Group (BBDO Worldwide, DDB Worldwide)
Publicis Groupe (Publicis Media, SapientRazorfish)
Google (Google Ads, Google Marketing Platform)
Facebook (Facebook Ads, Instagram Ads)
Amazon (Amazon Advertising, Amazon DSP)
Microsoft corporation (Microsoft Advertising, LinkedIn Ads)
Snap Inc. (Snap Ads, Snap Audience Network)
TikTok (TikTok Ads, TikTok For Business)
Twitter (Twitter Ads, Twitter Amplify)
LinkedIn (LinkedIn Ads, LinkedIn Marketing Solutions)
Spotify (Spotify Ads, Spotify Ad Studio)
Pinterest (Pinterest Ads, Pinterest Business)
Reddit (Reddit Ads, Reddit Promote)
Yahoo (Yahoo Ads, Yahoo Gemini)
Taboola (Taboola Feed, Taboola Newsroom)
Outbrain (Outbrain Amplify, Outbrain Engage)
Criteo (Criteo Dynamic Retargeting, Criteo Sponsored Products)
Some of the Raw Material Suppliers for Digital Advertising Companies:
Intel Corporation
Advanced Micro Devices (AMD)
NVIDIA Corporation
Qualcomm Incorporated
Broadcom Inc.
Micron Technology, Inc.
Taiwan Semiconductor Manufacturing Company (TSMC)
Samsung Electronics
Seagate Technology
Western Digital Corporation
In October 2024, Adobe launched GenStudio for Performance Marketing, a generative AI tool designed to help marketing and creative teams accelerate campaign creation and optimization across platforms. The tool integrates with major platforms like Google, Meta, and TikTok to deliver personalized content at scale.
In January 2025, The Trade Desk announced an agreement to acquire Sincera, a data company specializing in digital advertising insights. This acquisition will enhance The Trade Desk's platform with improved data signals and transparency for programmatic advertising.
In August 2024, Omnicom launched the Omnicom Advertising Group (OAG), consolidating its creative networks like BBDO, DDB, and TBWA to drive innovation and growth.
| Report Attributes | Details |
|---|---|
| Market Size in 2023 | USD 416.01 Billion |
| Market Size by 2032 | USD 1478.03 Billion |
| CAGR | CAGR of 15.16% From 2024 to 2032 |
| Base Year | 2023 |
| Forecast Period | 2024-2032 |
| Historical Data | 2020-2022 |
| Report Scope & Coverage | Market Size, Segments Analysis, Competitive Landscape, Regional Analysis, DROC & SWOT Analysis, Forecast Outlook |
| Key Segments | • By Platform (Computer, Smartphone, Others) • By Offering (Solution, Services) • By Type (Search Advertising, Banner Advertising, Video Advertising, Social Media Advertising, Native Advertising, Interstitial Advertising) • By Format (Text, Image, Video, Others) • By End Use Industry (BFSI, Automotive, IT & Telecommunication, Healthcare, Consumer Electronics, Retail, Media & Entertainment, Education, Others) |
| Regional Analysis/Coverage | North America (US, Canada, Mexico), Europe (Eastern Europe [Poland, Romania, Hungary, Turkey, Rest of Eastern Europe] Western Europe] Germany, France, UK, Italy, Spain, Netherlands, Switzerland, Austria, Rest of Western Europe]), Asia Pacific (China, India, Japan, South Korea, Vietnam, Singapore, Australia, Rest of Asia Pacific), Middle East & Africa (Middle East [UAE, Egypt, Saudi Arabia, Qatar, Rest of Middle East], Africa [Nigeria, South Africa, Rest of Africa], Latin America (Brazil, Argentina, Colombia, Rest of Latin America) |
| Company Profiles | Adobe, The Trade Desk, WPP plc, Omnicom Group, Publicis Groupe, Google, Facebook, Amazon, Microsoft, Snap Inc., TikTok, Twitter, LinkedIn, Spotify, Pinterest, Reddit, Yahoo, Taboola, Outbrain, Criteo. |
| Key Drivers | • Video Content Dominates Digital Advertising Growth with High Engagement Mobile Consumption and Platform Expansion • Programmatic Advertising Drives Digital Market Growth with Automation AI Big Data and Real-Time Bidding |
| RESTRAINTS | • Rising Ad Fraud and Privacy Regulations Pose Major Challenges to the Growth of Digital Advertising Market |
Ans: The Digital Advertising Market is expected to grow at a CAGR of 15.16%.
Ans: Digital Advertising Market size was USD 416.01 billion in 2023 and is expected to Reach USD 1478.03 billion by 2032.
Ans: The major key drivers for the growth of the Digital Advertising Market include increased internet and mobile device penetration, the rise of social media platforms, and advancements in data-driven and programmatic advertising technologies.
Ans: Restraints on the growth of the Digital Advertising Market include concerns over data privacy regulations, ad fraud, and consumer ad fatigue.
Ans: In 2023, the North American region leads the Digital Advertising market, capturing approximately 34.25% of the total market share.
Table of Contents:
1. Introduction
1.1 Market Definition
1.2 Scope (Inclusion and Exclusions)
1.3 Research Assumptions
2. Executive Summary
2.1 Market Overview
2.2 Regional Synopsis
2.3 Competitive Summary
3. Research Methodology
3.1 Top-Down Approach
3.2 Bottom-up Approach
3.3. Data Validation
3.4 Primary Interviews
4. Market Dynamics Impact Analysis
4.1 Market Driving Factors Analysis
4.1.1 Drivers
4.1.2 Restraints
4.2 PESTLE Analysis
4.3 Porter’s Five Forces Model
5. Statistical Insights and Trends Reporting
5.1 Click-Through Rate (CTR), 2023
5.2 Cost Per Click (CPC), 2023
5.3 Return on Ad Spend
5.4 Ad Fraud Rate, by region (2020-2032)
6. Competitive Landscape
6.1 List of Major Companies, By Region
6.2 Market Share Analysis, By Region
6.3 Product Benchmarking
6.3.1 Product specifications and features
6.3.2 Pricing
6.4 Strategic Initiatives
6.4.1 Marketing and promotional activities
6.4.2 Distribution and Supply Chain Strategies
6.4.3 Expansion plans and new product launches
6.4.4 Strategic partnerships and collaborations
6.5 Technological Advancements
6.6 Market Positioning and Branding
7. Digital Advertising Market Segmentation, By Platform
7.1 Chapter Overview
7.2 Computer
7.2.1 Computer Market Trends Analysis (2020-2032)
7.2.2 Computer Market Size Estimates and Forecasts to 2032 (USD Billion)
7.3 Smartphone
7.3.1 Smartphone Market Trends Analysis (2020-2032)
7.3.2 Smartphone Market Size Estimates and Forecasts to 2032 (USD Billion)
7.4 Others
7.4.1 Others Market Trends Analysis (2020-2032)
7.4.2 Others Market Size Estimates and Forecasts to 2032 (USD Billion)
8. Digital Advertising Market Segmentation, By Offering
8.1 Chapter Overview
8.2 Solution
8.2.1 Solution Market Trends Analysis (2020-2032)
8.2.2 Solution Market Size Estimates and Forecasts To 2032 (USD Billion)
8.3 Services
8.3.1 Services Market Trends Analysis (2020-2032)
8.3.2 Services Market Size Estimates and Forecasts To 2032 (USD Billion)
9. Digital Advertising Market Segmentation, By Type
9.1 Chapter Overview
9.2 Search Advertising
9.2.1 Search Advertising Market Trends Analysis (2020-2032)
9.2.2 Search Advertising Market Size Estimates and Forecasts To 2032 (USD Billion)
9.3 Banner Advertising
9.3.1 Banner Advertising Market Trends Analysis (2020-2032)
9.3.2 Banner Advertising Market Size Estimates and Forecasts To 2032 (USD Billion)
9.4 Video Advertising
9.4.1 Video Advertising Market Trends Analysis (2020-2032)
9.4.2 Video Advertising Market Size Estimates and Forecasts To 2032 (USD Billion)
9.5 Social Media Advertising
9.5.1 Social Media Advertising Market Trends Analysis (2020-2032)
9.5.2 Social Media Advertising Market Size Estimates and Forecasts To 2032 (USD Billion)
9.6 Native Advertising
9.6.1 Native Advertising Market Trends Analysis (2020-2032)
9.6.2 Native Advertising Market Size Estimates and Forecasts To 2032 (USD Billion)
9.7 Interstitial Advertising
9.7.1 Interstitial Advertising Market Trends Analysis (2020-2032)
9.7.2 Interstitial Advertising Market Size Estimates and Forecasts To 2032 (USD Billion)
10. Digital Advertising Market Segmentation, By Format
10.1 Chapter Overview
10.2 Text
10.2.1 Text Market Trends Analysis (2020-2032)
10.2.2 Text Market Size Estimates and Forecasts To 2032 (USD Billion)
10.3 Image
10.3.1 Image Market Trends Analysis (2020-2032)
10.3.2 Image Market Size Estimates and Forecasts To 2032 (USD Billion)
10.4 Video
10.4.1 Video Market Trends Analysis (2020-2032)
10.4.2 Video Market Size Estimates and Forecasts To 2032 (USD Billion)
10.5 Others
10.5.1 Others Market Trends Analysis (2020-2032)
10.5.2 Others Market Size Estimates and Forecasts To 2032 (USD Billion)
11. Digital Advertising Market Segmentation, By End Use Industry
11.1 Chapter Overview
11.2 BFSI
11.2.1 BFSI Market Trends Analysis (2020-2032)
11.2.2 BFSI Market Size Estimates and Forecasts To 2032 (USD Billion)
11.3 Automotive
11.3.1 Automotive Market Trends Analysis (2020-2032)
11.3.2 Automotive Market Size Estimates and Forecasts To 2032 (USD Billion)
11.4 IT & Telecommunication
11.4.1 IT & Telecommunication Market Trends Analysis (2020-2032)
11.4.2 IT & Telecommunication Market Size Estimates and Forecasts To 2032 (USD Billion)
11.5 Healthcare
11.5.1 Healthcare Market Trends Analysis (2020-2032)
11.5.2 Healthcare Market Size Estimates and Forecasts To 2032 (USD Billion)
11.6 Consumer Electronics
11.6.1 Consumer Electronics Market Trends Analysis (2020-2032)
11.6.2 Consumer Electronics Market Size Estimates and Forecasts To 2032 (USD Billion)
11.7 Retail
11.7.1 Retail Market Trends Analysis (2020-2032)
11.7.2 Retail Market Size Estimates and Forecasts To 2032 (USD Billion)
11.8 Media & Entertainment
11.8.1 Media & Entertainment Market Trends Analysis (2020-2032)
11.8.2 Media & Entertainment Market Size Estimates and Forecasts To 2032 (USD Billion)
11.9 Education
11.9.1 Education Market Trends Analysis (2020-2032)
11.9.2 Education Market Size Estimates and Forecasts To 2032 (USD Billion)
11.10 Others
11.10.1 Others Market Trends Analysis (2020-2032)
11.10.2 Others Market Size Estimates and Forecasts To 2032 (USD Billion)
12. Regional Analysis
12.1 Chapter Overview
12.2 North America
12.2.1 Trends Analysis
12.2.2 North America Digital Advertising Market Estimates and Forecasts, By Country (2020-2032) (USD Billion)
12.2.3 North America Digital Advertising Market Estimates and Forecasts, By Platform (2020-2032) (USD Billion)
12.2.4 North America Digital Advertising Market Estimates and Forecasts, By Offering (2020-2032) (USD Billion)
12.2.5 North America Digital Advertising Market Estimates and Forecasts, By Type (2020-2032) (USD Billion)
12.2.6 North America Digital Advertising Market Estimates and Forecasts, By Format (2020-2032) (USD Billion)
12.2.7 North America Digital Advertising Market Estimates and Forecasts, By End Use Industry (2020-2032) (USD Billion)
12.2.8 USA
12.2.8.1 USA Digital Advertising Market Estimates and Forecasts, By Platform (2020-2032) (USD Billion)
12.2.8.2 USA Digital Advertising Market Estimates and Forecasts, By Offering (2020-2032) (USD Billion)
12.2.8.3 USA Digital Advertising Market Estimates and Forecasts, By Type (2020-2032) (USD Billion)
12.2.8.4 USA Digital Advertising Market Estimates and Forecasts, By Format (2020-2032) (USD Billion)
12.2.8.5 USA Digital Advertising Market Estimates and Forecasts, By End Use Industry (2020-2032) (USD Billion)
12.2.9 Canada
12.2.9.1 Canada Digital Advertising Market Estimates and Forecasts, By Platform (2020-2032) (USD Billion)
12.2.9.2 Canada Digital Advertising Market Estimates and Forecasts, By Offering (2020-2032) (USD Billion)
12.2.9.3 Canada Digital Advertising Market Estimates and Forecasts, By Type (2020-2032) (USD Billion)
12.2.9.4 Canada Digital Advertising Market Estimates and Forecasts, By Format (2020-2032) (USD Billion)
12.2.9.5 Canada Digital Advertising Market Estimates and Forecasts, By End Use Industry (2020-2032) (USD Billion)
12.2.10 Mexico
12.2.10.1 Mexico Digital Advertising Market Estimates and Forecasts, By Platform (2020-2032) (USD Billion)
12.2.10.2 Mexico Digital Advertising Market Estimates and Forecasts, By Offering (2020-2032) (USD Billion)
12.2.10.3 Mexico Digital Advertising Market Estimates and Forecasts, By Type (2020-2032) (USD Billion)
12.2.10.4 Mexico Digital Advertising Market Estimates and Forecasts, By Format (2020-2032) (USD Billion)
12.2.10.5 Mexico Digital Advertising Market Estimates and Forecasts, By End Use Industry (2020-2032) (USD Billion)
12.3 Europe
12.3.1 Eastern Europe
12.3.1.1 Trends Analysis
12.3.1.2 Eastern Europe Digital Advertising Market Estimates and Forecasts, By Country (2020-2032) (USD Billion)
12.3.1.3 Eastern Europe Digital Advertising Market Estimates and Forecasts, By Platform (2020-2032) (USD Billion)
12.3.1.4 Eastern Europe Digital Advertising Market Estimates and Forecasts, By Offering (2020-2032) (USD Billion)
12.3.1.5 Eastern Europe Digital Advertising Market Estimates and Forecasts, By Type (2020-2032) (USD Billion)
12.3.1.6 Eastern Europe Digital Advertising Market Estimates and Forecasts, By Format (2020-2032) (USD Billion)
12.3.1.7 Eastern Europe Digital Advertising Market Estimates and Forecasts, By End Use Industry (2020-2032) (USD Billion)
12.3.1.8 Poland
12.3.1.8.1 Poland Digital Advertising Market Estimates and Forecasts, By Platform (2020-2032) (USD Billion)
12.3.1.8.2 Poland Digital Advertising Market Estimates and Forecasts, By Offering (2020-2032) (USD Billion)
12.3.1.8.3 Poland Digital Advertising Market Estimates and Forecasts, By Type (2020-2032) (USD Billion)
12.3.1.8.4 Poland Digital Advertising Market Estimates and Forecasts, By Format (2020-2032) (USD Billion)
12.3.1.8.5 Poland Digital Advertising Market Estimates and Forecasts, By End Use Industry (2020-2032) (USD Billion)
12.3.1.9 Romania
12.3.1.9.1 Romania Digital Advertising Market Estimates and Forecasts, By Platform (2020-2032) (USD Billion)
12.3.1.9.2 Romania Digital Advertising Market Estimates and Forecasts, By Offering (2020-2032) (USD Billion)
12.3.1.9.3 Romania Digital Advertising Market Estimates and Forecasts, By Type (2020-2032) (USD Billion)
12.3.1.9.4 Romania Digital Advertising Market Estimates and Forecasts, By Format (2020-2032) (USD Billion)
12.3.1.9.5 Romania Digital Advertising Market Estimates and Forecasts, By End Use Industry (2020-2032) (USD Billion)
12.3.1.10 Hungary
12.3.1.10.1 Hungary Digital Advertising Market Estimates and Forecasts, By Platform (2020-2032) (USD Billion)
12.3.1.10.2 Hungary Digital Advertising Market Estimates and Forecasts, By Offering (2020-2032) (USD Billion)
12.3.1.10.3 Hungary Digital Advertising Market Estimates and Forecasts, By Type (2020-2032) (USD Billion)
12.3.1.10.4 Hungary Digital Advertising Market Estimates and Forecasts, By Format (2020-2032) (USD Billion)
12.3.1.10.5 Hungary Digital Advertising Market Estimates and Forecasts, By End Use Industry (2020-2032) (USD Billion)
12.3.1.11 Turkey
12.3.1.11.1 Turkey Digital Advertising Market Estimates and Forecasts, By Platform (2020-2032) (USD Billion)
12.3.1.11.2 Turkey Digital Advertising Market Estimates and Forecasts, By Offering (2020-2032) (USD Billion)
12.3.1.11.3 Turkey Digital Advertising Market Estimates and Forecasts, By Type (2020-2032) (USD Billion)
12.3.1.11.4 Turkey Digital Advertising Market Estimates and Forecasts, By Format (2020-2032) (USD Billion)
12.3.1.11.5 Turkey Digital Advertising Market Estimates and Forecasts, By End Use Industry (2020-2032) (USD Billion)
12.3.1.12 Rest Of Eastern Europe
12.3.1.12.1 Rest Of Eastern Europe Digital Advertising Market Estimates and Forecasts, By Platform (2020-2032) (USD Billion)
12.3.1.12.2 Rest Of Eastern Europe Digital Advertising Market Estimates and Forecasts, By Offering (2020-2032) (USD Billion)
12.3.1.12.3 Rest Of Eastern Europe Digital Advertising Market Estimates and Forecasts, By Type (2020-2032) (USD Billion)
12.3.1.12.4 Rest Of Eastern Europe Digital Advertising Market Estimates and Forecasts, By Format (2020-2032) (USD Billion)
12.3.1.12.5 Rest Of Eastern Europe Digital Advertising Market Estimates and Forecasts, By End Use Industry (2020-2032) (USD Billion)
12.3.2 Western Europe
12.3.2.1 Trends Analysis
12.3.2.2 Western Europe Digital Advertising Market Estimates and Forecasts, By Country (2020-2032) (USD Billion)
12.3.2.3 Western Europe Digital Advertising Market Estimates and Forecasts, By Platform (2020-2032) (USD Billion)
12.3.2.4 Western Europe Digital Advertising Market Estimates and Forecasts, By Offering (2020-2032) (USD Billion)
12.3.2.5 Western Europe Digital Advertising Market Estimates and Forecasts, By Type (2020-2032) (USD Billion)
12.3.2.6 Western Europe Digital Advertising Market Estimates and Forecasts, By Format (2020-2032) (USD Billion)
12.3.2.7 Western Europe Digital Advertising Market Estimates and Forecasts, By End Use Industry (2020-2032) (USD Billion)
12.3.2.8 Germany
12.3.2.8.1 Germany Digital Advertising Market Estimates and Forecasts, By Platform (2020-2032) (USD Billion)
12.3.2.8.2 Germany Digital Advertising Market Estimates and Forecasts, By Offering (2020-2032) (USD Billion)
12.3.2.8.3 Germany Digital Advertising Market Estimates and Forecasts, By Type (2020-2032) (USD Billion)
12.3.2.8.4 Germany Digital Advertising Market Estimates and Forecasts, By Format (2020-2032) (USD Billion)
12.3.2.8.5 Germany Digital Advertising Market Estimates and Forecasts, By End Use Industry (2020-2032) (USD Billion)
12.3.2.9 France
12.3.2.9.1 France Digital Advertising Market Estimates and Forecasts, By Platform (2020-2032) (USD Billion)
12.3.2.9.2 France Digital Advertising Market Estimates and Forecasts, By Offering (2020-2032) (USD Billion)
12.3.2.9.3 France Digital Advertising Market Estimates and Forecasts, By Type (2020-2032) (USD Billion)
12.3.2.9.4 France Digital Advertising Market Estimates and Forecasts, By Format (2020-2032) (USD Billion)
12.3.2.9.5 France Digital Advertising Market Estimates and Forecasts, By End Use Industry (2020-2032) (USD Billion)
12.3.2.10 UK
12.3.2.10.1 UK Digital Advertising Market Estimates and Forecasts, By Platform (2020-2032) (USD Billion)
12.3.2.10.2 UK Digital Advertising Market Estimates and Forecasts, By Offering (2020-2032) (USD Billion)
12.3.2.10.3 UK Digital Advertising Market Estimates and Forecasts, By Type (2020-2032) (USD Billion)
12.3.2.10.4 UK Digital Advertising Market Estimates and Forecasts, By Format (2020-2032) (USD Billion)
12.3.2.10.5 UK Digital Advertising Market Estimates and Forecasts, By End Use Industry (2020-2032) (USD Billion)
12.3.2.11 Italy
12.3.2.11.1 Italy Digital Advertising Market Estimates and Forecasts, By Platform (2020-2032) (USD Billion)
12.3.2.11.2 Italy Digital Advertising Market Estimates and Forecasts, By Offering (2020-2032) (USD Billion)
12.3.2.11.3 Italy Digital Advertising Market Estimates and Forecasts, By Type (2020-2032) (USD Billion)
12.3.2.11.4 Italy Digital Advertising Market Estimates and Forecasts, By Format (2020-2032) (USD Billion)
12.3.2.11.5 Italy Digital Advertising Market Estimates and Forecasts, By End Use Industry (2020-2032) (USD Billion)
12.3.2.12 Spain
12.3.2.12.1 Spain Digital Advertising Market Estimates and Forecasts, By Platform (2020-2032) (USD Billion)
12.3.2.12.2 Spain Digital Advertising Market Estimates and Forecasts, By Offering (2020-2032) (USD Billion)
12.3.2.12.3 Spain Digital Advertising Market Estimates and Forecasts, By Type (2020-2032) (USD Billion)
12.3.2.12.4 Spain Digital Advertising Market Estimates and Forecasts, By Format (2020-2032) (USD Billion)
12.3.2.12.5 Spain Digital Advertising Market Estimates and Forecasts, By End Use Industry (2020-2032) (USD Billion)
12.3.2.13 Netherlands
12.3.2.13.1 Netherlands Digital Advertising Market Estimates and Forecasts, By Platform (2020-2032) (USD Billion)
12.3.2.13.2 Netherlands Digital Advertising Market Estimates and Forecasts, By Offering (2020-2032) (USD Billion)
12.3.2.13.3 Netherlands Digital Advertising Market Estimates and Forecasts, By Type (2020-2032) (USD Billion)
12.3.2.13.4 Netherlands Digital Advertising Market Estimates and Forecasts, By Format (2020-2032) (USD Billion)
12.3.2.13.5 Netherlands Digital Advertising Market Estimates and Forecasts, By End Use Industry (2020-2032) (USD Billion)
12.3.2.14 Switzerland
12.3.2.14.1 Switzerland Digital Advertising Market Estimates and Forecasts, By Platform (2020-2032) (USD Billion)
12.3.2.14.2 Switzerland Digital Advertising Market Estimates and Forecasts, By Offering (2020-2032) (USD Billion)
12.3.2.14.3 Switzerland Digital Advertising Market Estimates and Forecasts, By Type (2020-2032) (USD Billion)
12.3.2.14.4 Switzerland Digital Advertising Market Estimates and Forecasts, By Format (2020-2032) (USD Billion)
12.3.2.12.5 Switzerland Digital Advertising Market Estimates and Forecasts, By End Use Industry (2020-2032) (USD Billion)
12.3.2.15 Austria
12.3.2.15.1 Austria Digital Advertising Market Estimates and Forecasts, By Platform (2020-2032) (USD Billion)
12.3.2.15.2 Austria Digital Advertising Market Estimates and Forecasts, By Offering (2020-2032) (USD Billion)
12.3.2.15.3 Austria Digital Advertising Market Estimates and Forecasts, By Type (2020-2032) (USD Billion)
12.3.2.15.4 Austria Digital Advertising Market Estimates and Forecasts, By Format (2020-2032) (USD Billion)
12.3.2.15.5 Austria Digital Advertising Market Estimates and Forecasts, By End Use Industry (2020-2032) (USD Billion)
12.3.2.16 Rest Of Western Europe
12.3.2.16.1 Rest Of Western Europe Digital Advertising Market Estimates and Forecasts, By Platform (2020-2032) (USD Billion)
12.3.2.16.2 Rest Of Western Europe Digital Advertising Market Estimates and Forecasts, By Offering (2020-2032) (USD Billion)
12.3.2.16.3 Rest Of Western Europe Digital Advertising Market Estimates and Forecasts, By Type (2020-2032) (USD Billion)
12.3.2.16.4 Rest Of Western Europe Digital Advertising Market Estimates and Forecasts, By Format (2020-2032) (USD Billion)
12.3.2.16.5 Rest Of Western Europe Digital Advertising Market Estimates and Forecasts, By End Use Industry (2020-2032) (USD Billion)
12.4 Asia Pacific
12.4.1 Trends Analysis
12.4.2 Asia Pacific Digital Advertising Market Estimates and Forecasts, By Country (2020-2032) (USD Billion)
12.4.3 Asia Pacific Digital Advertising Market Estimates and Forecasts, By Platform (2020-2032) (USD Billion)
12.4.4 Asia Pacific Digital Advertising Market Estimates and Forecasts, By Offering (2020-2032) (USD Billion)
12.4.5 Asia Pacific Digital Advertising Market Estimates and Forecasts, By Type (2020-2032) (USD Billion)
12.4.6 Asia Pacific Digital Advertising Market Estimates and Forecasts, By Format (2020-2032) (USD Billion)
12.4.7 Asia Pacific Digital Advertising Market Estimates and Forecasts, By End Use Industry (2020-2032) (USD Billion)
12.4.8 China
12.4.8.1 China Digital Advertising Market Estimates and Forecasts, By Platform (2020-2032) (USD Billion)
12.4.8.2 China Digital Advertising Market Estimates and Forecasts, By Offering (2020-2032) (USD Billion)
12.4.8.3 China Digital Advertising Market Estimates and Forecasts, By Type (2020-2032) (USD Billion)
12.4.8.4 China Digital Advertising Market Estimates and Forecasts, By Format (2020-2032) (USD Billion)
12.4.8.5 China Digital Advertising Market Estimates and Forecasts, By End Use Industry (2020-2032) (USD Billion)
12.4.9 India
12.4.9.1 India Digital Advertising Market Estimates and Forecasts, By Platform (2020-2032) (USD Billion)
12.4.9.2 India Digital Advertising Market Estimates and Forecasts, By Offering (2020-2032) (USD Billion)
12.4.9.3 India Digital Advertising Market Estimates and Forecasts, By Type (2020-2032) (USD Billion)
12.4.9.4 India Digital Advertising Market Estimates and Forecasts, By Format (2020-2032) (USD Billion)
12.4.9.5 India Digital Advertising Market Estimates and Forecasts, By End Use Industry (2020-2032) (USD Billion)
12.4.10 Japan
12.4.10.1 Japan Digital Advertising Market Estimates and Forecasts, By Platform (2020-2032) (USD Billion)
12.4.10.2 Japan Digital Advertising Market Estimates and Forecasts, By Offering (2020-2032) (USD Billion)
12.4.10.3 Japan Digital Advertising Market Estimates and Forecasts, By Type (2020-2032) (USD Billion)
12.4.10.4 Japan Digital Advertising Market Estimates and Forecasts, By Format (2020-2032) (USD Billion)
12.4.10.5 Japan Digital Advertising Market Estimates and Forecasts, By End Use Industry (2020-2032) (USD Billion)
12.4.11 South Korea
12.4.11.1 South Korea Digital Advertising Market Estimates and Forecasts, By Platform (2020-2032) (USD Billion)
12.4.11.2 South Korea Digital Advertising Market Estimates and Forecasts, By Offering (2020-2032) (USD Billion)
12.4.11.3 South Korea Digital Advertising Market Estimates and Forecasts, By Type (2020-2032) (USD Billion)
12.4.11.4 South Korea Digital Advertising Market Estimates and Forecasts, By Format (2020-2032) (USD Billion)
12.4.11.5 South Korea Digital Advertising Market Estimates and Forecasts, By End Use Industry (2020-2032) (USD Billion)
12.4.12 Vietnam
12.4.12.1 Vietnam Digital Advertising Market Estimates and Forecasts, By Platform (2020-2032) (USD Billion)
12.4.12.2 Vietnam Digital Advertising Market Estimates and Forecasts, By Offering (2020-2032) (USD Billion)
12.4.12.3 Vietnam Digital Advertising Market Estimates and Forecasts, By Type (2020-2032) (USD Billion)
12.4.12.4 Vietnam Digital Advertising Market Estimates and Forecasts, By Format (2020-2032) (USD Billion)
12.4.12.5 Vietnam Digital Advertising Market Estimates and Forecasts, By End Use Industry (2020-2032) (USD Billion)
12.4.13 Singapore
12.4.13.1 Singapore Digital Advertising Market Estimates and Forecasts, By Platform (2020-2032) (USD Billion)
12.4.13.2 Singapore Digital Advertising Market Estimates and Forecasts, By Offering (2020-2032) (USD Billion)
12.4.13.3 Singapore Digital Advertising Market Estimates and Forecasts, By Type (2020-2032) (USD Billion)
12.4.13.4 Singapore Digital Advertising Market Estimates and Forecasts, By Format (2020-2032) (USD Billion)
12.4.13.5 Singapore Digital Advertising Market Estimates and Forecasts, By End Use Industry (2020-2032) (USD Billion)
12.4.14 Australia
12.4.14.1 Australia Digital Advertising Market Estimates and Forecasts, By Platform (2020-2032) (USD Billion)
12.4.14.2 Australia Digital Advertising Market Estimates and Forecasts, By Offering (2020-2032) (USD Billion)
12.4.14.3 Australia Digital Advertising Market Estimates and Forecasts, By Type (2020-2032) (USD Billion)
12.4.14.4 Australia Digital Advertising Market Estimates and Forecasts, By Format (2020-2032) (USD Billion)
12.4.14.5 Australia Digital Advertising Market Estimates and Forecasts, By End Use Industry (2020-2032) (USD Billion)
12.4.15 Rest Of Asia Pacific
12.4.15.1 Rest Of Asia Pacific Digital Advertising Market Estimates and Forecasts, By Platform (2020-2032) (USD Billion)
12.4.15.2 Rest Of Asia Pacific Digital Advertising Market Estimates and Forecasts, By Offering (2020-2032) (USD Billion)
12.4.15.3 Rest Of Asia Pacific Digital Advertising Market Estimates and Forecasts, By Type (2020-2032) (USD Billion)
12.4.15.4 Rest Of Asia Pacific Digital Advertising Market Estimates and Forecasts, By Format (2020-2032) (USD Billion)
12.4.15.5 Rest Of Asia Pacific Digital Advertising Market Estimates and Forecasts, By End Use Industry (2020-2032) (USD Billion)
12.5 Middle East and Africa
12.5.1 Middle East
12.5.1.1 Trends Analysis
12.5.1.2 Middle East Digital Advertising Market Estimates and Forecasts, By Country (2020-2032) (USD Billion)
12.5.1.3 Middle East Digital Advertising Market Estimates and Forecasts, By Platform (2020-2032) (USD Billion)
12.5.1.4 Middle East Digital Advertising Market Estimates and Forecasts, By Offering (2020-2032) (USD Billion)
12.5.1.5 Middle East Digital Advertising Market Estimates and Forecasts, By Type (2020-2032) (USD Billion)
12.5.1.6 Middle East Digital Advertising Market Estimates and Forecasts, By Format (2020-2032) (USD Billion)
12.5.1.7 Middle East Digital Advertising Market Estimates and Forecasts, By End Use Industry (2020-2032) (USD Billion)
12.5.1.8 UAE
12.5.1.8.1 UAE Digital Advertising Market Estimates and Forecasts, By Platform (2020-2032) (USD Billion)
12.5.1.8.2 UAE Digital Advertising Market Estimates and Forecasts, By Offering (2020-2032) (USD Billion)
12.5.1.8.3 UAE Digital Advertising Market Estimates and Forecasts, By Type (2020-2032) (USD Billion)
12.5.1.8.4 UAE Digital Advertising Market Estimates and Forecasts, By Format (2020-2032) (USD Billion)
12.5.1.8.5 UAE Digital Advertising Market Estimates and Forecasts, By End Use Industry (2020-2032) (USD Billion)
12.5.1.9 Egypt
12.5.1.9.1 Egypt Digital Advertising Market Estimates and Forecasts, By Platform (2020-2032) (USD Billion)
12.5.1.9.2 Egypt Digital Advertising Market Estimates and Forecasts, By Offering (2020-2032) (USD Billion)
12.5.1.9.3 Egypt Digital Advertising Market Estimates and Forecasts, By Type (2020-2032) (USD Billion)
12.5.1.9.4 Egypt Digital Advertising Market Estimates and Forecasts, By Format (2020-2032) (USD Billion)
12.5.1.9.5 Egypt Digital Advertising Market Estimates and Forecasts, By End Use Industry (2020-2032) (USD Billion)
12.5.1.10 Saudi Arabia
12.5.1.10.1 Saudi Arabia Digital Advertising Market Estimates and Forecasts, By Platform (2020-2032) (USD Billion)
12.5.1.10.2 Saudi Arabia Digital Advertising Market Estimates and Forecasts, By Offering (2020-2032) (USD Billion)
12.5.1.10.3 Saudi Arabia Digital Advertising Market Estimates and Forecasts, By Type (2020-2032) (USD Billion)
12.5.1.10.4 Saudi Arabia Digital Advertising Market Estimates and Forecasts, By Format (2020-2032) (USD Billion)
12.5.1.10.5 Saudi Arabia Digital Advertising Market Estimates and Forecasts, By End Use Industry (2020-2032) (USD Billion)
12.5.1.11 Qatar
12.5.1.11.1 Qatar Digital Advertising Market Estimates and Forecasts, By Platform (2020-2032) (USD Billion)
12.5.1.11.2 Qatar Digital Advertising Market Estimates and Forecasts, By Offering (2020-2032) (USD Billion)
12.5.1.11.3 Qatar Digital Advertising Market Estimates and Forecasts, By Type (2020-2032) (USD Billion)
12.5.1.11.4 Qatar Digital Advertising Market Estimates and Forecasts, By Format (2020-2032) (USD Billion)
12.5.1.11.5 Qatar Digital Advertising Market Estimates and Forecasts, By End Use Industry (2020-2032) (USD Billion)
12.5.1.12 Rest Of Middle East
12.5.1.12.1 Rest Of Middle East Digital Advertising Market Estimates and Forecasts, By Platform (2020-2032) (USD Billion)
12.5.1.12.2 Rest Of Middle East Digital Advertising Market Estimates and Forecasts, By Offering (2020-2032) (USD Billion)
12.5.1.12.3 Rest Of Middle East Digital Advertising Market Estimates and Forecasts, By Type (2020-2032) (USD Billion)
12.5.1.12.4 Rest Of Middle East Digital Advertising Market Estimates and Forecasts, By Format (2020-2032) (USD Billion)
12.5.1.12.5 Rest Of Middle East Digital Advertising Market Estimates and Forecasts, By End Use Industry (2020-2032) (USD Billion)
12.5.2 Africa
12.5.2.1 Trends Analysis
12.5.2.2 Africa Digital Advertising Market Estimates and Forecasts, By Country (2020-2032) (USD Billion)
12.5.2.3 Africa Digital Advertising Market Estimates and Forecasts, By Platform (2020-2032) (USD Billion)
12.5.2.4 Africa Digital Advertising Market Estimates and Forecasts, By Offering (2020-2032) (USD Billion)
12.5.2.5 Africa Digital Advertising Market Estimates and Forecasts, By Type (2020-2032) (USD Billion)
12.5.2.6 Africa Digital Advertising Market Estimates and Forecasts, By Format (2020-2032) (USD Billion)
12.5.2.7 Africa Digital Advertising Market Estimates and Forecasts, By End Use Industry (2020-2032) (USD Billion)
12.5.2.8 South Africa
12.5.2.8.1 South Africa Digital Advertising Market Estimates and Forecasts, By Platform (2020-2032) (USD Billion)
12.5.2.8.2 South Africa Digital Advertising Market Estimates and Forecasts, By Offering (2020-2032) (USD Billion)
12.5.2.8.3 South Africa Digital Advertising Market Estimates and Forecasts, By Type (2020-2032) (USD Billion)
12.5.2.8.4 South Africa Digital Advertising Market Estimates and Forecasts, By Format (2020-2032) (USD Billion)
12.5.2.8.5 South Africa Digital Advertising Market Estimates and Forecasts, By End Use Industry (2020-2032) (USD Billion)
12.5.2.9 Nigeria
12.5.2.9.1 Nigeria Digital Advertising Market Estimates and Forecasts, By Platform (2020-2032) (USD Billion)
12.5.2.9.2 Nigeria Digital Advertising Market Estimates and Forecasts, By Offering (2020-2032) (USD Billion)
12.5.2.9.3 Nigeria Digital Advertising Market Estimates and Forecasts, By Type (2020-2032) (USD Billion)
12.5.2.9.4 Nigeria Digital Advertising Market Estimates and Forecasts, By Format (2020-2032) (USD Billion)
12.5.2.9.5 Nigeria Digital Advertising Market Estimates and Forecasts, By End Use Industry (2020-2032) (USD Billion)
12.5.2.10 Rest Of Africa
12.5.2.10.1 Rest Of Africa Digital Advertising Market Estimates and Forecasts, By Platform (2020-2032) (USD Billion)
12.5.2.10.2 Rest Of Africa Digital Advertising Market Estimates and Forecasts, By Offering (2020-2032) (USD Billion)
12.5.2.10.3 Rest Of Africa Digital Advertising Market Estimates and Forecasts, By Type (2020-2032) (USD Billion)
12.5.2.10.4 Rest Of Africa Digital Advertising Market Estimates and Forecasts, By Format (2020-2032) (USD Billion)
12.5.2.10.5 Rest Of Africa Digital Advertising Market Estimates and Forecasts, By End Use Industry (2020-2032) (USD Billion)
12.6 Latin America
12.6.1 Trends Analysis
12.6.2 Latin America Digital Advertising Market Estimates and Forecasts, By Country (2020-2032) (USD Billion)
12.6.3 Latin America Digital Advertising Market Estimates and Forecasts, By Platform (2020-2032) (USD Billion)
12.6.4 Latin America Digital Advertising Market Estimates and Forecasts, By Offering (2020-2032) (USD Billion)
12.6.5 Latin America Digital Advertising Market Estimates and Forecasts, By Type (2020-2032) (USD Billion)
12.6.6 Latin America Digital Advertising Market Estimates and Forecasts, By Format (2020-2032) (USD Billion)
12.6.7 Latin America Digital Advertising Market Estimates and Forecasts, By End Use Industry (2020-2032) (USD Billion)
12.6.8 Brazil
12.6.8.1 Brazil Digital Advertising Market Estimates and Forecasts, By Platform (2020-2032) (USD Billion)
12.6.8.2 Brazil Digital Advertising Market Estimates and Forecasts, By Offering (2020-2032) (USD Billion)
12.6.8.3 Brazil Digital Advertising Market Estimates and Forecasts, By Type (2020-2032) (USD Billion)
12.6.8.4 Brazil Digital Advertising Market Estimates and Forecasts, By Format (2020-2032) (USD Billion)
12.6.8.5 Brazil Digital Advertising Market Estimates and Forecasts, By End Use Industry (2020-2032) (USD Billion)
12.6.9 Argentina
12.6.9.1 Argentina Digital Advertising Market Estimates and Forecasts, By Platform (2020-2032) (USD Billion)
12.6.9.2 Argentina Digital Advertising Market Estimates and Forecasts, By Offering (2020-2032) (USD Billion)
12.6.9.3 Argentina Digital Advertising Market Estimates and Forecasts, By Type (2020-2032) (USD Billion)
12.6.9.4 Argentina Digital Advertising Market Estimates and Forecasts, By Format (2020-2032) (USD Billion)
12.6.9.5 Argentina Digital Advertising Market Estimates and Forecasts, By End Use Industry (2020-2032) (USD Billion)
12.6.10 Colombia
12.6.10.1 Colombia Digital Advertising Market Estimates and Forecasts, By Platform (2020-2032) (USD Billion)
12.6.10.2 Colombia Digital Advertising Market Estimates and Forecasts, By Offering (2020-2032) (USD Billion)
12.6.10.3 Colombia Digital Advertising Market Estimates and Forecasts, By Type (2020-2032) (USD Billion)
12.6.10.4 Colombia Digital Advertising Market Estimates and Forecasts, By Format (2020-2032) (USD Billion)
12.6.10.5 Colombia Digital Advertising Market Estimates and Forecasts, By End Use Industry (2020-2032) (USD Billion)
12.6.11 Rest Of Latin America
12.6.11.1 Rest Of Latin America Digital Advertising Market Estimates and Forecasts, By Platform (2020-2032) (USD Billion)
12.6.11.2 Rest Of Latin America Digital Advertising Market Estimates and Forecasts, By Offering (2020-2032) (USD Billion)
12.6.11.3 Rest Of Latin America Digital Advertising Market Estimates and Forecasts, By Type (2020-2032) (USD Billion)
12.6.11.4 Rest Of Latin America Digital Advertising Market Estimates and Forecasts, By Format (2020-2032) (USD Billion)
12.6.11.5 Rest Of Latin America Digital Advertising Market Estimates and Forecasts, By End Use Industry (2020-2032) (USD Billion)
13. Company Profiles
13.1 Adobe
13.1.1 Company Overview
13.1.2 Financial
13.1.3 Products/ Services Offered
13.1.4 SWOT Analysis
13.2 The Trade Desk
13.2.1 Company Overview
13.2.2 Financial
13.2.3 Products/ Services Offered
13.2.4 SWOT Analysis
13.3 WPP plc
13.3.1 Company Overview
13.3.2 Financial
13.3.3 Products/ Services Offered
13.3.4 SWOT Analysis
13.4 Omnicom Group
13.4.1 Company Overview
13.4.2 Financial
13.4.3 Products/ Services Offered
13.4.4 SWOT Analysis
13.5 Publicis Groupe
13.5.1 Company Overview
13.5.2 Financial
13.5.3 Products/ Services Offered
13.5.4 SWOT Analysis
13.6 Google
13.6.1 Company Overview
13.6.2 Financial
13.6.3 Products/ Services Offered
13.6.4 SWOT Analysis
13.7 Facebook
13.7.1 Company Overview
13.7.2 Financial
13.7.3 Products/ Services Offered
13.7.4 SWOT Analysis
13.8 Amazon
13.8.1 Company Overview
13.8.2 Financial
13.8.3 Products/ Services Offered
13.8.4 SWOT Analysis
13.9 Microsoft
13.9.1 Company Overview
13.9.2 Financial
13.9.3 Products/ Services Offered
13.9.4 SWOT Analysis
13.10 Snap Inc
13.12.1 Company Overview
13.12.2 Financial
13.12.3 Products/ Services Offered
13.12.4 SWOT Analysis
14. Use Cases and Best Practices
15. Conclusion
An accurate research report requires proper strategizing as well as implementation. There are multiple factors involved in the completion of good and accurate research report and selecting the best methodology to compete the research is the toughest part. Since the research reports we provide play a crucial role in any company’s decision-making process, therefore we at SNS Insider always believe that we should choose the best method which gives us results closer to reality. This allows us to reach at a stage wherein we can provide our clients best and accurate investment to output ratio.
Each report that we prepare takes a timeframe of 350-400 business hours for production. Starting from the selection of titles through a couple of in-depth brain storming session to the final QC process before uploading our titles on our website we dedicate around 350 working hours. The titles are selected based on their current market cap and the foreseen CAGR and growth.
The 5 steps process:
Step 1: Secondary Research:
Secondary Research or Desk Research is as the name suggests is a research process wherein, we collect data through the readily available information. In this process we use various paid and unpaid databases which our team has access to and gather data through the same. This includes examining of listed companies’ annual reports, Journals, SEC filling etc. Apart from this our team has access to various associations across the globe across different industries. Lastly, we have exchange relationships with various university as well as individual libraries.

Step 2: Primary Research
When we talk about primary research, it is a type of study in which the researchers collect relevant data samples directly, rather than relying on previously collected data. This type of research is focused on gaining content specific facts that can be sued to solve specific problems. Since the collected data is fresh and first hand therefore it makes the study more accurate and genuine.
We at SNS Insider have divided Primary Research into 2 parts.
Part 1 wherein we interview the KOLs of major players as well as the upcoming ones across various geographic regions. This allows us to have their view over the market scenario and acts as an important tool to come closer to the accurate market numbers. As many as 45 paid and unpaid primary interviews are taken from both the demand and supply side of the industry to make sure we land at an accurate judgement and analysis of the market.
This step involves the triangulation of data wherein our team analyses the interview transcripts, online survey responses and observation of on filed participants. The below mentioned chart should give a better understanding of the part 1 of the primary interview.

Part 2: In this part of primary research the data collected via secondary research and the part 1 of the primary research is validated with the interviews from individual consultants and subject matter experts.
Consultants are those set of people who have at least 12 years of experience and expertise within the industry whereas Subject Matter Experts are those with at least 15 years of experience behind their back within the same space. The data with the help of two main processes i.e., FGDs (Focused Group Discussions) and IDs (Individual Discussions). This gives us a 3rd party nonbiased primary view of the market scenario making it a more dependable one while collation of the data pointers.
Step 3: Data Bank Validation
Once all the information is collected via primary and secondary sources, we run that information for data validation. At our intelligence centre our research heads track a lot of information related to the market which includes the quarterly reports, the daily stock prices, and other relevant information. Our data bank server gets updated every fortnight and that is how the information which we collected using our primary and secondary information is revalidated in real time.

Step 4: QA/QC Process
After all the data collection and validation our team does a final level of quality check and quality assurance to get rid of any unwanted or undesired mistakes. This might include but not limited to getting rid of the any typos, duplication of numbers or missing of any important information. The people involved in this process include technical content writers, research heads and graphics people. Once this process is completed the title gets uploader on our platform for our clients to read it.
Step 5: Final QC/QA Process:
This is the last process and comes when the client has ordered the study. In this process a final QA/QC is done before the study is emailed to the client. Since we believe in giving our clients a good experience of our research studies, therefore, to make sure that we do not lack at our end in any way humanly possible we do a final round of quality check and then dispatch the study to the client.
Key Segments:
By Platform
Computer
Smartphone
Others
By Offering
Solution
Services
By Type
Search Advertising
Banner Advertising
Video Advertising
Social Media Advertising
Native Advertising
Interstitial Advertising
By Format
Text
Image
Video
Others
By End Use Industry
BFSI
Automotive
IT & Telecommunication
Healthcare
Consumer Electronics
Retail
Media & Entertainment
Education
Others
Request for Segment Customization as per your Business Requirement: Segment Customization Request
REGIONAL COVERAGE:
North America
US
Canada
Mexico
Europe
Eastern Europe
Poland
Romania
Hungary
Turkey
Rest of Eastern Europe
Western Europe
Germany
France
UK
Italy
Spain
Netherlands
Switzerland
Austria
Rest of Western Europe
Asia Pacific
China
India
Japan
South Korea
Vietnam
Singapore
Australia
Rest of Asia Pacific
Middle East & Africa
Middle East
UAE
Egypt
Saudi Arabia
Qatar
Rest of the Middle East
Africa
Nigeria
South Africa
Rest of Africa
Latin America
Brazil
Argentina
Colombia
Rest of Latin America
Request for Country Level Research Report: Country Level Customization Request
Available Customization
With the given market data, SNS Insider offers customization as per the company’s specific needs. The following customization options are available for the report:
Product Analysis
Criss-Cross segment analysis (e.g. Product X Application)
Product Matrix which gives a detailed comparison of the product portfolio of each company
Geographic Analysis
Additional countries in any of the regions
Company Information
Detailed analysis and profiling of additional market players (Up to five)
The Telecom Expense Management Market was valued at USD 3.69 billion in 2023 and will reach USD 11.17 billion by 2032, growing at a CAGR of 13.14% by 2032.
AI in Financial Services Market was valued at USD XX billion in 2023 and is expected to reach USD XX billion by 2032, growing at a CAGR of XX% by 2032.
The Voice Picking Solutions Market Size was USD 2.6 Billion in 2023 & is expected to reach USD 8.78 Billion by 2032, growing at a CAGR of 14.5% by 2024-2032
Embedded AI Market was valued at USD 8.79 billion in 2023 and is expected to reach USD 29.07 billion by 2032, growing at a CAGR of 14.28% from 2024-2032.
The Email Marketing Software Market was valued at USD 1.4 Billion in 2023 and will reach USD 3.8 Billion by 2032, growing at a CAGR of 11.39% by 2032.
Procurement Software Market size was valued at USD 7.71 Billion in 2023. It is expected to Reach USD 18.76 Billion by 2032 and grow at a CAGR of 10.40% over the forecast period of 2024-2032.

Hi! Click one of our member below to chat on Phone
© 2025 All Rights Reserved by SNS Insider Pvt Ltd


