image

Digital Accessibility Software Market Report Scope & Overview:

Digital Accessibility Software Market was valued at USD 670.37 million in 2023 and is expected to reach USD 1373.92 million by 2032, growing at a CAGR of 8.35% from 2024-2032 

This report includes key insights on user demographics and accessibility needs, highlighting the demand for solutions that cater to diverse user groups, including those with disabilities. It also examines the regulatory impact, with increasing regulations driving the adoption of digital accessibility standards. Funding and investment trends indicate strong financial support for the sector, spurring innovation. Additionally, AI integration in accessibility tools is enhancing user experiences, providing smarter solutions for diverse accessibility challenges. The market is poised for growth as technology advances and accessibility becomes a priority for businesses and governments worldwide.

U.S. Digital Accessibility Software Market was valued at USD 211.09 million in 2023 and is expected to reach USD 431.50 million by 2032, growing at a CAGR of 8.27% from 2024-2032. The growth of the U.S. Digital Accessibility Software Market is driven by increasing regulatory requirements for accessible digital experiences, boosting demand for compliance solutions. The rise in awareness of inclusivity, along with a growing number of individuals with disabilities, is pushing businesses to prioritize digital accessibility. Additionally, advancements in AI and machine learning are enhancing the efficiency and effectiveness of accessibility tools. Increased investment in technology innovation and support for accessibility initiatives further accelerates market growth.

Digital Accessibility Software Market Dynamics

Drivers

  • Businesses Drive Digital Accessibility Adoption by Aligning with ESG, DEI, and CSR Initiatives to Enhance Inclusivity, Compliance, and Market Reach.

Companies globally are focusing on inclusivity and sustainability, aligning their strategies with Environmental, Social, and Governance (ESG) guidelines and Diversity, Equity, and Inclusion (DEI) initiatives. As firms focus on corporate social responsibility (CSR), the need for digital accessibility solutions has been growing. Making digital platforms accessible to people with disabilities is now a significant part of brand reputation, customer interaction, and regulatory requirements. Businesses acknowledge that accessible digital experiences increase user reach, customer satisfaction, and legal compliance. Moreover, accessibility efforts enable employee productivity through inclusive digital work environments. By embedding accessibility solutions within their digital ecosystems, businesses are not only complying with ethical and legal requirements but also achieving a competitive edge in a more responsible and consumer-aware marketplace.

Restraints

  • High Costs of Developing and Maintaining Digital Accessibility Solutions Hinder Adoption, Especially for Small and Medium Enterprises (SMEs) with Limited Budgets.

Creating and sustaining accessible digital platforms requires huge financial outlays, which prove to be challenging for organizations, especially small and medium enterprises (SMEs). The expense of incorporating accessibility tools, redesigning websites, and maintaining compliance with changing regulations can be staggering. Many businesses struggle to allocate budgets for specialized software, expert consultations, and continuous updates to meet accessibility standards. Additionally, implementing accessibility solutions often requires employee training and IT system upgrades, further increasing expenses. For SMEs operating with limited financial flexibility, these costs can delay or prevent adoption, despite the long-term benefits of inclusivity and legal compliance. Absent from cost-saving remedies or monetary inducements, most companies could put accessibility work on the backburner, curtailing comprehensive application of accessible digital experiences industry-wide.

Opportunities

  • AI and Machine Learning Drive Automated Digital Accessibility Solutions, Reducing Costs and Enhancing Inclusivity Across Industries.

A combination of artificial intelligence (AI) and machine learning is changing digital accessibility into automated solutions for improved user experience at lower costs and reduced manpower. Artificial intelligence -powered technology, including real-time captioning, voice-to-text, and automated alternative text, is providing digital content in a form accessible to those with disabilities. Technologies automate compliance with accessibility requirements at a much reduced level of human intervention. More and more businesses are adopting AI-based solutions for enhancing site navigation, text-to-speech conversions, and adaptive user interfaces in order to become inclusive at moderate development expense. As technology develops further, digital accessibility solutions will be more intelligent, scalable, and efficient, promoting mass adoption across industries. The capabilities to offer seamless, automated accessibility features are transforming the way organizations embrace inclusivity in the digital environment.

Challenges

  • Evolving and Region-Specific Accessibility Regulations Make Consistent Compliance Difficult for Businesses Operating Across Global Markets.

Organizations are increasingly struggling with compliance with digital accessibility legislation because of changing standards and region-specific legislative requirements. Legislation on accessibility, including the Americans with Disabilities Act (ADA), Web Content Accessibility Guidelines (WCAG), and the European Accessibility Act, differs across regions, making it difficult for organizations to find common solutions. Multi-nationals have to deal with a complicated regulatory environment, where in many cases several compliance approaches are needed to cover diverse legal environments. Relatively frequent updates to accessibility guidelines complicate compliance, calling for ongoing surveillance and updating. Furthermore, the absence of a unified enforcement framework causes uncertainty, causing some companies to defer accessibility until court proceedings are initiated. Without global standardized policies, obtaining uniform digital accessibility compliance is still an insurmountable barrier, affecting the adoption and deployment processes.

Digital Accessibility Software Market Segment Analysis

By Offering

Website Accessibility Software held the highest revenue share of approximately 78% in the Digital Accessibility Software Market in 2023. Its dominance stems from the increasing regulatory compliance requirements and the growing demand for inclusive web experiences. Businesses and organizations prioritize website accessibility to meet legal mandates such as WCAG guidelines and ADA regulations. Additionally, rising digital transformation efforts across industries have fueled investments in accessibility solutions. The widespread adoption of e-commerce, online education, and digital services further reinforces its market leadership.

Color Contrast Checker Software is expected to expand at the fastest CAGR of approximately 10.34% during the period 2024-2032. Expansion is fueled by growing awareness about visual disabilities and the demand for accessible digital media. Tighter compliance regulations compel organizations to adopt contrast-checking tools in their design processes. In addition, the increasing use of AI-based accessibility testing and automation has improved contrast-checking solutions in terms of efficiency. The expanding use of web and mobile design best practices continues to fuel demand for this software.

By Enterprise Size

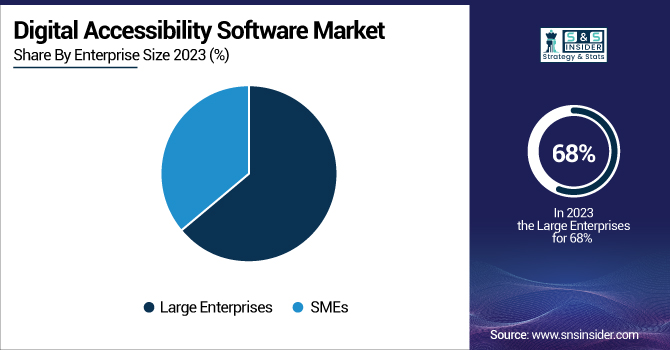
Large Businesses commanded the largest revenue percentage of about 68% in the Digital Accessibility Software Market in 2023. This is driven by significant budgets for observance of accessibility law and a desire to advance digital inclusivity over large numbers of customers. Large Businesses include accessibility among their priorities to avoid legal consequences, build a positive brand image, and target multiple audiences. Furthermore, their mass-scale online activities, such as sites, apps, and internal websites, require sophisticated accessibility solutions, driving adoption and market share leadership even further.

SMEs are expected to expand with the fastest CAGR of around 9.89% during 2024-2032. The growth is boosted by growing awareness of accessibility compliance as well as the affordability of cloud solutions. Inclusivity drives from government drives the adoption of accessibility software by SMEs. Competitive pressures also drive smaller companies to make users a priority for wider customer access. Growth of AI-based, affordable accessibility tools also allows SMEs to accommodate compliance measures without heavy financial burdens.

Regional Analysis

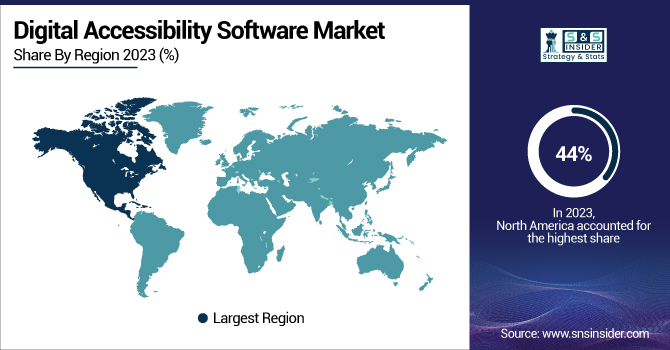
North America held the highest revenue share of approximately 44% in the Digital Accessibility Software Market in 2023. This dominance is driven by stringent accessibility regulations, such as the Americans with Disabilities Act (ADA) and Web Content Accessibility Guidelines (WCAG). The presence of major technology companies and early adoption of digital transformation initiatives further boost market growth. Additionally, rising corporate commitments to inclusivity and a strong focus on customer experience enhancement contribute to the region’s leadership in digital accessibility solutions.

Asia Pacific is expected to expand at the fastest CAGR of approximately 10.06% during the period from 2024 to 2032. This growth is driven by rising internet penetration, fast-paced digitalization, and growing awareness of accessibility compliance. Regional governments are enforcing tougher regulations to facilitate digital inclusivity. Moreover, growth in e-commerce, online learning, and mobile application penetration fuels demand for accessibility software. Increasing visibility of startups and corporates investing in accessible digital experiences also fuels market growth in the region.

Key Players

  • accessiBe Inc. (accessWidget, accessFlow)

  • AccessibilityChecker.org INC (AccessibilityChecker, ADA Compliance Checker)

  • AudioEye, Inc. (AudioEye Platform, Auto-Remediation)

  • Axess Lab (Axess Lab's WCAG, Axess Lab's ADA Compliance)

  • Deque Systems, Inc. (WorldSpace, axe-core)

  • Evinced Inc. (Evinced Accessibility Scanner, Evinced Automated Testing)

  • Level Access (WorldSpace, A11yTools)

  • Silktide Ltd (Silktide Platform, Silktide Analyze)

  • Siteimprove (Siteimprove Accessibility, Siteimprove Analytics)

  • UsableNet Inc. (UsableNet Accessibility, UsableNet Compliance)

  • SmartBear (TestComplete, accessibility insights)

  • Glimpse (Glimpse Scanner, Glimpse Validator)

  • Alcove (Alcove A11y, Alcove Insights)

  • TetraLogical (TetraLogical Accessibility Scanner, TetraLogical WCAG Auditor)

  • EqualWeb (EqualWeb Accessibility Suite, EqualWeb Compliance Widget)

  • Fable Tech Labs (Fable Design Platform, Fable Accessibility Auditing)

  • UserWay (UserWay Accessibility Widget, UserWay AI-powered Solutions)

  • WebAIM (WAVE, WAVE API)

Recent Developments:

  • 2024: AudioEye introduced an Accessibility Testing Software Development Kit (SDK), enabling developers to integrate accessibility testing directly into their workflows. This tool helps identify and fix issues early in the development process, ensuring more inclusive web experiences.

  • 2024: Level Access acquired UserWay, combining its expertise with UserWay’s AI-driven accessibility technology. This unification aims to enhance digital accessibility solutions, enabling organizations to achieve compliance more efficiently.

Digital Accessibility Software Market Report Scope:

Report Attributes Details
Market Size in 2023 US$ 670.37 Million
Market Size by 2032 US$ 1373.92 Million
CAGR CAGR of 8.35% From 2024 to 2032
Base Year 2023
Forecast Period 2024-2032
Historical Data 2020-2022
Report Scope & Coverage Market Size, Segments Analysis, Competitive  Landscape, Regional Analysis, DROC & SWOT Analysis, Forecast Outlook
Key Segments • By Offering (Website Accessibility Software, Color Contrast Checker Software)
• By Enterprise Size (SMEs, Large Enterprises)
Regional Analysis/Coverage North America (US, Canada, Mexico), Europe (Eastern Europe [Poland, Romania, Hungary, Turkey, Rest of Eastern Europe] Western Europe] Germany, France, UK, Italy, Spain, Netherlands, Switzerland, Austria, Rest of Western Europe]), Asia Pacific (China, India, Japan, South Korea, Vietnam, Singapore, Australia, Rest of Asia Pacific), Middle East & Africa (Middle East [UAE, Egypt, Saudi Arabia, Qatar, Rest of Middle East], Africa [Nigeria, South Africa, Rest of Africa], Latin America (Brazil, Argentina, Colombia, Rest of Latin America)
Company Profiles accessiBe Inc., AccessibilityChecker.org INC, AudioEye, Inc., Axess Lab, Deque Systems, Inc., Evinced Inc., Level Access, Silktide Ltd, Siteimprove, UsableNet Inc., SmartBear, Glimpse, Alcove, TetraLogical, EqualWeb, Fable Tech Labs, UserWay, WebAIM.

Frequently Asked Questions

ANS: Digital Accessibility Software Market was valued at USD 670.37 million in 2023 and is expected to reach USD 1373.92 million by 2032, growing at a CAGR of 8.35% from 2024-2032 

ANS: Website Accessibility Software held the highest revenue share of 78% in 2023 due to compliance needs and digital transformation.

ANS: Large Enterprises held a 68% market share in 2023 due to strong budgets for compliance and accessibility needs.

ANS: North America had the highest revenue share of 44% in 2023 due to strict accessibility laws like ADA.

ANS: U.S. Digital Accessibility Software Market was valued at USD 211.09 million in 2023 and is expected to reach USD 431.50 million by 2032, growing at a CAGR of 8.27% from 2024-2032 

Table of Content

1. Introduction

1.1 Market Definition

1.2 Scope (Inclusion and Exclusions)

1.3 Research Assumptions

2. Executive Summary

2.1 Market Overview

2.2 Regional Synopsis

2.3 Competitive Summary

3. Research Methodology

3.1 Top-Down Approach

3.2 Bottom-up Approach

3.3. Data Validation

3.4 Primary Interviews

4. Market Dynamics Impact Analysis

4.1 Market Driving Factors Analysis

4.1.2 Drivers

4.1.2 Restraints

4.1.3 Opportunities

4.1.4 Challenges

4.2 PESTLE Analysis

4.3 Porter’s Five Forces Model

5. Statistical Insights and Trends Reporting

5.1 User Demographics and Accessibility Needs

5.2 Regulatory Impact

5.3 Funding and Investment Trends

5.4 AI Integration in Accessibility Tools

6. Competitive Landscape

6.1 List of Major Companies, By Region

6.2 Market Share Analysis, By Region

6.3 Product Benchmarking

6.3.1 Product specifications and features

6.3.2 Pricing

6.4 Strategic Initiatives

6.4.1 Marketing and promotional activities

6.4.2 Distribution and supply chain strategies

6.4.3 Expansion plans and new product launches

6.4.4 Strategic partnerships and collaborations

6.5 Technological Advancements

6.6 Market Positioning and Branding

7. Digital Accessibility Software Market Segmentation, By Offering

7.1 Chapter Overview

7.2 Website Accessibility Software

7.2.1 Website Accessibility Software Market Trends Analysis (2020-2032)

7.2.2 Website Accessibility Software Market Size Estimates and Forecasts to 2032 (USD Million)

7.3 Color Contrast Checker Software

7.3.1 Color Contrast Checker Software Market Trends Analysis (2020-2032)

7.3.2 Color Contrast Checker Software Market Size Estimates and Forecasts to 2032 (USD Million)

8. Digital Accessibility Software Market Segmentation, By Enterprise Size

8.1 Chapter Overview

8.2 SMEs

8.2.1 SMEs Market Trends Analysis (2020-2032)

8.2.2 SMEs Market Size Estimates and Forecasts to 2032 (USD Million)

8.3 Large Enterprises

8.3.1 Large Enterprises Market Trends Analysis (2020-2032)

8.3.2 Large Enterprises Market Size Estimates and Forecasts to 2032 (USD Million)

9. Regional Analysis

9.1 Chapter Overview

9.2 North America

9.2.1 Trends Analysis

9.2.2 North America Digital Accessibility Software Market Estimates and Forecasts, by Country (2020-2032) (USD Million)

9.2.3 North America Digital Accessibility Software Market Estimates and Forecasts, By Offering (2020-2032) (USD Million) 

9.2.4 North America Digital Accessibility Software Market Estimates and Forecasts, By Enterprise Size (2020-2032) (USD Million)

9.2.5 USA

9.2.5.1 USA Digital Accessibility Software Market Estimates and Forecasts, By Offering (2020-2032) (USD Million)

9.2.5.2 USA Digital Accessibility Software Market Estimates and Forecasts, By Enterprise Size (2020-2032) (USD Million)

9.2.6 Canada

9.2.6.1 Canada Digital Accessibility Software Market Estimates and Forecasts, By Offering (2020-2032) (USD Million)

9.2.6.2 Canada Digital Accessibility Software Market Estimates and Forecasts, By Enterprise Size (2020-2032) (USD Million)

9.2.7 Mexico

9.2.7.1 Mexico Digital Accessibility Software Market Estimates and Forecasts, By Offering (2020-2032) (USD Million)

9.2.7.2 Mexico Digital Accessibility Software Market Estimates and Forecasts, By Enterprise Size (2020-2032) (USD Million)

9.3 Europe

9.3.1 Eastern Europe

9.3.1.1 Trends Analysis

9.3.1.2 Eastern Europe Digital Accessibility Software Market Estimates and Forecasts, by Country (2020-2032) (USD Million)

9.3.1.3 Eastern Europe Digital Accessibility Software Market Estimates and Forecasts, By Offering (2020-2032) (USD Million) 

9.3.1.4 Eastern Europe Digital Accessibility Software Market Estimates and Forecasts, By Enterprise Size (2020-2032) (USD Million)

9.3.1.5 Poland

9.3.1.5.1 Poland Digital Accessibility Software Market Estimates and Forecasts, By Offering (2020-2032) (USD Million)

9.3.1.5.2 Poland Digital Accessibility Software Market Estimates and Forecasts, By Enterprise Size (2020-2032) (USD Million)

9.3.1.6 Romania

9.3.1.6.1 Romania Digital Accessibility Software Market Estimates and Forecasts, By Offering (2020-2032) (USD Million)

9.3.1.6.2 Romania Digital Accessibility Software Market Estimates and Forecasts, By Enterprise Size (2020-2032) (USD Million)

9.3.1.7 Hungary

9.3.1.7.1 Hungary Digital Accessibility Software Market Estimates and Forecasts, By Offering (2020-2032) (USD Million)

9.3.1.7.2 Hungary Digital Accessibility Software Market Estimates and Forecasts, By Enterprise Size (2020-2032) (USD Million)

9.3.1.8 Turkey

9.3.1.8.1 Turkey Digital Accessibility Software Market Estimates and Forecasts, By Offering (2020-2032) (USD Million)

9.3.1.8.2 Turkey Digital Accessibility Software Market Estimates and Forecasts, By Enterprise Size (2020-2032) (USD Million)

9.3.1.9 Rest of Eastern Europe

9.3.1.9.1 Rest of Eastern Europe Digital Accessibility Software Market Estimates and Forecasts, By Offering (2020-2032) (USD Million)

9.3.1.9.2 Rest of Eastern Europe Digital Accessibility Software Market Estimates and Forecasts, By Enterprise Size (2020-2032) (USD Million)

9.3.2 Western Europe

9.3.2.1 Trends Analysis

9.3.2.2 Western Europe Digital Accessibility Software Market Estimates and Forecasts, by Country (2020-2032) (USD Million)

9.3.2.3 Western Europe Digital Accessibility Software Market Estimates and Forecasts, By Offering (2020-2032) (USD Million) 

9.3.2.4 Western Europe Digital Accessibility Software Market Estimates and Forecasts, By Enterprise Size (2020-2032) (USD Million)

9.3.2.5 Germany

9.3.2.5.1 Germany Digital Accessibility Software Market Estimates and Forecasts, By Offering (2020-2032) (USD Million)

9.3.2.5.2 Germany Digital Accessibility Software Market Estimates and Forecasts, By Enterprise Size (2020-2032) (USD Million)

9.3.2.6 France

9.3.2.6.1 France Digital Accessibility Software Market Estimates and Forecasts, By Offering (2020-2032) (USD Million)

9.3.2.6.2 France Digital Accessibility Software Market Estimates and Forecasts, By Enterprise Size (2020-2032) (USD Million)

9.3.2.7 UK

9.3.2.7.1 UK Digital Accessibility Software Market Estimates and Forecasts, By Offering (2020-2032) (USD Million)

9.3.2.7.2 UK Digital Accessibility Software Market Estimates and Forecasts, By Enterprise Size (2020-2032) (USD Million)

9.3.2.8 Italy

9.3.2.8.1 Italy Digital Accessibility Software Market Estimates and Forecasts, By Offering (2020-2032) (USD Million)

9.3.2.8.2 Italy Digital Accessibility Software Market Estimates and Forecasts, By Enterprise Size (2020-2032) (USD Million)

9.3.2.9 Spain

9.3.2.9.1 Spain Digital Accessibility Software Market Estimates and Forecasts, By Offering (2020-2032) (USD Million)

9.3.2.9.2 Spain Digital Accessibility Software Market Estimates and Forecasts, By Enterprise Size (2020-2032) (USD Million)

9.3.2.10 Netherlands

9.3.2.10.1 Netherlands Digital Accessibility Software Market Estimates and Forecasts, By Offering (2020-2032) (USD Million)

9.3.2.10.2 Netherlands Digital Accessibility Software Market Estimates and Forecasts, By Enterprise Size (2020-2032) (USD Million)

9.3.2.11 Switzerland

9.3.2.11.1 Switzerland Digital Accessibility Software Market Estimates and Forecasts, By Offering (2020-2032) (USD Million)

9.3.2.11.2 Switzerland Digital Accessibility Software Market Estimates and Forecasts, By Enterprise Size (2020-2032) (USD Million)

9.3.2.12 Austria

9.3.2.12.1 Austria Digital Accessibility Software Market Estimates and Forecasts, By Offering (2020-2032) (USD Million)

9.3.2.12.2 Austria Digital Accessibility Software Market Estimates and Forecasts, By Enterprise Size (2020-2032) (USD Million)

9.3.2.13 Rest of Western Europe

9.3.2.13.1 Rest of Western Europe Digital Accessibility Software Market Estimates and Forecasts, By Offering (2020-2032) (USD Million)

9.3.2.13.2 Rest of Western Europe Digital Accessibility Software Market Estimates and Forecasts, By Enterprise Size (2020-2032) (USD Million)

9.4 Asia Pacific

9.4.1 Trends Analysis

9.4.2 Asia Pacific Digital Accessibility Software Market Estimates and Forecasts, by Country (2020-2032) (USD Million)

9.4.3 Asia Pacific Digital Accessibility Software Market Estimates and Forecasts, By Offering (2020-2032) (USD Million) 

9.4.4 Asia Pacific Digital Accessibility Software Market Estimates and Forecasts, By Enterprise Size (2020-2032) (USD Million)

9.4.5 China

9.4.5.1 China Digital Accessibility Software Market Estimates and Forecasts, By Offering (2020-2032) (USD Million)

9.4.5.2 China Digital Accessibility Software Market Estimates and Forecasts, By Enterprise Size (2020-2032) (USD Million)

9.4.6 India

9.4.5.1 India Digital Accessibility Software Market Estimates and Forecasts, By Offering (2020-2032) (USD Million)

9.4.5.2 India Digital Accessibility Software Market Estimates and Forecasts, By Enterprise Size (2020-2032) (USD Million)

9.4.5 Japan

9.4.5.1 Japan Digital Accessibility Software Market Estimates and Forecasts, By Offering (2020-2032) (USD Million)

9.4.5.2 Japan Digital Accessibility Software Market Estimates and Forecasts, By Enterprise Size (2020-2032) (USD Million)

9.4.6 South Korea

9.4.6.1 South Korea Digital Accessibility Software Market Estimates and Forecasts, By Offering (2020-2032) (USD Million)

9.4.6.2 South Korea Digital Accessibility Software Market Estimates and Forecasts, By Enterprise Size (2020-2032) (USD Million)

9.4.7 Vietnam

9.4.7.1 Vietnam Digital Accessibility Software Market Estimates and Forecasts, By Offering (2020-2032) (USD Million)

9.2.7.2 Vietnam Digital Accessibility Software Market Estimates and Forecasts, By Enterprise Size (2020-2032) (USD Million)

9.4.8 Singapore

9.4.8.1 Singapore Digital Accessibility Software Market Estimates and Forecasts, By Offering (2020-2032) (USD Million)

9.4.8.2 Singapore Digital Accessibility Software Market Estimates and Forecasts, By Enterprise Size (2020-2032) (USD Million)

9.4.9 Australia

9.4.9.1 Australia Digital Accessibility Software Market Estimates and Forecasts, By Offering (2020-2032) (USD Million)

9.4.9.2 Australia Digital Accessibility Software Market Estimates and Forecasts, By Enterprise Size (2020-2032) (USD Million)

9.4.10 Rest of Asia Pacific

9.4.10.1 Rest of Asia Pacific Digital Accessibility Software Market Estimates and Forecasts, By Offering (2020-2032) (USD Million)

9.4.10.2 Rest of Asia Pacific Digital Accessibility Software Market Estimates and Forecasts, By Enterprise Size (2020-2032) (USD Million)

9.5 Middle East and Africa

9.5.1 Middle East

9.5.1.1 Trends Analysis

9.5.1.2 Middle East Digital Accessibility Software Market Estimates and Forecasts, by Country (2020-2032) (USD Million)

9.5.1.3 Middle East Digital Accessibility Software Market Estimates and Forecasts, By Offering (2020-2032) (USD Million) 

9.5.1.4 Middle East Digital Accessibility Software Market Estimates and Forecasts, By Enterprise Size (2020-2032) (USD Million)

9.5.1.5 UAE

9.5.1.5.1 UAE Digital Accessibility Software Market Estimates and Forecasts, By Offering (2020-2032) (USD Million)

9.5.1.5.2 UAE Digital Accessibility Software Market Estimates and Forecasts, By Enterprise Size (2020-2032) (USD Million)

9.5.1.6 Egypt

9.5.1.6.1 Egypt Digital Accessibility Software Market Estimates and Forecasts, By Offering (2020-2032) (USD Million)

9.5.1.6.2 Egypt Digital Accessibility Software Market Estimates and Forecasts, By Enterprise Size (2020-2032) (USD Million)

9.5.1.7 Saudi Arabia

9.5.1.7.1 Saudi Arabia Digital Accessibility Software Market Estimates and Forecasts, By Offering (2020-2032) (USD Million)

9.5.1.7.2 Saudi Arabia Digital Accessibility Software Market Estimates and Forecasts, By Enterprise Size (2020-2032) (USD Million)

9.5.1.8 Qatar

9.5.1.8.1 Qatar Digital Accessibility Software Market Estimates and Forecasts, By Offering (2020-2032) (USD Million)

9.5.1.8.2 Qatar Digital Accessibility Software Market Estimates and Forecasts, By Enterprise Size (2020-2032) (USD Million)

9.5.1.9 Rest of Middle East

9.5.1.9.1 Rest of Middle East Digital Accessibility Software Market Estimates and Forecasts, By Offering (2020-2032) (USD Million)

9.5.1.9.2 Rest of Middle East Digital Accessibility Software Market Estimates and Forecasts, By Enterprise Size (2020-2032) (USD Million)

9.5.2 Africa

9.5.2.1 Trends Analysis

9.5.2.2 Africa Digital Accessibility Software Market Estimates and Forecasts, by Country (2020-2032) (USD Million)

9.5.2.3 Africa Digital Accessibility Software Market Estimates and Forecasts, By Offering (2020-2032) (USD Million) 

9.5.2.4 Africa Digital Accessibility Software Market Estimates and Forecasts, By Enterprise Size (2020-2032) (USD Million)

9.5.2.5 South Africa

9.5.2.5.1 South Africa Digital Accessibility Software Market Estimates and Forecasts, By Offering (2020-2032) (USD Million)

9.5.2.5.2 South Africa Digital Accessibility Software Market Estimates and Forecasts, By Enterprise Size (2020-2032) (USD Million)

9.5.2.6 Nigeria

9.5.2.6.1 Nigeria Digital Accessibility Software Market Estimates and Forecasts, By Offering (2020-2032) (USD Million)

9.5.2.6.2 Nigeria Digital Accessibility Software Market Estimates and Forecasts, By Enterprise Size (2020-2032) (USD Million)

9.5.2.7 Rest of Africa

9.5.2.7.1 Rest of Africa Digital Accessibility Software Market Estimates and Forecasts, By Offering (2020-2032) (USD Million)

9.5.2.7.2 Rest of Africa Digital Accessibility Software Market Estimates and Forecasts, By Enterprise Size (2020-2032) (USD Million)

9.6 Latin America

9.6.1 Trends Analysis

9.6.2 Latin America Digital Accessibility Software Market Estimates and Forecasts, by Country (2020-2032) (USD Million)

9.6.3 Latin America Digital Accessibility Software Market Estimates and Forecasts, By Offering (2020-2032) (USD Million) 

9.6.4 Latin America Digital Accessibility Software Market Estimates and Forecasts, By Enterprise Size (2020-2032) (USD Million)

9.6.5 Brazil

9.6.5.1 Brazil Digital Accessibility Software Market Estimates and Forecasts, By Offering (2020-2032) (USD Million)

9.6.5.2 Brazil Digital Accessibility Software Market Estimates and Forecasts, By Enterprise Size (2020-2032) (USD Million)

9.6.6 Argentina

9.6.6.1 Argentina Digital Accessibility Software Market Estimates and Forecasts, By Offering (2020-2032) (USD Million)

9.6.6.2 Argentina Digital Accessibility Software Market Estimates and Forecasts, By Enterprise Size (2020-2032) (USD Million)

9.6.7 Colombia

9.6.7.1 Colombia Digital Accessibility Software Market Estimates and Forecasts, By Offering (2020-2032) (USD Million)

9.6.7.2 Colombia Digital Accessibility Software Market Estimates and Forecasts, By Enterprise Size (2020-2032) (USD Million)

9.6.8 Rest of Latin America

9.6.8.1 Rest of Latin America Digital Accessibility Software Market Estimates and Forecasts, By Offering (2020-2032) (USD Million)

9.6.8.2 Rest of Latin America Digital Accessibility Software Market Estimates and Forecasts, By Enterprise Size (2020-2032) (USD Million)

10. Company Profiles

10.1 accessiBe Inc.

10.1.1 Company Overview

10.1.2 Financial

10.1.3 Products/ Services Offered

10.1.4 SWOT Analysis

10.2 AccessibilityChecker.org INC

10.2.1 Company Overview

10.2.2 Financial

10.2.3 Products/ Services Offered

10.2.4 SWOT Analysis

10.3 AudioEye, Inc.

10.3.1 Company Overview

10.3.2 Financial

10.3.3 Products/ Services Offered

10.3.4 SWOT Analysis

10.4 Axess Lab

10.4.1 Company Overview

10.4.2 Financial

10.4.3 Products/ Services Offered

10.4.4 SWOT Analysis

10.5 Deque Systems, Inc.

10.5.1 Company Overview

10.5.2 Financial

10.5.3 Products/ Services Offered

10.5.4 SWOT Analysis

10.6 Evinced Inc.

10.6.1 Company Overview

10.6.2 Financial

10.6.3 Products/ Services Offered

10.6.4 SWOT Analysis

10.7 Level Access

10.7.1 Company Overview

10.7.2 Financial

10.7.3 Products/ Services Offered

10.7.4 SWOT Analysis

10.8 Silktide Ltd

10.8.1 Company Overview

10.8.2 Financial

10.8.3 Products/ Services Offered

10.8.4 SWOT Analysis

10.9 Siteimprove

10.9.1 Company Overview

10.9.2 Financial

10.9.3 Products/ Services Offered

10.9.4 SWOT Analysis

10.10 UsableNet Inc.

10.10.1 Company Overview

10.10.2 Financial

10.10.3 Products/ Services Offered

10.10.4 SWOT Analysis

11. Use Cases and Best Practices

12. Conclusion

An accurate research report requires proper strategizing as well as implementation. There are multiple factors involved in the completion of good and accurate research report and selecting the best methodology to compete the research is the toughest part. Since the research reports we provide play a crucial role in any company’s decision-making process, therefore we at SNS Insider always believe that we should choose the best method which gives us results closer to reality. This allows us to reach at a stage wherein we can provide our clients best and accurate investment to output ratio.

Each report that we prepare takes a timeframe of 350-400 business hours for production. Starting from the selection of titles through a couple of in-depth brain storming session to the final QC process before uploading our titles on our website we dedicate around 350 working hours. The titles are selected based on their current market cap and the foreseen CAGR and growth.


The 5 steps process:

Step 1: Secondary Research:

Secondary Research or Desk Research is as the name suggests is a research process wherein, we collect data through the readily available information. In this process we use various paid and unpaid databases which our team has access to and gather data through the same. This includes examining of listed companies’ annual reports, Journals, SEC filling etc. Apart from this our team has access to various associations across the globe across different industries. Lastly, we have exchange relationships with various university as well as individual libraries.

Secondary Research

Step 2: Primary Research

When we talk about primary research, it is a type of study in which the researchers collect relevant data samples directly, rather than relying on previously collected data.  This type of research is focused on gaining content specific facts that can be sued to solve specific problems. Since the collected data is fresh and first hand therefore it makes the study more accurate and genuine.

We at SNS Insider have divided Primary Research into 2 parts.

Part 1 wherein we interview the KOLs of major players as well as the upcoming ones across various geographic regions. This allows us to have their view over the market scenario and acts as an important tool to come closer to the accurate market numbers. As many as 45 paid and unpaid primary interviews are taken from both the demand and supply side of the industry to make sure we land at an accurate judgement and analysis of the market.

This step involves the triangulation of data wherein our team analyses the interview transcripts, online survey responses and observation of on filed participants. The below mentioned chart should give a better understanding of the part 1 of the primary interview.

Primary Research

Part 2: In this part of primary research the data collected via secondary research and the part 1 of the primary research is validated with the interviews from individual consultants and subject matter experts.

Consultants are those set of people who have at least 12 years of experience and expertise within the industry whereas Subject Matter Experts are those with at least 15 years of experience behind their back within the same space. The data with the help of two main processes i.e., FGDs (Focused Group Discussions) and IDs (Individual Discussions). This gives us a 3rd party nonbiased primary view of the market scenario making it a more dependable one while collation of the data pointers.

Step 3: Data Bank Validation

Once all the information is collected via primary and secondary sources, we run that information for data validation. At our intelligence centre our research heads track a lot of information related to the market which includes the quarterly reports, the daily stock prices, and other relevant information. Our data bank server gets updated every fortnight and that is how the information which we collected using our primary and secondary information is revalidated in real time.

Data Bank Validation

Step 4: QA/QC Process

After all the data collection and validation our team does a final level of quality check and quality assurance to get rid of any unwanted or undesired mistakes. This might include but not limited to getting rid of the any typos, duplication of numbers or missing of any important information. The people involved in this process include technical content writers, research heads and graphics people. Once this process is completed the title gets uploader on our platform for our clients to read it.

Step 5: Final QC/QA Process:

This is the last process and comes when the client has ordered the study. In this process a final QA/QC is done before the study is emailed to the client. Since we believe in giving our clients a good experience of our research studies, therefore, to make sure that we do not lack at our end in any way humanly possible we do a final round of quality check and then dispatch the study to the client.

Key Segments:

By Offering

    • Website Accessibility Software

    • Color Contrast Checker Software

By Enterprise Size

    • SMEs

    • Large Enterprises

Request for Segment Customization as per your Business Requirement: Segment Customization Request

Regional Coverage:

North America

  • US

  • Canada

  • Mexico

Europe

  • Eastern Europe

    • Poland

    • Romania

    • Hungary

    • Turkey

    • Rest of Eastern Europe

  • Western Europe

    • Germany

    • France

    • UK

    • Italy

    • Spain

    • Netherlands

    • Switzerland

    • Austria

    • Rest of Western Europe

Asia Pacific

  • China

  • India

  • Japan

  • South Korea

  • Vietnam

  • Singapore

  • Australia

  • Rest of Asia Pacific

Middle East & Africa

  • Middle East

    • UAE

    • Egypt

    • Saudi Arabia

    • Qatar

    • Rest of Middle East

  • Africa

    • Nigeria

    • South Africa

    • Rest of Africa

Latin America

  • Brazil

  • Argentina

  • Colombia

  • Rest of Latin America

Request for Country Level Research Report: Country Level Customization Request

Available Customization

With the given market data, SNS Insider offers customization as per the company’s specific needs. The following customization options are available for the report:

  • Detailed Volume Analysis

  • Criss-Cross segment analysis (e.g. Product X Application)

  • Competitive Product Benchmarking

  • Geographic Analysis

  • Additional countries in any of the regions

  • Customized Data Representation

  • Detailed analysis and profiling of additional market players


  •            5000 (33% Discount)


  •            8950 (40% Discount)


  •            3050 (23% Discount)

Start a Conversation

Hi! Click one of our member below to chat on Phone