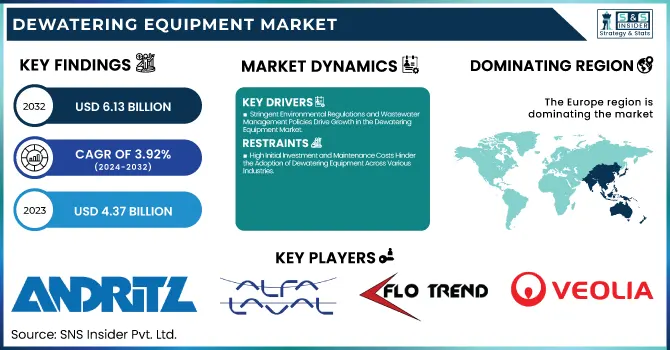
The Dewatering Equipment Market Size was valued at USD 4.37 Billion in 2023 and is expected to reach USD 6.13 Billion by 2032 and grow at a CAGR of 3.92% over the forecast period 2024-2032.
To Get more information on Dewatering Equipment Market - Request Free Sample Report
The Dewatering Equipment Market is witnessing tremendous growth owing to increased industrialization, environmental regulations, and growing wastewater treatment demands. Municipal wastewater, food processing, pharmaceuticals, and mining are some of the major industries responsible for market growth. Advances in technology for centrifuges, belt presses, and filter presses are improving efficiency and sustainability in operation. Sludge management and water conservation concerns also drive demand. With increasing investments and innovations, the dewatering equipment market is set to witness high growth, creating profitable opportunities for manufacturers and service providers worldwide.
The U.S. dewatering equipment market was valued at USD 0.43 billion in 2023 and is projected to reach USD 0.53 billion by 2032, growing at a CAGR of 2.29% from 2024 to 2032. The U.S. dewatering equipment market is driven by stringent environmental regulations, increasing wastewater treatment needs, and growing industrial activities. Municipalities and industries such as food processing, pharmaceuticals, and mining are investing in advanced dewatering technologies like centrifuges, belt presses, and filter presses to improve efficiency and compliance with EPA standards. The rising focus on sustainable water management and sludge disposal is further fueling market demand.
Key Drivers:
Stringent Environmental Regulations and Wastewater Management Policies Drive Growth in the Dewatering Equipment Market
The growing regulatory enforcement of environmental laws by agencies like the EPA (Environmental Protection Agency) is one of the major drivers for the U.S. dewatering equipment market. The industries are subject to stringent wastewater disposal regulations, resulting in increased use of effective dewatering technologies like centrifuges, belt presses, and filter presses. The increasing focus on sustainable water treatment and sludge treatment in applications such as municipal wastewater treatment, food processing, and pharmaceuticals is also stimulating demand further. With industries looking for cost-saving and environmentally friendly dewatering solutions, innovation in technology and automation in the management of sludge is also driving market growth further.
Restraints
High Initial Investment and Maintenance Costs Hinder the Adoption of Dewatering Equipment Across Various Industries
Despite increasing demand, the huge initial capital outlay for dewatering equipment becomes a major bottleneck, especially for small and medium-sized industries. The expense of sophisticated centrifuges, vacuum filters, and belt presses is astronomical, and the companies find it hard to switch to new systems. Also, maintenance costs and the requirement of skilled operators escalate the cost of ownership. These budgetary restrictions restrict mass adoption, particularly in the developing world. Companies tend to look for low-cost substitutes, like outsourcing wastewater treatment services, which can affect the overall growth of the dewatering equipment market.
Opportunities
Rising Adoption of Smart and Automated Dewatering Technologies Creates Growth Opportunities in the U.S. Market
The convergence of IoT, AI, and automation in dewatering gear has a large growth potential. Smart monitoring systems and predictive maintenance solutions enhance efficiency, decrease operation downtime, and increase sludge processing precision. Such innovations allow industries to make energy consumption optimal and cut down on manual intervention, making dewatering operations cost-efficient. Increased attention from the U.S. government towards upgrading wastewater treatment facilities is also prompting industries to spend on next-gen dewatering solutions. With industries focusing on sustainability and resource optimization, the implementation of automated dewatering technologies is likely to gain momentum, creating new opportunities for manufacturers and service providers in the industry.
Challenges
Fluctuating Raw Material Prices and Supply Chain Disruptions Impact Dewatering Equipment Manufacturing and Market Stability
The fluctuating raw material prices of stainless steel, aluminum, and polymers utilized in the production of dewatering equipment are a challenge to market expansion. Disruptions in supply chains due to international trade barriers, transportation congestion, and geopolitical tensions also affect production costs and delivery timelines. Manufacturers struggle to maintain competitive prices while maintaining product quality and availability. Also, the reliance on imported parts heightens exposure to exchange rate fluctuations and tariff adjustments. To counteract these, businesses are concentrating on localizing supply chains and creating substitute materials to bring stability to dewatering equipment manufacturing and supply.
By Type
The sludge segment led the Dewatering Equipment Market in 2023 on account of growing wastewater treatment demands in industrial and municipal industries. Increasing sludge disposal regulations have driven demand for effective dewatering technologies. Alfa Laval and Andritz Group are some of the players that have introduced advanced filter presses and centrifuges for effective sludge management. Alfa Laval, for example, recently launched a next-generation decanter centrifuge with enhanced energy efficiency for wastewater treatment facilities. Likewise, Huber Technology broadened its sludge dewatering options to maximize water recovery. Increasing demand for green sludge treatment continues to push innovations and investment in dewatering equipment globally.
The application segment is anticipated to have the highest CAGR during the forecast period, driven by growing industrial and municipal wastewater treatment projects. The use of advanced dewatering solutions is growing across industries like mining, food processing, and pharmaceuticals. Players like Evoqua Water Technologies have introduced high-efficiency filter presses and belt presses, serving industrial applications.
Further, Veolia Water Technologies launched modular dewatering systems for personalized wastewater treatment needs. The requirement for automation and IoT-enabled equipment in wastewater treatment is also driving market growth, with industries looking to save on sludge disposal and enhance water reuse efficiency.
By Technology
The centrifuges segment led the dewatering equipment market in 2023 owing to its efficiency in sludge separation, lower cost of operations, and lesser manual intervention. Centrifuge systems are well-established in municipal wastewater treatment, industrial processing, and oil & gas sectors for their excellent dewatering capability. Alfa Laval, Andritz, and GEA Group have led the technological curve by introducing high-speed, energy-efficient centrifuge models with better automation.
For example, Alfa Laval launched the ALDEC G3 VecFlow, a machine meant to cut power consumption by as much as 30%. Increasing needs for advanced dewatering technologies in wastewater treatment plants continue to support this segment's revenue leadership.
The belt presses segment is projected to register the highest CAGR over the forecast period with growing applications in industrial and municipal wastewater treatment. Belt presses are favored for lower energy use, being cost-effective, and continuous operation as compared to centrifuges. Major players like Huber Technology, Evoqua Water Technologies, and Komline-Sanderson have been introducing advanced models with improved automation and minimized water usage. Evoqua's Envirex Belt Press, which is the latest offering, provides increased throughput with enhanced sludge conditioning. Growing focus on energy-efficient and sustainable dewatering technologies and expanding investments in wastewater treatment infrastructure are fueling quick growth in this market.
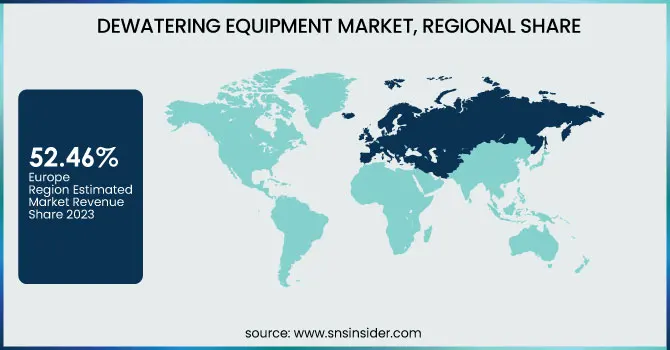
Europe led the dewatering equipment market in 2023 with 52.46% of total revenue, fueled by stringent environmental regulations, sophisticated wastewater treatment infrastructure, and high industrial uptake. The European Union's Urban Wastewater Treatment Directive has enforced rigorous sludge management and water conservation practices, boosting demand for high-efficiency dewatering solutions. Top players like Veolia Water Technologies, Huber SE, and Andritz Group are heavily investing in innovation. Andritz entered the market with its new decanter centrifuge series featuring more energy efficiency and higher sludge handling capacity, and Huber SE entered with new belt filter presses equipped with automatic control systems.
The Asia Pacific dewatering equipment market is expected to register the highest CAGR of 6.67% in the forecast period owing to rapid urbanization, growing industrialization, and expanding investments in wastewater treatment plants. China, India, and Japan are enforcing stricter policies for wastewater management, fueling demand for high-end dewatering technologies. Other companies such as Evoqua Water Technologies, Alfa Laval, and Mitsubishi Kakoki Kaisha are increasing their footprint in the region. Alfa Laval has introduced high-performance decanter centrifuges engineered to meet the specific needs of Asian municipal and industrial applications.
Get Customized Report as per Your Business Requirement - Enquiry Now
Key Players
ANDRITZ - (Decanter Centrifuges, Belt Filter Presses)
ALFA LAVAL - (ALDEC G3 Decanter Centrifuge, Solid Bowl Decanter Centrifuge)
Flo Trend - (Rotary Drum Vacuum Filters, Belt Filter Presses)
Veolia - (Actiflo® Clarification System, Centrifuge dewatering equipment)
Fournier Industries - (Fournier Rotary Press, Fournier Vacuum Disc Filters)
Griffin Dewatering Corporation - (Hydraulic Dewatering Equipment, Portable Dewatering Pumps)
ThyssenKrupp - (Dewatering Screens, Belt Filter Presses)
NLMK - (Sludge Dewatering Systems, Vacuum Filters)
Aqseptence Group - (Belt Filter Presses, Vacuum Filters)
Hitachi Zosen Corporation - (Horizontal Belt Filter Press, Decanter Centrifuges)
KONTEK - (Belt Filter Press, Horizontal Vacuum Belt Filters)
ENCON Evaporators - (Evaporator Dewatering System, Rotary Evaporators)
Recent Trends
October 2023 - ALFA LAVAL Launched advanced sludge dewatering technologies with reduced energy consumption, including an advanced range of centrifugal dewatering systems.
December 2023 - ANDRITZ launched its Andritz Separation AD-LEAP decanter centrifuge, focusing on automation and improving dewatering performance for various industries.
| Report Attributes | Details |
|---|---|
| Market Size in 2023 | US$ 4.37 Billion |
| Market Size by 2032 | US$ 6.13 Billion |
| CAGR | CAGR of 3.92% From 2024 to 2032 |
| Base Year | 2023 |
| Forecast Period | 2024-2032 |
| Historical Data | 2020-2022 |
| Report Scope & Coverage | Market Size, Segments Analysis, Competitive Landscape, Regional Analysis, DROC & SWOT Analysis, Forecast Outlook |
| Key Segments | • By Type - (Sludge, Application, Industrial, Municipal) • By Technology - (Centrifuges, Belt Presses, Filter Presses, Vacuum Filters, Drying Beds, Sludge Lagoons) |
| Regional Analysis/Coverage | North America (US, Canada, Mexico), Europe (Eastern Europe [Poland, Romania, Hungary, Turkey, Rest of Eastern Europe] Western Europe] Germany, France, UK, Italy, Spain, Netherlands, Switzerland, Austria, Rest of Western Europe]), Asia Pacific (China, India, Japan, South Korea, Vietnam, Singapore, Australia, Rest of Asia Pacific), Middle East & Africa (Middle East [UAE, Egypt, Saudi Arabia, Qatar, Rest of Middle East], Africa [Nigeria, South Africa, Rest of Africa], Latin America (Brazil, Argentina, Colombia, Rest of Latin America) |
| Company Profiles | ANDRITZ, ALFA LAVAL, Flo Trend, Veolia, Fournier Industries, Griffin Dewatering Corporation, ThyssenKrupp, NLMK, Aqseptence Group, Hitachi Zosen Corporation, KONTEK, ENCON Evaporators. |
Ans: The Dewatering Equipment Market is expected to grow at a CAGR of 3.92% during 2024-2032.
Ans: The Dewatering Equipment Market size was USD 4.37 billion in 2023 and is expected to Reach USD 6.13 billion by 2032.
Ans: The major growth factor of the Dewatering Equipment Market is the increasing demand for efficient wastewater treatment and sludge management solutions across various industries.
Ans: The Centrifuges segment dominated the Dewatering Equipment Market.
Ans: Europe dominated the Dewatering Equipment Market in 2023.
Table of Contents:
1. Introduction
1.1 Market Definition
1.2 Scope (Inclusion and Exclusions)
1.3 Research Assumptions
2. Executive Summary
2.1 Market Overview
2.2 Regional Synopsis
2.3 Competitive Summary
3. Research Methodology
3.1 Top-Down Approach
3.2 Bottom-up Approach
3.3. Data Validation
3.4 Primary Interviews
4. Market Dynamics Impact Analysis
4.1 Market Driving Factors Analysis
4.1.2 Drivers
4.1.2 Restraints
4.1.3 Opportunities
4.1.4 Challenges
4.2 PESTLE Analysis
4.3 Porter’s Five Forces Model
5. Statistical Insights and Trends Reporting
5.1 Operational Efficiency and Equipment Performance Metrics
5.2 Cost Structure Analysis
5.3 Supply Chain and Distribution Analysis
5.4 Growth Potential Indicators
6. Competitive Landscape
6.1 List of Major Companies, By Region
6.2 Market Share Analysis, By Region
6.3 Product Benchmarking
6.3.1 Product specifications and features
6.3.2 Pricing
6.4 Strategic Initiatives
6.4.1 Marketing and promotional activities
6.4.2 Distribution and supply chain strategies
6.4.3 Expansion plans and new product launches
6.4.4 Strategic partnerships and collaborations
6.5 Technological Advancements
6.6 Market Positioning and Branding
7. Dewatering Equipment Market Segmentation, By Type
7.1 Chapter Overview
7.2 Sludge
7.2.1 Sludge Market Trends Analysis (2020-2032)
7.2.2 Sludge Market Size Estimates and Forecasts to 2032 (USD Billion)
7.3 Application
7.3.1 Application Market Trends Analysis (2020-2032)
7.3.2 Application Market Size Estimates and Forecasts to 2032 (USD Billion)
7.4 Industrial
7.4.1 Industrial Market Trends Analysis (2020-2032)
7.4.2 Industrial Market Size Estimates and Forecasts to 2032 (USD Billion)
7.5 Municipal
7.5.1 Municipal Market Trends Analysis (2020-2032)
7.5.2 Municipal Market Size Estimates and Forecasts to 2032 (USD Billion)
8. Dewatering Equipment Market Segmentation, By Technology
8.1 Chapter Overview
8.2 Centrifuges
8.2.1 Centrifuges Market Trends Analysis (2020-2032)
8.2.2 Centrifuges Market Size Estimates and Forecasts to 2032 (USD Billion)
8.3 Belt Presses
8.3.1 Belt Presses Market Trends Analysis (2020-2032)
8.3.2 Belt Presses Market Size Estimates and Forecasts to 2032 (USD Billion)
8.4 Filter Presses
8.4.1 Filter Presses Market Trends Analysis (2020-2032)
8.4.2 Filter Presses Documents Market Size Estimates and Forecasts to 2032 (USD Billion)
8.5 Vacuum Filters
8.5.1 Vacuum Filters Market Trends Analysis (2020-2032)
8.5.2 Vacuum Filters Market Size Estimates and Forecasts to 2032 (USD Billion)
8.6 Drying Beds
8.6.1 Drying Beds Market Trends Analysis (2020-2032)
8.6.2 Drying Beds Market Size Estimates and Forecasts to 2032 (USD Billion)
8.7 Sludge Lagoons
8.7.1 Sludge Lagoons Market Trends Analysis (2020-2032)
8.5.2 Sludge Lagoons Market Size Estimates and Forecasts to 2032 (USD Billion)
9. Regional Analysis
9.1 Chapter Overview
9.2 North America
9.2.1 Trends Analysis
9.2.2 North America Dewatering Equipment Market Estimates and Forecasts, by Country (2020-2032) (USD Billion)
9.2.3 North America Dewatering Equipment Market Estimates and Forecasts, By Type (2020-2032) (USD Billion)
9.2.4 North America Dewatering Equipment Market Estimates and Forecasts, By Technology (2020-2032) (USD Billion)
9.2.5 USA
9.2.5.1 USA Dewatering Equipment Market Estimates and Forecasts, By Type (2020-2032) (USD Billion)
9.2.5.2 USA Dewatering Equipment Market Estimates and Forecasts, By Technology (2020-2032) (USD Billion)
9.2.6 Canada
9.2.6.1 Canada Dewatering Equipment Market Estimates and Forecasts, By Type (2020-2032) (USD Billion)
9.2.6.2 Canada Dewatering Equipment Market Estimates and Forecasts, By Technology (2020-2032) (USD Billion)
9.2.7 Mexico
9.2.7.1 Mexico Dewatering Equipment Market Estimates and Forecasts, By Type (2020-2032) (USD Billion)
9.2.7.2 Mexico Dewatering Equipment Market Estimates and Forecasts, By Technology (2020-2032) (USD Billion)
9.3 Europe
9.3.1 Eastern Europe
9.3.1.1 Trends Analysis
9.3.1.2 Eastern Europe Dewatering Equipment Market Estimates and Forecasts, by Country (2020-2032) (USD Billion)
9.3.1.3 Eastern Europe Dewatering Equipment Market Estimates and Forecasts, By Type (2020-2032) (USD Billion)
9.3.1.4 Eastern Europe Dewatering Equipment Market Estimates and Forecasts, By Technology (2020-2032) (USD Billion)
9.3.1.5 Poland
9.3.1.5.1 Poland Dewatering Equipment Market Estimates and Forecasts, By Type (2020-2032) (USD Billion)
9.3.1.5.2 Poland Dewatering Equipment Market Estimates and Forecasts, By Technology (2020-2032) (USD Billion)
9.3.1.6 Romania
9.3.1.6.1 Romania Dewatering Equipment Market Estimates and Forecasts, By Type (2020-2032) (USD Billion)
9.3.1.6.2 Romania Dewatering Equipment Market Estimates and Forecasts, By Technology (2020-2032) (USD Billion)
9.3.1.7 Hungary
9.3.1.7.1 Hungary Dewatering Equipment Market Estimates and Forecasts, By Type (2020-2032) (USD Billion)
9.3.1.7.2 Hungary Dewatering Equipment Market Estimates and Forecasts, By Technology (2020-2032) (USD Billion)
9.3.1.8 Turkey
9.3.1.8.1 Turkey Dewatering Equipment Market Estimates and Forecasts, By Type (2020-2032) (USD Billion)
9.3.1.8.2 Turkey Dewatering Equipment Market Estimates and Forecasts, By Technology (2020-2032) (USD Billion)
9.3.1.9 Rest of Eastern Europe
9.3.1.9.1 Rest of Eastern Europe Dewatering Equipment Market Estimates and Forecasts, By Type (2020-2032) (USD Billion)
9.3.1.9.2 Rest of Eastern Europe Dewatering Equipment Market Estimates and Forecasts, By Technology (2020-2032) (USD Billion)
9.3.2 Western Europe
9.3.2.1 Trends Analysis
9.3.2.2 Western Europe Dewatering Equipment Market Estimates and Forecasts, by Country (2020-2032) (USD Billion)
9.3.2.3 Western Europe Dewatering Equipment Market Estimates and Forecasts, By Type (2020-2032) (USD Billion)
9.3.2.4 Western Europe Dewatering Equipment Market Estimates and Forecasts, By Technology (2020-2032) (USD Billion)
9.3.2.5 Germany
9.3.2.5.1 Germany Dewatering Equipment Market Estimates and Forecasts, By Type (2020-2032) (USD Billion)
9.3.2.5.2 Germany Dewatering Equipment Market Estimates and Forecasts, By Technology (2020-2032) (USD Billion)
9.3.2.6 France
9.3.2.6.1 France Dewatering Equipment Market Estimates and Forecasts, By Type (2020-2032) (USD Billion)
9.3.2.6.2 France Dewatering Equipment Market Estimates and Forecasts, By Technology (2020-2032) (USD Billion)
9.3.2.7 UK
9.3.2.7.1 UK Dewatering Equipment Market Estimates and Forecasts, By Type (2020-2032) (USD Billion)
9.3.2.7.2 UK Dewatering Equipment Market Estimates and Forecasts, By Technology (2020-2032) (USD Billion)
9.3.2.8 Italy
9.3.2.8.1 Italy Dewatering Equipment Market Estimates and Forecasts, By Type (2020-2032) (USD Billion)
9.3.2.8.2 Italy Dewatering Equipment Market Estimates and Forecasts, By Technology (2020-2032) (USD Billion)
9.3.2.9 Spain
9.3.2.9.1 Spain Dewatering Equipment Market Estimates and Forecasts, By Type (2020-2032) (USD Billion)
9.3.2.9.2 Spain Dewatering Equipment Market Estimates and Forecasts, By Technology (2020-2032) (USD Billion)
9.3.2.10 Netherlands
9.3.2.10.1 Netherlands Dewatering Equipment Market Estimates and Forecasts, By Type (2020-2032) (USD Billion)
9.3.2.10.2 Netherlands Dewatering Equipment Market Estimates and Forecasts, By Technology (2020-2032) (USD Billion)
9.3.2.11 Switzerland
9.3.2.11.1 Switzerland Dewatering Equipment Market Estimates and Forecasts, By Type (2020-2032) (USD Billion)
9.3.2.11.2 Switzerland Dewatering Equipment Market Estimates and Forecasts, By Technology (2020-2032) (USD Billion)
9.3.2.12 Austria
9.3.2.12.1 Austria Dewatering Equipment Market Estimates and Forecasts, By Type (2020-2032) (USD Billion)
9.3.2.12.2 Austria Dewatering Equipment Market Estimates and Forecasts, By Technology (2020-2032) (USD Billion)
9.3.2.13 Rest of Western Europe
9.3.2.13.1 Rest of Western Europe Dewatering Equipment Market Estimates and Forecasts, By Type (2020-2032) (USD Billion)
9.3.2.13.2 Rest of Western Europe Dewatering Equipment Market Estimates and Forecasts, By Technology (2020-2032) (USD Billion)
9.4 Asia Pacific
9.4.1 Trends Analysis
9.4.2 Asia Pacific Dewatering Equipment Market Estimates and Forecasts, by Country (2020-2032) (USD Billion)
9.4.3 Asia Pacific Dewatering Equipment Market Estimates and Forecasts, By Type (2020-2032) (USD Billion)
9.4.4 Asia Pacific Dewatering Equipment Market Estimates and Forecasts, By Technology (2020-2032) (USD Billion)
9.4.5 China
9.4.5.1 China Dewatering Equipment Market Estimates and Forecasts, By Type (2020-2032) (USD Billion)
9.4.5.2 China Dewatering Equipment Market Estimates and Forecasts, By Technology (2020-2032) (USD Billion)
9.4.6 India
9.4.5.1 India Dewatering Equipment Market Estimates and Forecasts, By Type (2020-2032) (USD Billion)
9.4.5.2 India Dewatering Equipment Market Estimates and Forecasts, By Technology (2020-2032) (USD Billion)
9.4.5 Japan
9.4.5.1 Japan Dewatering Equipment Market Estimates and Forecasts, By Type (2020-2032) (USD Billion)
9.4.5.2 Japan Dewatering Equipment Market Estimates and Forecasts, By Technology (2020-2032) (USD Billion)
9.4.6 South Korea
9.4.6.1 South Korea Dewatering Equipment Market Estimates and Forecasts, By Type (2020-2032) (USD Billion)
9.4.6.2 South Korea Dewatering Equipment Market Estimates and Forecasts, By Technology (2020-2032) (USD Billion)
9.4.7 Vietnam
9.4.7.1 Vietnam Dewatering Equipment Market Estimates and Forecasts, By Type (2020-2032) (USD Billion)
9.2.7.2 Vietnam Dewatering Equipment Market Estimates and Forecasts, By Technology (2020-2032) (USD Billion)
9.4.8 Singapore
9.4.8.1 Singapore Dewatering Equipment Market Estimates and Forecasts, By Type (2020-2032) (USD Billion)
9.4.8.2 Singapore Dewatering Equipment Market Estimates and Forecasts, By Technology (2020-2032) (USD Billion)
9.4.9 Australia
9.4.9.1 Australia Dewatering Equipment Market Estimates and Forecasts, By Type (2020-2032) (USD Billion)
9.4.9.2 Australia Dewatering Equipment Market Estimates and Forecasts, By Technology (2020-2032) (USD Billion)
9.4.10 Rest of Asia Pacific
9.4.10.1 Rest of Asia Pacific Dewatering Equipment Market Estimates and Forecasts, By Type (2020-2032) (USD Billion)
9.4.10.2 Rest of Asia Pacific Dewatering Equipment Market Estimates and Forecasts, By Technology (2020-2032) (USD Billion)
9.5 Middle East and Africa
9.5.1 Middle East
9.5.1.1 Trends Analysis
9.5.1.2 Middle East Dewatering Equipment Market Estimates and Forecasts, by Country (2020-2032) (USD Billion)
9.5.1.3 Middle East Dewatering Equipment Market Estimates and Forecasts, By Type (2020-2032) (USD Billion)
9.5.1.4 Middle East Dewatering Equipment Market Estimates and Forecasts, By Technology (2020-2032) (USD Billion)
9.5.1.5 UAE
9.5.1.5.1 UAE Dewatering Equipment Market Estimates and Forecasts, By Type (2020-2032) (USD Billion)
9.5.1.5.2 UAE Dewatering Equipment Market Estimates and Forecasts, By Technology (2020-2032) (USD Billion)
9.5.1.6 Egypt
9.5.1.6.1 Egypt Dewatering Equipment Market Estimates and Forecasts, By Type (2020-2032) (USD Billion)
9.5.1.6.2 Egypt Dewatering Equipment Market Estimates and Forecasts, By Technology (2020-2032) (USD Billion)
9.5.1.7 Saudi Arabia
9.5.1.7.1 Saudi Arabia Dewatering Equipment Market Estimates and Forecasts, By Type (2020-2032) (USD Billion)
9.5.1.7.2 Saudi Arabia Dewatering Equipment Market Estimates and Forecasts, By Technology (2020-2032) (USD Billion)
9.5.1.8 Qatar
9.5.1.8.1 Qatar Dewatering Equipment Market Estimates and Forecasts, By Type (2020-2032) (USD Billion)
9.5.1.8.2 Qatar Dewatering Equipment Market Estimates and Forecasts, By Technology (2020-2032) (USD Billion)
9.5.1.9 Rest of Middle East
9.5.1.9.1 Rest of Middle East Dewatering Equipment Market Estimates and Forecasts, By Type (2020-2032) (USD Billion)
9.5.1.9.2 Rest of Middle East Dewatering Equipment Market Estimates and Forecasts, By Technology (2020-2032) (USD Billion)
9.5.2 Africa
9.5.2.1 Trends Analysis
9.5.2.2 Africa Dewatering Equipment Market Estimates and Forecasts, by Country (2020-2032) (USD Billion)
9.5.2.3 Africa Dewatering Equipment Market Estimates and Forecasts, By Type (2020-2032) (USD Billion)
9.5.2.4 Africa Dewatering Equipment Market Estimates and Forecasts, By Technology (2020-2032) (USD Billion)
9.5.2.5 South Africa
9.5.2.5.1 South Africa Dewatering Equipment Market Estimates and Forecasts, By Type (2020-2032) (USD Billion)
9.5.2.5.2 South Africa Dewatering Equipment Market Estimates and Forecasts, By Technology (2020-2032) (USD Billion)
9.5.2.6 Nigeria
9.5.2.6.1 Nigeria Dewatering Equipment Market Estimates and Forecasts, By Type (2020-2032) (USD Billion)
9.5.2.6.2 Nigeria Dewatering Equipment Market Estimates and Forecasts, By Technology (2020-2032) (USD Billion)
9.5.2.7 Rest of Africa
9.5.2.7.1 Rest of Africa Dewatering Equipment Market Estimates and Forecasts, By Type (2020-2032) (USD Billion)
9.5.2.7.2 Rest of Africa Dewatering Equipment Market Estimates and Forecasts, By Technology (2020-2032) (USD Billion)
9.6 Latin America
9.6.1 Trends Analysis
9.6.2 Latin America Dewatering Equipment Market Estimates and Forecasts, by Country (2020-2032) (USD Billion)
9.6.3 Latin America Dewatering Equipment Market Estimates and Forecasts, By Type (2020-2032) (USD Billion)
9.6.4 Latin America Dewatering Equipment Market Estimates and Forecasts, By Technology (2020-2032) (USD Billion)
9.6.5 Brazil
9.6.5.1 Brazil Dewatering Equipment Market Estimates and Forecasts, By Type (2020-2032) (USD Billion)
9.6.5.2 Brazil Dewatering Equipment Market Estimates and Forecasts, By Technology (2020-2032) (USD Billion)
9.6.6 Argentina
9.6.6.1 Argentina Dewatering Equipment Market Estimates and Forecasts, By Type (2020-2032) (USD Billion)
9.6.6.2 Argentina Dewatering Equipment Market Estimates and Forecasts, By Technology (2020-2032) (USD Billion)
9.6.7 Colombia
9.6.7.1 Colombia Dewatering Equipment Market Estimates and Forecasts, By Type (2020-2032) (USD Billion)
9.6.7.2 Colombia Dewatering Equipment Market Estimates and Forecasts, By Technology (2020-2032) (USD Billion)
9.6.8 Rest of Latin America
9.6.8.1 Rest of Latin America Dewatering Equipment Market Estimates and Forecasts, By Type (2020-2032) (USD Billion)
9.6.8.2 Rest of Latin America Dewatering Equipment Market Estimates and Forecasts, By Technology (2020-2032) (USD Billion)
10. Company Profiles
10.1 ANDRITZ
10.1.1 Company Overview
10.1.2 Financial
10.1.3 Products/ Services Offered
110.1.4 SWOT Analysis
10.2 ALFA LAVAL
10.2.1 Company Overview
10.2.2 Financial
10.2.3 Products/ Services Offered
10.2.4 SWOT Analysis
10.3 Flo Trend
10.3.1 Company Overview
10.3.2 Financial
10.3.3 Products/ Services Offered
10.3.4 SWOT Analysis
10.4 Veolia
10.4.1 Company Overview
10.4.2 Financial
10.4.3 Products/ Services Offered
10.4.4 SWOT Analysis
10.5 Fournier Industries
10.5.1 Company Overview
10.5.2 Financial
10.5.3 Products/ Services Offered
10.5.4 SWOT Analysis
10.6 Griffin Dewatering Corporation
10.6.1 Company Overview
10.6.2 Financial
10.6.3 Products/ Services Offered
10.6.4 SWOT Analysis
10.7 ThyssenKrupp
10.7.1 Company Overview
10.7.2 Financial
10.7.3 Products/ Services Offered
10.7.4 SWOT Analysis
10.8 NLMK
10.8.1 Company Overview
10.8.2 Financial
10.8.3 Products/ Services Offered
10.8.4 SWOT Analysis
10.9 Aqseptence Group
10.9.1 Company Overview
10.9.2 Financial
10.9.3 Products/ Services Offered
10.9.4 SWOT Analysis
10.10 Hitachi Zosen Corporation
10.9.1 Company Overview
10.9.2 Financial
10.9.3 Products/ Services Offered
10.9.4 SWOT Analysis
11. Use Cases and Best Practices
12. Conclusion
An accurate research report requires proper strategizing as well as implementation. There are multiple factors involved in the completion of good and accurate research report and selecting the best methodology to compete the research is the toughest part. Since the research reports we provide play a crucial role in any company’s decision-making process, therefore we at SNS Insider always believe that we should choose the best method which gives us results closer to reality. This allows us to reach at a stage wherein we can provide our clients best and accurate investment to output ratio.
Each report that we prepare takes a timeframe of 350-400 business hours for production. Starting from the selection of titles through a couple of in-depth brain storming session to the final QC process before uploading our titles on our website we dedicate around 350 working hours. The titles are selected based on their current market cap and the foreseen CAGR and growth.
The 5 steps process:
Step 1: Secondary Research:
Secondary Research or Desk Research is as the name suggests is a research process wherein, we collect data through the readily available information. In this process we use various paid and unpaid databases which our team has access to and gather data through the same. This includes examining of listed companies’ annual reports, Journals, SEC filling etc. Apart from this our team has access to various associations across the globe across different industries. Lastly, we have exchange relationships with various university as well as individual libraries.

Step 2: Primary Research
When we talk about primary research, it is a type of study in which the researchers collect relevant data samples directly, rather than relying on previously collected data. This type of research is focused on gaining content specific facts that can be sued to solve specific problems. Since the collected data is fresh and first hand therefore it makes the study more accurate and genuine.
We at SNS Insider have divided Primary Research into 2 parts.
Part 1 wherein we interview the KOLs of major players as well as the upcoming ones across various geographic regions. This allows us to have their view over the market scenario and acts as an important tool to come closer to the accurate market numbers. As many as 45 paid and unpaid primary interviews are taken from both the demand and supply side of the industry to make sure we land at an accurate judgement and analysis of the market.
This step involves the triangulation of data wherein our team analyses the interview transcripts, online survey responses and observation of on filed participants. The below mentioned chart should give a better understanding of the part 1 of the primary interview.

Part 2: In this part of primary research the data collected via secondary research and the part 1 of the primary research is validated with the interviews from individual consultants and subject matter experts.
Consultants are those set of people who have at least 12 years of experience and expertise within the industry whereas Subject Matter Experts are those with at least 15 years of experience behind their back within the same space. The data with the help of two main processes i.e., FGDs (Focused Group Discussions) and IDs (Individual Discussions). This gives us a 3rd party nonbiased primary view of the market scenario making it a more dependable one while collation of the data pointers.
Step 3: Data Bank Validation
Once all the information is collected via primary and secondary sources, we run that information for data validation. At our intelligence centre our research heads track a lot of information related to the market which includes the quarterly reports, the daily stock prices, and other relevant information. Our data bank server gets updated every fortnight and that is how the information which we collected using our primary and secondary information is revalidated in real time.

Step 4: QA/QC Process
After all the data collection and validation our team does a final level of quality check and quality assurance to get rid of any unwanted or undesired mistakes. This might include but not limited to getting rid of the any typos, duplication of numbers or missing of any important information. The people involved in this process include technical content writers, research heads and graphics people. Once this process is completed the title gets uploader on our platform for our clients to read it.
Step 5: Final QC/QA Process:
This is the last process and comes when the client has ordered the study. In this process a final QA/QC is done before the study is emailed to the client. Since we believe in giving our clients a good experience of our research studies, therefore, to make sure that we do not lack at our end in any way humanly possible we do a final round of quality check and then dispatch the study to the client.
Key Segments:
By Type
Sludge
Application
Industrial
Municipal
By Technology
Centrifuges
Belt Presses
Filter Presses
Vacuum Filters
Drying Beds
Sludge Lagoons
Request for Segment Customization as per your Business Requirement: Segment Customization Request
Regional Coverage:
North America
US
Canada
Mexico
Europe
Eastern Europe
Poland
Romania
Hungary
Turkey
Rest of Eastern Europe
Western Europe
Germany
France
UK
Italy
Spain
Netherlands
Switzerland
Austria
Rest of Western Europe
Asia Pacific
China
India
Japan
South Korea
Vietnam
Singapore
Australia
Rest of Asia Pacific
Middle East & Africa
Middle East
UAE
Egypt
Saudi Arabia
Qatar
Rest of Middle East
Africa
Nigeria
South Africa
Rest of Africa
Latin America
Brazil
Argentina
Colombia
Rest of Latin America
Request for Country Level Research Report: Country Level Customization Request
Available Customization
With the given market data, SNS Insider offers customization as per the company’s specific needs. The following customization options are available for the report:
Detailed Volume Analysis
Criss-Cross segment analysis (e.g. Product X Application)
Competitive Product Benchmarking
Geographic Analysis
Additional countries in any of the regions
Customized Data Representation
Detailed analysis and profiling of additional market players
The Coherent Optical Equipment Market Size was esteemed at USD 24.67 billion in 2022 and is supposed to arrive at USD 52.12 billion by 2030 and develop at a CAGR of 9.8% over the forecast period 2023-2030.
The Thermal Spray Coating Equipment and Services Market Size was valued at USD 12.77 Billion in 2023 and is expected to reach USD 18.88 Billion by 2032 and grow at a CAGR of 4.50% over the forecast period 2024-2032.
The Hydraulic Equipment Market Size was valued at USD 49.34 Billion in 2023 and is now anticipated to grow to USD 114.4 Billion by 2032, displaying a compound annual growth rate (CAGR) of 9.8% during the forecast Period 2024-2032.
The Construction Equipment Market Size was estimated at USD 179.37 billion in 2023 and is expected to arrive at USD 345.08 billion by 2032 with a growing CAGR of 7.54% over the forecast period 2024-2032.
The Robotic Lawn Mower Market size was estimated at USD 7.76 billion in 2023 and is expected to reach USD 19.53 billion by 2032 at a CAGR of 10.8% during the forecast period of 2024-2032.
The Ozone Generator Market size was valued at USD 1.26 Billion in 2023 and is expected to grow at USD 2.27 Billion By 2032 with a growing CAGR of 6.8% over the forecast period of 2024-2032.

Hi! Click one of our member below to chat on Phone
© 2025 All Rights Reserved by SNS Insider Pvt Ltd


