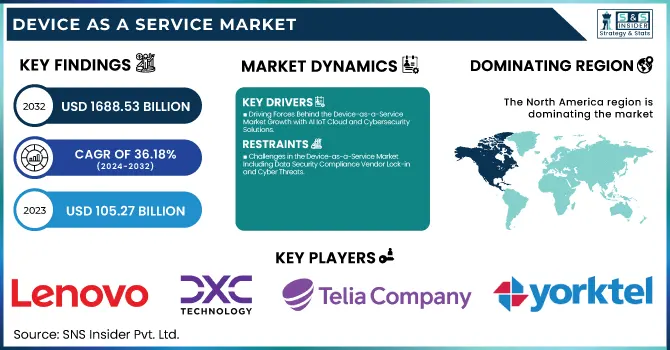
The Device as a Service Market Size was valued at USD 105.27 billion in 2023 and is expected to reach USD 1688.53 billion by 2032, growing at a CAGR of 36.18% over the forecast period 2024-2032. The expanding Device-as-a-Service (DaaS) market, supported by increasing adoption from enterprises looking for affordable, scalable IT solutions DaaS is helping businesses to outsource the entire device procurement, maintenance, and upgrade to the vendor relieving IT of the hassle and helping in operational efficiency. Advanced remote monitoring and predictive maintenance reduce downtime and improve performance with automated updates.
To Get more information on Device as a Service Market - Request Free Sample Report
AI-powered analytics, cloud-based management, and security features are all built into the device to enable maximum utilization of the devices. DaaS helps enhance workforce productivity as well by providing employees with updated hardware and software, optimizing collaboration between teams, and improving mobility in hybrid and remote work environments. This change reflects the trends of digital transformation across sectors.
Key Drivers:
Driving Forces Behind the Device-as-a-Service Market Growth with AI IoT Cloud and Cybersecurity Solutions
Growing requirements for economically managing IT infrastructure, rising adoption of subscription-based models, and increasing demand for remote work solutions are the major factors boosting the growth of the Device-as-a-Service (DaaS) market. For this reason, organizations have been moving towards DaaS to lower their CapEx, allowing for a predictable expenditure versus an OpEx that requires the organization to maintain the cost of both staffing and IT services relatively long after implementation. Moreover, the adoption of AI, IoT, and cloud computing also plays a significant role in driving the demand for DaaS by helping organizations boost productivity and optimize the device lifecycle management process. Rising cybersecurity threats have also led to enterprises opting for managed services and DaaS providers offer them endpoint security, timely updates, and proactive monitoring as well.
Restrain:
Challenges in the Device-as-a-Service Market Including Data Security Compliance Vendor Lock-in and Cyber Threats
The DaaS market never has a smooth ride, due to multiple challenges like data security and compliance concerns, etc. The growing dependencies of organizations on third-party providers being used to manage devices and IT infrastructure leads to data privacy breaches, unauthorized access, and cyber threats act as the key restraining factor for the growth of the market. The nature of certain DaaS solutions may limit their widespread use in sectors that require strict data protection regulations, such as healthcare, finance, or government. Fifthly, businesses may also be cautious about adopting a DaaS model entirely because of the possibility of vendor lock-in, which means dependent on a single provider and restricts their flexibility and control over their IT resources.
Opportunity:
Growth Opportunities in Device-as-a-Service Market Driven by 5G Hybrid Work Sustainable IT and SMEs Demand
The market also has enormous growth opportunities due to the growing adoption of 5G, expanding hybrid work models, and increasing need for sustainable IT solutions. Increasing adoption of sustainable IT asset management products by the vendors under the DaaS model, owing to the shifting trend of environmentally friendly and energy-efficient devices. In addition, the increasing preference of small and medium business enterprises (SMEs) for device procurement and upgradation options is opening new revenue opportunities. In addition, the growing IT infrastructure in developing countries also creates potential markets for DaaS providers.
Challenges:
Overcoming Flexibility Compatibility Supply Chain and Integration Challenges in the Device-as-a-Service Market
The second biggest challenge is the lack of flexibility and compatibility with existing IT environments. For enterprises with complex IT environments and legacy systems, it can be difficult to get DaaS offerings to integrate without causing operational problems down the road. In addition to these, higher levels of software compatibility, device standardization, and cross-platform interoperability can challenge adoption continually. Additionally, supply chain and hardware availability challenges can create friction as companies utilizing DaaS must receive and deploy the device immediately for business continuity. Eliminating these barriers calls for service providers to provide solutions that are secure, highly flexible, and highly scalable, with support specific to the industry.
By Offering
The service segment led the Device-as-a-Service (DaaS) market in 2023, capturing a 38.9%market share. The rise in demand for managed services, such as IT support, device management, security management, and software upgrades, was the impetus for this dominance. With the penchant among enterprises towards the adoption of service-based solutions to streamline operations, productivity increase, and IT asset management complexity reduction.
The hardware segment is projected to experience the highest CAGR from 2024 to 2032, owing to the increasing penetration of sophisticated computing devices, mobile phones, and IoT-based devices using DaaS. With 5G spreading and AI taking its toll on tech offerings as it pushes its surrounding device upgrade, the demand for more hardware infusion into the DaaS ecosystem is only going to get stronger.
By Device
The desktop segment held the largest market share in the Device-as-a-Service (DaaS) market segment, with a market share of 38.8% The preference was largely due to the steep demand for desktops in enterprise settings, especially in environments seeking high-performance computing such as IT, finance, and healthcare. In the DaaS model, businesses prefer desktops as these are durable, cost-effective can handle heavy workloads in an office environment.
The smartphone and peripheral segment is projected to witness the fastest CAGR from 2024 to 2032, due to the growing mobile-first work environment and remote collaboration tools. There has been an ever-increasing demand for smart devices such as smartphones, tablets, monitors, and other accessories with models based on subscriptions owing to the need for more flexible, scalable, and cost-effective IT solutions by organizations that are catering to a large workforce.
By Enterprise Size
In 2023, the Device-as-a-Service (DaaS) market was held by large enterprises 58.2% market share. The growing need for scalability of IT infrastructure, affordable end-device management, and better security options propelled this dominance. DaaS was increasingly adopted by large organizations as it helped streamline operations, minimize IT exhaustion, and improve workforce efficiency consolidated by the ongoing trend of remote and hybrid work environments.
The SME segment is poised to grow at the highest CAGR between 2024 and 2032 because of the growing demand for agile and cost-effective IT solutions. Application of DaaS technologies is being adopted not only by big enterprises but rather by SMEs where they start enlarging the usage on access to best computer equipment thereby reducing implementation along with Managed IT Services to give proper match to bigger enterprises.
By End Use
The IT & Telecom sector accounted for the biggest share of the Device-as-a-Service (DaaS) market share at 24.7% in 2023 and is anticipated to witness the fastest CAGR during the forecast period, 2024–2032. The growth can be attributed to the sector's highly reliant on advanced IT infrastructure, the increasing adoption of remote work models, and the growing need for seamless device management solutions across the network. DaaS is a solution that is appealing to the IT & Telecom industry as it continuously requires upgrades of hardware and software to run and function efficiently, which is why DaaS can help relieve the IT of the business and allows the business to be a lot more flexible. With 5G technologies, cloud, and AI based automation finding its way and scaling, it is creating the need for quickly scalable, and economical device procurement models. As telecom operators and IT service providers keep on upgrading their tech stacks, the adoption cycle for DaaS will work because it guarantees the best device lifecycle management and a boost in workforce productivity.
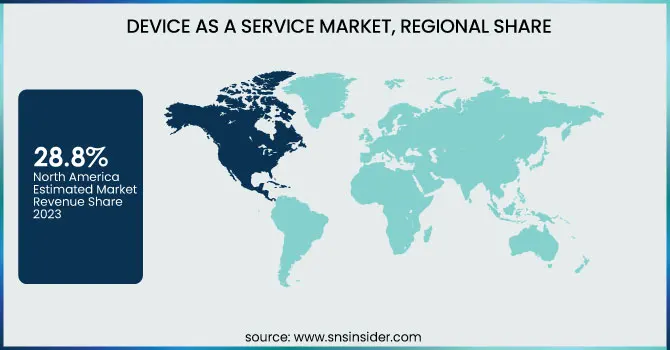
The Device-as-a-Service (DaaS) market in North America accounted for the largest size share of 28.8% in 2023, due to the presence of several technology incumbents and the early adoption of cloud-based solutions combined with an increase in demand for managed IT services. The existing IT infrastructure in the region and the established trends of remote and hybrid work culture have accelerated the adoption of DaaS by enterprises. The North American DaaS market is largely dominated by companies including HP Inc., Dell Technologies, and Lenovo that provide businesses with flexible hardware coupled with service offerings. For instance, HP offers its DaaS program for enterprises, providing customized device solutions, predictive analytics, and security, enabling organizations to streamline and optimize IT asset management.
Asia Pacific is likely to register the fastest CAGR from 2024-2032, driven by swiftly advancing digitization, rising SME adoption, and exploding 5G networks across the region. Demand for affordable IT solutions in countries such as China, India, and Japan is propelling the DaaS market forthrightly. With the rising need for scalable IT infrastructure, firms like Lenovo and Fujitsu are broadening their DaaS suppliers within the area. For example, Lenovo's TruScale DaaS provides businesses in the Asia Pacific the ability to consume state-of-the-art technology with optimal pay-per-use flexibility and minimum cost overheads to streamline day-to-day operations and enhance IT management further.
Get Customized Report as per Your Business Requirement - Enquiry Now
Some of the major players in the Device-as-a-Service Market are:
Hemmersbach (Device as a Service, Global Field Service)
Lenovo (ThinkPad Laptops, ThinkCentre Desktops)
HP (EliteBook Laptops, ProDesk Desktops)
DXC Technology (Device as a Service, IT Outsourcing)
Telia Company (Device-as-a-Service, Cloud Services)
Atea Global Services (Device as a Service, IT Infrastructure)
Yorktel (Device as a Service, Video Conferencing Solutions)
Ergo (Device as a Service, Cloud Solutions)
Dell Technologies (Latitude Laptops, OptiPlex Desktops)
Microsoft (Surface Devices, Microsoft 365)
Apple (MacBook Pro, iPad Pro)
Cisco Systems (Webex Devices, Meraki Networking)
Amazon Web Services (AWS) (WorkSpaces, EC2 Instances)
Fujitsu (LIFEBOOK Laptops, ESPRIMO Desktops)
Acer Inc. (TravelMate Laptops, Veriton Desktops)
In April 2024, Dell Technologies expanded its data protection offerings with next-gen PowerProtect Data Domain appliances and AI-integrated APEX Backup Services, aiming to combat rising cyber threats with faster backups, improved efficiency, and enhanced security.
In March 2025, Cisco introduced Agile Services Networking and an Open Telecom AI Platform, enhancing service provider growth with AI-driven automation, improved network performance, and cost efficiency.
| Report Attributes | Details |
|---|---|
| Market Size in 2023 | USD 105.27 Billion |
| Market Size by 2032 | USD 1688.53 Billion |
| CAGR | CAGR of 36.18% From 2024 to 2032 |
| Base Year | 2023 |
| Forecast Period | 2024-2032 |
| Historical Data | 2020-2022 |
| Report Scope & Coverage | Market Size, Segments Analysis, Competitive Landscape, Regional Analysis, DROC & SWOT Analysis, Forecast Outlook |
| Key Segments | • By Offering (Hardware, Software, Service) • By Device (Desktop, Laptop, Notebook and Tablet, Smartphone and Peripheral) • By Enterprise Size (Small & Medium Enterprise, Large Enterprise) • By End Use (Banking, Financial Services and Insurance (BFSI), Educational Institutions, Healthcare and Life Sciences, IT & Telecom, Public Sector and Government Offices, Others) |
| Regional Analysis/Coverage | North America (US, Canada, Mexico), Europe (Eastern Europe [Poland, Romania, Hungary, Turkey, Rest of Eastern Europe] Western Europe] Germany, France, UK, Italy, Spain, Netherlands, Switzerland, Austria, Rest of Western Europe]), Asia Pacific (China, India, Japan, South Korea, Vietnam, Singapore, Australia, Rest of Asia Pacific), Middle East & Africa (Middle East [UAE, Egypt, Saudi Arabia, Qatar, Rest of Middle East], Africa [Nigeria, South Africa, Rest of Africa], Latin America (Brazil, Argentina, Colombia, Rest of Latin America) |
| Company Profiles | Hemmersbach, Lenovo, HP, DXC Technology, Telia Company, Atea Global Services, Yorktel, Ergo, Dell Technologies, Microsoft, Apple, Cisco Systems, Amazon Web Services (AWS), Fujitsu, Acer Inc. |
Ans: The Device-as-a-Service Market is expected to grow at a CAGR of 36.18% during 2024-2032.
Ans: Device-as-a-Service Market size was USD 105.27 billion in 2023 and is expected to Reach USD 1688.53 billion by 2032.
Ans: The major growth factor of the Device-as-a-Service (DaaS) market is the increasing demand for cost-effective, scalable.
Ans: The Large Enterprise segment dominated the Device-as-a-Service Market in 2023.
Ans: North America dominated the Device-as-a-Service Market in 2023.
1. Introduction
1.1 Market Definition
1.2 Scope (Inclusion and Exclusions)
1.3 Research Assumptions
2. Executive Summary
2.1 Market Overview
2.2 Regional Synopsis
2.3 Competitive Summary
3. Research Methodology
3.1 Top-Down Approach
3.2 Bottom-up Approach
3.3. Data Validation
3.4 Primary Interviews
4. Market Dynamics Impact Analysis
4.1 Market Driving Factors Analysis
4.1.1 Drivers
4.1.2 Restraints
4.1.3 Opportunity
4.1.4 Challenges
4.2 PESTLE Analysis
4.3 Porter’s Five Forces Model
5. Statistical Insights and Trends Reporting
5.1 Adoption & Demand Metrics
5.2 Operational & Performance Metrics
5.3 Technological Evolution & Feature Adoption
5.4 Workforce & Productivity Metrics
6. Competitive Landscape
6.1 List of Major Companies, By Region
6.2 Market Share Analysis, By Region
6.3 Product Benchmarking
6.3.1 Product specifications and features
6.3.2 Pricing
6.4 Strategic Initiatives
6.4.1 Marketing and promotional activities
6.4.2 Distribution and Supply Chain Strategies
6.4.3 Expansion plans and new product launches
6.4.4 Strategic partnerships and collaborations
6.5 Technological Advancements
6.6 Market Positioning and Branding
7. Device-as-a-Service Market Segmentation, By Offering
7.1 Chapter Overview
7.2 Hardware
7.2.1 Hardware Market Trends Analysis (2020-2032)
7.2.2 Hardware Market Size Estimates and Forecasts to 2032 (USD Billion)
7.3 Software
7.3.1 Software Market Trends Analysis (2020-2032)
7.3.2 Software Market Size Estimates and Forecasts to 2032 (USD Billion)
7.4 Service
7.4.1 Service Market Trends Analysis (2020-2032)
7.4.2 Service Market Size Estimates and Forecasts to 2032 (USD Billion)
8. Device-as-a-Service Market Segmentation, By Device
8.1 Chapter Overview
8.2 Desktop
8.2.1 Desktop Market Trends Analysis (2020-2032)
8.2.2 Desktop Market Size Estimates and Forecasts to 2032 (USD Billion)
8.3 Laptop, Notebook and Tablet
8.3.1 Laptop, Notebook and Tablet Market Trends Analysis (2020-2032)
8.3.2 Laptop, Notebook and Tablet Market Size Estimates and Forecasts to 2032 (USD Billion)
8.4 Smartphone and Peripheral
8.4.1 Smartphone and Peripheral Market Trends Analysis (2020-2032)
8.4.2 Smartphone and Peripheral Market Size Estimates and Forecasts to 2032 (USD Billion)
9. Device-as-a-Service Market Segmentation, By Enterprise Size
9.1 Chapter Overview
9.2 Small & Medium Enterprise
9.2.1 Small & Medium Enterprise Market Trends Analysis (2020-2032)
9.2.2 Small & Medium Enterprise Market Size Estimates and Forecasts to 2032 (USD Billion)
9.3 Large Enterprise
9.3.1 Large Enterprise Market Trends Analysis (2020-2032)
9.3.2 Large Enterprise Market Size Estimates and Forecasts to 2032 (USD Billion)
10. Device-as-a-Service Market Segmentation, By End Use
10.1 Chapter Overview
10.2 Banking, Financial Services and Insurance (BFSI)
10.2.1 Banking, Financial Services and Insurance (BFSI) Market Trends Analysis (2020-2032)
10.2.2 Banking, Financial Services and Insurance (BFSI) Market Size Estimates and Forecasts to 2032 (USD Billion)
10.3 Educational Institutions
10.3.1 Educational Institutions Market Trends Analysis (2020-2032)
10.3.2 Educational Institutions Market Size Estimates and Forecasts to 2032 (USD Billion)
10.4 Healthcare and Life Sciences
10.4.1 Healthcare and Life Sciences Market Trends Analysis (2020-2032)
10.4.2 Healthcare and Life Sciences Market Size Estimates and Forecasts to 2032 (USD Billion)
10.5 IT & Telecom
10.5.1 IT & Telecom Market Trends Analysis (2020-2032)
10.5.2 IT & Telecom Market Size Estimates and Forecasts to 2032 (USD Billion)
10.6 Public Sector and Government Offices
10.6.1 Public Sector and Government Offices Market Trends Analysis (2020-2032)
10.6.2 Public Sector and Government Offices Market Size Estimates and Forecasts to 2032 (USD Billion)
10.7 Others
10.7.1 Others Market Trends Analysis (2020-2032)
10.7.2 Others Market Size Estimates and Forecasts to 2032 (USD Billion)
11. Regional Analysis
11.1 Chapter Overview
11.2 North America
11.2.1 Trends Analysis
11.2.2 North America Device-as-a-Service Market Estimates and Forecasts, by Country (2020-2032) (USD Billion)
11.2.3 North America Device-as-a-Service Market Estimates and Forecasts, By Offering (2020-2032) (USD Billion)
11.2.4 North America Device-as-a-Service Market Estimates and Forecasts, By Device (2020-2032) (USD Billion)
11.2.5 North America Device-as-a-Service Market Estimates and Forecasts, By Enterprise Size (2020-2032) (USD Billion)
11.2.6 North America Device-as-a-Service Market Estimates and Forecasts, By End Use (2020-2032) (USD Billion)
11.2.7 USA
11.2.7.1 USA Device-as-a-Service Market Estimates and Forecasts, By Offering (2020-2032) (USD Billion)
11.2.7.2 USA Device-as-a-Service Market Estimates and Forecasts, By Device (2020-2032) (USD Billion)
11.2.7.3 USA Device-as-a-Service Market Estimates and Forecasts, By Enterprise Size (2020-2032) (USD Billion)
11.2.7.4 USA Device-as-a-Service Market Estimates and Forecasts, By End Use (2020-2032) (USD Billion)
11.2.8 Canada
11.2.8.1 Canada Device-as-a-Service Market Estimates and Forecasts, By Offering (2020-2032) (USD Billion)
11.2.8.2 Canada Device-as-a-Service Market Estimates and Forecasts, By Device (2020-2032) (USD Billion)
11.2.8.3 Canada Device-as-a-Service Market Estimates and Forecasts, By Enterprise Size (2020-2032) (USD Billion)
11.2.8.4 Canada Device-as-a-Service Market Estimates and Forecasts, By End Use (2020-2032) (USD Billion)
11.2.9 Mexico
11.2.9.1 Mexico Device-as-a-Service Market Estimates and Forecasts, By Offering (2020-2032) (USD Billion)
11.2.9.2 Mexico Device-as-a-Service Market Estimates and Forecasts, By Device (2020-2032) (USD Billion)
11.2.9.3 Mexico Device-as-a-Service Market Estimates and Forecasts, By Enterprise Size (2020-2032) (USD Billion)
11.2.9.4 Mexico Device-as-a-Service Market Estimates and Forecasts, By End Use (2020-2032) (USD Billion)
11.3 Europe
11.3.1 Eastern Europe
11.3.1.1 Trends Analysis
11.3.1.2 Eastern Europe Device-as-a-Service Market Estimates and Forecasts, by Country (2020-2032) (USD Billion)
11.3.1.3 Eastern Europe Device-as-a-Service Market Estimates and Forecasts, By Offering (2020-2032) (USD Billion)
11.3.1.4 Eastern Europe Device-as-a-Service Market Estimates and Forecasts, By Device (2020-2032) (USD Billion)
11.3.1.5 Eastern Europe Device-as-a-Service Market Estimates and Forecasts, By Enterprise Size (2020-2032) (USD Billion)
11.3.1.6 Eastern Europe Device-as-a-Service Market Estimates and Forecasts, By End Use (2020-2032) (USD Billion)
11.3.1.7 Poland
11.3.1.7.1 Poland Device-as-a-Service Market Estimates and Forecasts, By Offering (2020-2032) (USD Billion)
11.3.1.7.2 Poland Device-as-a-Service Market Estimates and Forecasts, By Device (2020-2032) (USD Billion)
11.3.1.7.3 Poland Device-as-a-Service Market Estimates and Forecasts, By Enterprise Size (2020-2032) (USD Billion)
11.3.1.7.4 Poland Device-as-a-Service Market Estimates and Forecasts, By End Use (2020-2032) (USD Billion)
11.3.1.8 Romania
11.3.1.8.1 Romania Device-as-a-Service Market Estimates and Forecasts, By Offering (2020-2032) (USD Billion)
11.3.1.8.2 Romania Device-as-a-Service Market Estimates and Forecasts, By Device (2020-2032) (USD Billion)
11.3.1.8.3 Romania Device-as-a-Service Market Estimates and Forecasts, By Enterprise Size (2020-2032) (USD Billion)
11.3.1.8.4 Romania Device-as-a-Service Market Estimates and Forecasts, By End Use (2020-2032) (USD Billion)
11.3.1.9 Hungary
11.3.1.9.1 Hungary Device-as-a-Service Market Estimates and Forecasts, By Offering (2020-2032) (USD Billion)
11.3.1.9.2 Hungary Device-as-a-Service Market Estimates and Forecasts, By Device (2020-2032) (USD Billion)
11.3.1.9.3 Hungary Device-as-a-Service Market Estimates and Forecasts, By Enterprise Size (2020-2032) (USD Billion)
11.3.1.9.4 Hungary Device-as-a-Service Market Estimates and Forecasts, By End Use (2020-2032) (USD Billion)
11.3.1.10 turkey
11.3.1.10.1 Turkey Device-as-a-Service Market Estimates and Forecasts, By Offering (2020-2032) (USD Billion)
11.3.1.10.2 Turkey Device-as-a-Service Market Estimates and Forecasts, By Device (2020-2032) (USD Billion)
11.3.1.10.3 Turkey Device-as-a-Service Market Estimates and Forecasts, By Enterprise Size (2020-2032) (USD Billion)
11.3.1.10.4 Turkey Device-as-a-Service Market Estimates and Forecasts, By End Use (2020-2032) (USD Billion)
11.3.1.11 Rest of Eastern Europe
11.3.1.11.1 Rest of Eastern Europe Device-as-a-Service Market Estimates and Forecasts, By Offering (2020-2032) (USD Billion)
11.3.1.11.2 Rest of Eastern Europe Device-as-a-Service Market Estimates and Forecasts, By Device (2020-2032) (USD Billion)
11.3.1.11.3 Rest of Eastern Europe Device-as-a-Service Market Estimates and Forecasts, By Enterprise Size (2020-2032) (USD Billion)
11.3.1.11.4 Rest of Eastern Europe Device-as-a-Service Market Estimates and Forecasts, By End Use (2020-2032) (USD Billion)
11.3.2 Western Europe
11.3.2.1 Trends Analysis
11.3.2.2 Western Europe Device-as-a-Service Market Estimates and Forecasts, by Country (2020-2032) (USD Billion)
11.3.2.3 Western Europe Device-as-a-Service Market Estimates and Forecasts, By Offering (2020-2032) (USD Billion)
11.3.2.4 Western Europe Device-as-a-Service Market Estimates and Forecasts, By Device (2020-2032) (USD Billion)
11.3.2.5 Western Europe Device-as-a-Service Market Estimates and Forecasts, By Enterprise Size (2020-2032) (USD Billion)
11.3.2.6 Western Europe Device-as-a-Service Market Estimates and Forecasts, By End Use (2020-2032) (USD Billion)
11.3.2.7 Germany
11.3.2.7.1 Germany Device-as-a-Service Market Estimates and Forecasts, By Offering (2020-2032) (USD Billion)
11.3.2.7.2 Germany Device-as-a-Service Market Estimates and Forecasts, By Device (2020-2032) (USD Billion)
11.3.2.7.3 Germany Device-as-a-Service Market Estimates and Forecasts, By Enterprise Size (2020-2032) (USD Billion)
11.3.2.7.4 Germany Device-as-a-Service Market Estimates and Forecasts, By End Use (2020-2032) (USD Billion)
11.3.2.8 France
11.3.2.8.1 France Device-as-a-Service Market Estimates and Forecasts, By Offering (2020-2032) (USD Billion)
11.3.2.8.2 France Device-as-a-Service Market Estimates and Forecasts, By Device (2020-2032) (USD Billion)
11.3.2.8.3 France Device-as-a-Service Market Estimates and Forecasts, By Enterprise Size (2020-2032) (USD Billion)
11.3.2.8.4 France Device-as-a-Service Market Estimates and Forecasts, By End Use (2020-2032) (USD Billion)
11.3.2.9 UK
11.3.2.9.1 UK Device-as-a-Service Market Estimates and Forecasts, By Offering (2020-2032) (USD Billion)
11.3.2.9.2 UK Device-as-a-Service Market Estimates and Forecasts, By Device (2020-2032) (USD Billion)
11.3.2.9.3 UK Device-as-a-Service Market Estimates and Forecasts, By Enterprise Size (2020-2032) (USD Billion)
11.3.2.9.4 UK Device-as-a-Service Market Estimates and Forecasts, By End Use (2020-2032) (USD Billion)
11.3.2.10 Italy
11.3.2.10.1 Italy Device-as-a-Service Market Estimates and Forecasts, By Offering (2020-2032) (USD Billion)
11.3.2.10.2 Italy Device-as-a-Service Market Estimates and Forecasts, By Device (2020-2032) (USD Billion)
11.3.2.10.3 Italy Device-as-a-Service Market Estimates and Forecasts, By Enterprise Size (2020-2032) (USD Billion)
11.3.2.10.4 Italy Device-as-a-Service Market Estimates and Forecasts, By End Use (2020-2032) (USD Billion)
11.3.2.11 Spain
11.3.2.11.1 Spain Device-as-a-Service Market Estimates and Forecasts, By Offering (2020-2032) (USD Billion)
11.3.2.11.2 Spain Device-as-a-Service Market Estimates and Forecasts, By Device (2020-2032) (USD Billion)
11.3.2.11.3 Spain Device-as-a-Service Market Estimates and Forecasts, By Enterprise Size (2020-2032) (USD Billion)
11.3.2.11.4 Spain Device-as-a-Service Market Estimates and Forecasts, By End Use (2020-2032) (USD Billion)
11.3.2.12 Netherlands
11.3.2.12.1 Netherlands Device-as-a-Service Market Estimates and Forecasts, By Offering (2020-2032) (USD Billion)
11.3.2.12.2 Netherlands Device-as-a-Service Market Estimates and Forecasts, By Device (2020-2032) (USD Billion)
11.3.2.12.3 Netherlands Device-as-a-Service Market Estimates and Forecasts, By Enterprise Size (2020-2032) (USD Billion)
11.3.2.12.4 Netherlands Device-as-a-Service Market Estimates and Forecasts, By End Use (2020-2032) (USD Billion)
11.3.2.13 Switzerland
11.3.2.13.1 Switzerland Device-as-a-Service Market Estimates and Forecasts, By Offering (2020-2032) (USD Billion)
11.3.2.13.2 Switzerland Device-as-a-Service Market Estimates and Forecasts, By Device (2020-2032) (USD Billion)
11.3.2.13.3 Switzerland Device-as-a-Service Market Estimates and Forecasts, By Enterprise Size (2020-2032) (USD Billion)
11.3.2.13.4 Switzerland Device-as-a-Service Market Estimates and Forecasts, By End Use (2020-2032) (USD Billion)
11.3.2.14 Austria
11.3.2.14.1 Austria Device-as-a-Service Market Estimates and Forecasts, By Offering (2020-2032) (USD Billion)
11.3.2.14.2 Austria Device-as-a-Service Market Estimates and Forecasts, By Device (2020-2032) (USD Billion)
11.3.2.14.3 Austria Device-as-a-Service Market Estimates and Forecasts, By Enterprise Size (2020-2032) (USD Billion)
11.3.2.14.4 Austria Device-as-a-Service Market Estimates and Forecasts, By End Use (2020-2032) (USD Billion)
11.3.2.15 Rest of Western Europe
11.3.2.15.1 Rest of Western Europe Device-as-a-Service Market Estimates and Forecasts, By Offering (2020-2032) (USD Billion)
11.3.2.15.2 Rest of Western Europe Device-as-a-Service Market Estimates and Forecasts, By Device (2020-2032) (USD Billion)
11.3.2.15.3 Rest of Western Europe Device-as-a-Service Market Estimates and Forecasts, By Enterprise Size (2020-2032) (USD Billion)
11.3.2.15.4 Rest of Western Europe Device-as-a-Service Market Estimates and Forecasts, By End Use (2020-2032) (USD Billion)
11.4 Asia Pacific
11.4.1 Trends Analysis
11.4.2 Asia Pacific Device-as-a-Service Market Estimates and Forecasts, by Country (2020-2032) (USD Billion)
11.4.3 Asia Pacific Device-as-a-Service Market Estimates and Forecasts, By Offering (2020-2032) (USD Billion)
11.4.4 Asia Pacific Device-as-a-Service Market Estimates and Forecasts, By Device (2020-2032) (USD Billion)
11.4.5 Asia Pacific Device-as-a-Service Market Estimates and Forecasts, By Enterprise Size (2020-2032) (USD Billion)
11.4.6 Asia Pacific Device-as-a-Service Market Estimates and Forecasts, By End Use (2020-2032) (USD Billion)
11.4.7 China
11.4.7.1 China Device-as-a-Service Market Estimates and Forecasts, By Offering (2020-2032) (USD Billion)
11.4.7.2 China Device-as-a-Service Market Estimates and Forecasts, By Device (2020-2032) (USD Billion)
11.4.7.3 China Device-as-a-Service Market Estimates and Forecasts, By Enterprise Size (2020-2032) (USD Billion)
11.4.7.4 China Device-as-a-Service Market Estimates and Forecasts, By End Use (2020-2032) (USD Billion)
11.4.8 India
11.4.8.1 India Device-as-a-Service Market Estimates and Forecasts, By Offering (2020-2032) (USD Billion)
11.4.8.2 India Device-as-a-Service Market Estimates and Forecasts, By Device (2020-2032) (USD Billion)
11.4.8.3 India Device-as-a-Service Market Estimates and Forecasts, By Enterprise Size (2020-2032) (USD Billion)
11.4.8.4 India Device-as-a-Service Market Estimates and Forecasts, By End Use (2020-2032) (USD Billion)
11.4.9 Japan
11.4.9.1 Japan Device-as-a-Service Market Estimates and Forecasts, By Offering (2020-2032) (USD Billion)
11.4.9.2 Japan Device-as-a-Service Market Estimates and Forecasts, By Device (2020-2032) (USD Billion)
11.4.9.3 Japan Device-as-a-Service Market Estimates and Forecasts, By Enterprise Size (2020-2032) (USD Billion)
11.4.9.4 Japan Device-as-a-Service Market Estimates and Forecasts, By End Use (2020-2032) (USD Billion)
11.4.10 South Korea
11.4.10.1 South Korea Device-as-a-Service Market Estimates and Forecasts, By Offering (2020-2032) (USD Billion)
11.4.10.2 South Korea Device-as-a-Service Market Estimates and Forecasts, By Device (2020-2032) (USD Billion)
11.4.10.3 South Korea Device-as-a-Service Market Estimates and Forecasts, By Enterprise Size (2020-2032) (USD Billion)
11.4.10.4 South Korea Device-as-a-Service Market Estimates and Forecasts, By End Use (2020-2032) (USD Billion)
11.4.11 Vietnam
11.4.11.1 Vietnam Device-as-a-Service Market Estimates and Forecasts, By Offering (2020-2032) (USD Billion)
11.4.11.2 Vietnam Device-as-a-Service Market Estimates and Forecasts, By Device (2020-2032) (USD Billion)
11.4.11.3 Vietnam Device-as-a-Service Market Estimates and Forecasts, By Enterprise Size (2020-2032) (USD Billion)
11.4.11.4 Vietnam Device-as-a-Service Market Estimates and Forecasts, By End Use (2020-2032) (USD Billion)
11.4.12 Singapore
11.4.12.1 Singapore Device-as-a-Service Market Estimates and Forecasts, By Offering (2020-2032) (USD Billion)
11.4.12.2 Singapore Device-as-a-Service Market Estimates and Forecasts, By Device (2020-2032) (USD Billion)
11.4.12.3 Singapore Device-as-a-Service Market Estimates and Forecasts, By Enterprise Size (2020-2032) (USD Billion)
11.4.12.4 Singapore Device-as-a-Service Market Estimates and Forecasts, By End Use (2020-2032) (USD Billion)
11.4.13 Australia
11.4.13.1 Australia Device-as-a-Service Market Estimates and Forecasts, By Offering (2020-2032) (USD Billion)
11.4.13.2 Australia Device-as-a-Service Market Estimates and Forecasts, By Device (2020-2032) (USD Billion)
11.4.13.3 Australia Device-as-a-Service Market Estimates and Forecasts, By Enterprise Size (2020-2032) (USD Billion)
11.4.13.4 Australia Device-as-a-Service Market Estimates and Forecasts, By End Use (2020-2032) (USD Billion)
11.4.14 Rest of Asia Pacific
11.4.14.1 Rest of Asia Pacific Device-as-a-Service Market Estimates and Forecasts, By Offering (2020-2032) (USD Billion)
11.4.14.2 Rest of Asia Pacific Device-as-a-Service Market Estimates and Forecasts, By Device (2020-2032) (USD Billion)
11.4.14.3 Rest of Asia Pacific Device-as-a-Service Market Estimates and Forecasts, By Enterprise Size (2020-2032) (USD Billion)
11.4.14.4 Rest of Asia Pacific Device-as-a-Service Market Estimates and Forecasts, By End Use (2020-2032) (USD Billion)
11.5 Middle East and Africa
11.5.1 Middle East
11.5.1.1 Trends Analysis
11.5.1.2 Middle East Device-as-a-Service Market Estimates and Forecasts, by Country (2020-2032) (USD Billion)
11.5.1.3 Middle East Device-as-a-Service Market Estimates and Forecasts, By Offering (2020-2032) (USD Billion)
11.5.1.4 Middle East Device-as-a-Service Market Estimates and Forecasts, By Device (2020-2032) (USD Billion)
11.5.1.5 Middle East Device-as-a-Service Market Estimates and Forecasts, By Enterprise Size (2020-2032) (USD Billion)
11.5.1.6 Middle East Device-as-a-Service Market Estimates and Forecasts, By End Use (2020-2032) (USD Billion)
11.5.1.7 UAE
11.5.1.7.1 UAE Device-as-a-Service Market Estimates and Forecasts, By Offering (2020-2032) (USD Billion)
11.5.1.7.2 UAE Device-as-a-Service Market Estimates and Forecasts, By Device (2020-2032) (USD Billion)
11.5.1.7.3 UAE Device-as-a-Service Market Estimates and Forecasts, By Enterprise Size (2020-2032) (USD Billion)
11.5.1.7.4 UAE Device-as-a-Service Market Estimates and Forecasts, By End Use (2020-2032) (USD Billion)
11.5.1.8 Egypt
11.5.1.8.1 Egypt Device-as-a-Service Market Estimates and Forecasts, By Offering (2020-2032) (USD Billion)
11.5.1.8.2 Egypt Device-as-a-Service Market Estimates and Forecasts, By Device (2020-2032) (USD Billion)
11.5.1.8.3 Egypt Device-as-a-Service Market Estimates and Forecasts, By Enterprise Size (2020-2032) (USD Billion)
11.5.1.8.4 Egypt Device-as-a-Service Market Estimates and Forecasts, By End Use (2020-2032) (USD Billion)
11.5.1.9 Saudi Arabia
11.5.1.9.1 Saudi Arabia Device-as-a-Service Market Estimates and Forecasts, By Offering (2020-2032) (USD Billion)
11.5.1.9.2 Saudi Arabia Device-as-a-Service Market Estimates and Forecasts, By Device (2020-2032) (USD Billion)
11.5.1.9.3 Saudi Arabia Device-as-a-Service Market Estimates and Forecasts, By Enterprise Size (2020-2032) (USD Billion)
11.5.1.9.4 Saudi Arabia Device-as-a-Service Market Estimates and Forecasts, By End Use (2020-2032) (USD Billion)
11.5.1.10 Qatar
11.5.1.10.1 Qatar Device-as-a-Service Market Estimates and Forecasts, By Offering (2020-2032) (USD Billion)
11.5.1.10.2 Qatar Device-as-a-Service Market Estimates and Forecasts, By Device (2020-2032) (USD Billion)
11.5.1.10.3 Qatar Device-as-a-Service Market Estimates and Forecasts, By Enterprise Size (2020-2032) (USD Billion)
11.5.1.10.4 Qatar Device-as-a-Service Market Estimates and Forecasts, By End Use (2020-2032) (USD Billion)
11.5.1.11 Rest of Middle East
11.5.1.11.1 Rest of Middle East Device-as-a-Service Market Estimates and Forecasts, By Offering (2020-2032) (USD Billion)
11.5.1.11.2 Rest of Middle East Device-as-a-Service Market Estimates and Forecasts, By Device (2020-2032) (USD Billion)
11.5.1.11.3 Rest of Middle East Device-as-a-Service Market Estimates and Forecasts, By Enterprise Size (2020-2032) (USD Billion)
11.5.1.11.4 Rest of Middle East Device-as-a-Service Market Estimates and Forecasts, By End Use (2020-2032) (USD Billion)
11.5.2 Africa
11.5.2.1 Trends Analysis
11.5.2.2 Africa Device-as-a-Service Market Estimates and Forecasts, by Country (2020-2032) (USD Billion)
11.5.2.3 Africa Device-as-a-Service Market Estimates and Forecasts, By Offering (2020-2032) (USD Billion)
11.5.2.4 Africa Device-as-a-Service Market Estimates and Forecasts, By Device (2020-2032) (USD Billion)
11.5.2.5 Africa Device-as-a-Service Market Estimates and Forecasts, By Enterprise Size (2020-2032) (USD Billion)
11.5.2.6 Africa Device-as-a-Service Market Estimates and Forecasts, By End Use (2020-2032) (USD Billion)
11.5.2.7 South Africa
11.5.2.7.1 South Africa Device-as-a-Service Market Estimates and Forecasts, By Offering (2020-2032) (USD Billion)
11.5.2.7.2 South Africa Device-as-a-Service Market Estimates and Forecasts, By Device (2020-2032) (USD Billion)
11.5.2.7.3 South Africa Device-as-a-Service Market Estimates and Forecasts, By Enterprise Size (2020-2032) (USD Billion)
11.5.2.7.4 South Africa Device-as-a-Service Market Estimates and Forecasts, By End Use (2020-2032) (USD Billion)
11.5.2.8 Nigeria
11.5.2.8.1 Nigeria Device-as-a-Service Market Estimates and Forecasts, By Offering (2020-2032) (USD Billion)
11.5.2.8.2 Nigeria Device-as-a-Service Market Estimates and Forecasts, By Device (2020-2032) (USD Billion)
11.5.2.8.3 Nigeria Device-as-a-Service Market Estimates and Forecasts, By Enterprise Size (2020-2032) (USD Billion)
11.5.2.8.4 Nigeria Device-as-a-Service Market Estimates and Forecasts, By End Use (2020-2032) (USD Billion)
11.5.2.9 Rest of Africa
11.5.2.9.1 Rest of Africa Device-as-a-Service Market Estimates and Forecasts, By Offering (2020-2032) (USD Billion)
11.5.2.9.2 Rest of Africa Device-as-a-Service Market Estimates and Forecasts, By Device (2020-2032) (USD Billion)
11.5.2.9.3 Rest of Africa Device-as-a-Service Market Estimates and Forecasts, By Enterprise Size (2020-2032) (USD Billion)
11.5.2.9.4 Rest of Africa Device-as-a-Service Market Estimates and Forecasts, By End Use (2020-2032) (USD Billion)
11.6 Latin America
11.6.1 Trends Analysis
11.6.2 Latin America Device-as-a-Service Market Estimates and Forecasts, by Country (2020-2032) (USD Billion)
11.6.3 Latin America Device-as-a-Service Market Estimates and Forecasts, By Offering (2020-2032) (USD Billion)
11.6.4 Latin America Device-as-a-Service Market Estimates and Forecasts, By Device (2020-2032) (USD Billion)
11.6.5 Latin America Device-as-a-Service Market Estimates and Forecasts, By Enterprise Size (2020-2032) (USD Billion)
11.6.6 Latin America Device-as-a-Service Market Estimates and Forecasts, By End Use (2020-2032) (USD Billion)
11.6.7 Brazil
11.6.7.1 Brazil Device-as-a-Service Market Estimates and Forecasts, By Offering (2020-2032) (USD Billion)
11.6.7.2 Brazil Device-as-a-Service Market Estimates and Forecasts, By Device (2020-2032) (USD Billion)
11.6.7.3 Brazil Device-as-a-Service Market Estimates and Forecasts, By Enterprise Size (2020-2032) (USD Billion)
11.6.7.4 Brazil Device-as-a-Service Market Estimates and Forecasts, By End Use (2020-2032) (USD Billion)
11.6.8 Argentina
11.6.8.1 Argentina Device-as-a-Service Market Estimates and Forecasts, By Offering (2020-2032) (USD Billion)
11.6.8.2 Argentina Device-as-a-Service Market Estimates and Forecasts, By Device (2020-2032) (USD Billion)
11.6.8.3 Argentina Device-as-a-Service Market Estimates and Forecasts, By Enterprise Size (2020-2032) (USD Billion)
11.6.8.4 Argentina Device-as-a-Service Market Estimates and Forecasts, By End Use (2020-2032) (USD Billion)
11.6.9 Colombia
11.6.9.1 Colombia Device-as-a-Service Market Estimates and Forecasts, By Offering (2020-2032) (USD Billion)
11.6.9.2 Colombia Device-as-a-Service Market Estimates and Forecasts, By Device (2020-2032) (USD Billion)
11.6.9.3 Colombia Device-as-a-Service Market Estimates and Forecasts, By Enterprise Size (2020-2032) (USD Billion)
11.6.9.4 Colombia Device-as-a-Service Market Estimates and Forecasts, By End Use (2020-2032) (USD Billion)
11.6.10 Rest of Latin America
11.6.10.1 Rest of Latin America Device-as-a-Service Market Estimates and Forecasts, By Offering (2020-2032) (USD Billion)
11.6.10.2 Rest of Latin America Device-as-a-Service Market Estimates and Forecasts, By Device (2020-2032) (USD Billion)
11.6.10.3 Rest of Latin America Device-as-a-Service Market Estimates and Forecasts, By Enterprise Size (2020-2032) (USD Billion)
11.6.10.4 Rest of Latin America Device-as-a-Service Market Estimates and Forecasts, By End Use (2020-2032) (USD Billion)
12. Company Profiles
12.1 Hemmersbach.
12.1.1 Company Overview
12.1.2 Financial
12.1.3 Products/ Services Offered
12.1.4 SWOT Analysis
12.2 Lenovo
12.2.1 Company Overview
12.2.2 Financial
12.2.3 Products/ Services Offered
12.2.4 SWOT Analysis
12.3 HP.
12.3.1 Company Overview
12.3.2 Financial
12.3.3 Products/ Services Offered
12.3.4 SWOT Analysis
12.4 DXC Technology.
12.4.1 Company Overview
12.4.2 Financial
12.4.3 Products/ Services Offered
12.4.4 SWOT Analysis
12.5 Telia Company
12.5.1 Company Overview
12.5.2 Financial
12.5.3 Products/ Services Offered
12.5.4 SWOT Analysis
12.6 Atea Global Services
12.6.1 Company Overview
12.6.2 Financial
12.6.3 Products/ Services Offered
12.6.4 SWOT Analysis
12.7 Yorktel
12.7.1 Company Overview
12.7.2 Financial
12.7.3 Products/ Services Offered
12.7.4 SWOT Analysis
12.8 Ergo
12.8.1 Company Overview
12.8.2 Financial
12.8.3 Products/ Services Offered
12.8.4 SWOT Analysis
12.9 Dell Technologies
12.9.1 Company Overview
12.9.2 Financial
12.9.3 Products/ Services Offered
12.9.4 SWOT Analysis
12.10 Microsoft
12.10.1 Company Overview
12.10.2 Financial
12.10.3 Products/ Services Offered
12.10.4 SWOT Analysis
13. Use Cases and Best Practices
14. Conclusion
An accurate research report requires proper strategizing as well as implementation. There are multiple factors involved in the completion of good and accurate research report and selecting the best methodology to compete the research is the toughest part. Since the research reports we provide play a crucial role in any company’s decision-making process, therefore we at SNS Insider always believe that we should choose the best method which gives us results closer to reality. This allows us to reach at a stage wherein we can provide our clients best and accurate investment to output ratio.
Each report that we prepare takes a timeframe of 350-400 business hours for production. Starting from the selection of titles through a couple of in-depth brain storming session to the final QC process before uploading our titles on our website we dedicate around 350 working hours. The titles are selected based on their current market cap and the foreseen CAGR and growth.
The 5 steps process:
Step 1: Secondary Research:
Secondary Research or Desk Research is as the name suggests is a research process wherein, we collect data through the readily available information. In this process we use various paid and unpaid databases which our team has access to and gather data through the same. This includes examining of listed companies’ annual reports, Journals, SEC filling etc. Apart from this our team has access to various associations across the globe across different industries. Lastly, we have exchange relationships with various university as well as individual libraries.

Step 2: Primary Research
When we talk about primary research, it is a type of study in which the researchers collect relevant data samples directly, rather than relying on previously collected data. This type of research is focused on gaining content specific facts that can be sued to solve specific problems. Since the collected data is fresh and first hand therefore it makes the study more accurate and genuine.
We at SNS Insider have divided Primary Research into 2 parts.
Part 1 wherein we interview the KOLs of major players as well as the upcoming ones across various geographic regions. This allows us to have their view over the market scenario and acts as an important tool to come closer to the accurate market numbers. As many as 45 paid and unpaid primary interviews are taken from both the demand and supply side of the industry to make sure we land at an accurate judgement and analysis of the market.
This step involves the triangulation of data wherein our team analyses the interview transcripts, online survey responses and observation of on filed participants. The below mentioned chart should give a better understanding of the part 1 of the primary interview.

Part 2: In this part of primary research the data collected via secondary research and the part 1 of the primary research is validated with the interviews from individual consultants and subject matter experts.
Consultants are those set of people who have at least 12 years of experience and expertise within the industry whereas Subject Matter Experts are those with at least 15 years of experience behind their back within the same space. The data with the help of two main processes i.e., FGDs (Focused Group Discussions) and IDs (Individual Discussions). This gives us a 3rd party nonbiased primary view of the market scenario making it a more dependable one while collation of the data pointers.
Step 3: Data Bank Validation
Once all the information is collected via primary and secondary sources, we run that information for data validation. At our intelligence centre our research heads track a lot of information related to the market which includes the quarterly reports, the daily stock prices, and other relevant information. Our data bank server gets updated every fortnight and that is how the information which we collected using our primary and secondary information is revalidated in real time.

Step 4: QA/QC Process
After all the data collection and validation our team does a final level of quality check and quality assurance to get rid of any unwanted or undesired mistakes. This might include but not limited to getting rid of the any typos, duplication of numbers or missing of any important information. The people involved in this process include technical content writers, research heads and graphics people. Once this process is completed the title gets uploader on our platform for our clients to read it.
Step 5: Final QC/QA Process:
This is the last process and comes when the client has ordered the study. In this process a final QA/QC is done before the study is emailed to the client. Since we believe in giving our clients a good experience of our research studies, therefore, to make sure that we do not lack at our end in any way humanly possible we do a final round of quality check and then dispatch the study to the client.
By Offering
Hardware
Software
Service
By Device
Desktop
Laptop, Notebook and Tablet
Smartphone and Peripheral
By Enterprise Size
Small & Medium Enterprise
Large Enterprise
By End Use
Banking, Financial Services and Insurance (BFSI)
Educational Institutions
Healthcare and Life Sciences
IT & Telecom
Public Sector and Government Offices
Others
Request for Segment Customization as per your Business Requirement: Segment Customization Request
Regional Coverage:
North America
US
Canada
Mexico
Europe
Eastern Europe
Poland
Romania
Hungary
Turkey
Rest of Eastern Europe
Western Europe
Germany
France
UK
Italy
Spain
Netherlands
Switzerland
Austria
Rest of Western Europe
Asia Pacific
China
India
Japan
South Korea
Vietnam
Singapore
Australia
Rest of Asia Pacific
Middle East & Africa
Middle East
UAE
Egypt
Saudi Arabia
Qatar
Rest of Middle East
Africa
Nigeria
South Africa
Rest of Africa
Latin America
Brazil
Argentina
Colombia
Rest of Latin America
Request for Country Level Research Report: Country Level Customization Request
Available Customization
With the given market data, SNS Insider offers customization as per the company’s specific needs. The following customization options are available for the report:
Detailed Volume Analysis
Criss-Cross segment analysis (e.g. Product X Application)
Competitive Product Benchmarking
Geographic Analysis
Additional countries in any of the regions
Customized Data Representation
Detailed analysis and profiling of additional market players
The Laser Printer Market Size was valued at USD 10.2 Billion in 2023 and It is expected to grow at a CAGR of 5.79% to reach USD 16.8 Billion by 2032.
The Counterfeit Money Detection Market was valued at USD 3.55 billion in 2023 and is expected to reach USD 5.46 billion by 2032, growing at a CAGR of 4.90% from 2024 to 2032.
The Electrical Enclosures Market size was $ 7.91 Billion in 2023 and is estimated to Reach USD 13.95 billion by 2032 and grow at a CAGR of 6.56% over the forecast period of 2024-2032.
The Ethernet Controller Market Size was valued at USD 11.36 Billion in 2023 and is expected to reach USD 20.71 Billion by 2032 and grow at a CAGR of 6.95% over the forecast period 2024-2032.
The Track Geometry Measurement System Market Size was valued at USD 3.58 Billion in 2023 and It is expected to grow at a CAGR of 6.1% During 2024-2032.
The Raman Spectroscopy Market was valued at USD 1.04 billion in 2023 and is projected to reach USD 2.00 billion by 2032, growing at a CAGR of 7.51% from 2024 to 2032.

Hi! Click one of our member below to chat on Phone
© 2025 All Rights Reserved by SNS Insider Pvt Ltd


