Dental Imaging Market Size & Overview:
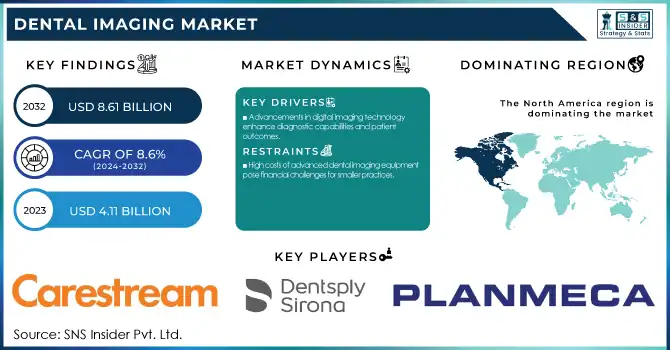
The Dental Imaging Market size was valued at USD 4.11 billion in 2023 and is expected to reach USD 8.61 billion by 2032, growing at a CAGR of 8.6% over the forecast period 2024-2032.
Get more information on Dental Imaging Market - Request Sample Report
The global dental imaging market report highlights key trends and insights related to the increasing prevalence of dental disorders and their impact on the demand for advanced imaging technologies. It examines the percentage of usage of advanced implementable options such as 2D/3D imaging, CBCT, and digital scanners, to underscore the transition from analog to digital dentistry. The report monitors the number of devices in different parts of the world as well as spending on health care through government, private insurance, and out-of-pocket expenditures. It also looks at technology trends like AI-enhanced imaging and cloud integration and highlights the most desired capabilities. It discusses regulatory compliance and its role in market expansion, particularly in emerging markets. These insights will help to have a better understanding of the current as well as future situation of the global market. A key factor contributing to the growth of the dental imaging market is the rising prevalence of dental disorders and increasing demand for advanced diagnostic technologies.
Dental Imaging Market Dynamics:
Drivers
-
Advancements in digital imaging technology enhance diagnostic capabilities and patient outcomes.
Transforming Dentistry Diagnostics and Outcomes An important new development is the use of artificial intelligence (AI) within dental imaging systems. To illustrate, in August 2024, Boston-based Perceptive became the first-ever tech company to perform a fully automated dental procedure leveraging autonomous AI imaging software along with a robotic arm. In dental procedures, this system showed a 90 percent accuracy while conventional X-ray has only 40 percent accuracy. Likewise, Overjet launched an AI-powered tool in October 2024 to upgrade dental X-rays by applying visual indicators as it analyzes cases to alert dentists about problems like cavities and exposed nerves. Such technology not only helps dentists with accurate diagnosis but also makes it easier for patients to understand their condition, which leads to them complying with the treatment plan better. In addition, the use of a range of AI in dental imaging is on the rise. The rise illustrates the escalating dependence on AI to enhance diagnostic accuracy and operational effectiveness in dental offices. Advances in dental diagnostics for early and accurate oral health issue detection, as well as new treatment planning options. The integration of AI and digital imaging tools is setting new standards for precision and patient care in modern dentistry.
Restraint:
-
High costs of advanced dental imaging equipment pose financial challenges for smaller practices.
One of the biggest challenges for small & medium Dental practices is the high cost of setting up imaging advanced Dental equipment. For example, Cone Beam Computed Tomography (CBCT) machines cost USD 150,000 to USD 300,000, with imaging prices per procedure of USD 300 to USD 600. Digital dental X-ray systems also necessitate significant investment, with average costs ranging from USD 120,000 to USD 280,000. Such expenses are often aggravated by the non-reimbursement policy in many countries that provides little or no financial support for dental treatments. Higher costs associated with new imaging modalities can prevent smaller practices from adopting and maintaining state-of-the-art imaging equipment, which can restrict their diagnostic capabilities and hinder their ability to compete in the marketplace.
Opportunity:
-
Integration of artificial intelligence in imaging systems offers enhanced diagnostic accuracy and workflow efficiency.
The integration of artificial intelligence (AI) in dental imaging presents a significant opportunity to enhance diagnostic accuracy and operational efficiency within dental practices. Recent advancements have demonstrated AI's potential to revolutionize dental care. In August 2024, Perceptive, a Boston-based technology company, achieved a milestone by performing the world's first fully automated robotic dental procedure. This procedure uses an AI-controlled robotic system to autonomously drill and shape a patient's tooth (termed cutting) It uses state-of-the-art 3D imaging and artificial intelligence analysis to create accurate models of dental structures, allowing for accurate and effective treatment. Why this is so interesting because this technology promises to cut the amount of time required for things like, for example, crown placements, down from 1+ hour over 2 visits to just 15 minutes. The AI has shown a 90% accuracy rate for dental problem detection, compared to a 40% accuracy rate for traditional X-rays. The adoption of AI in dentistry is also growing. According to survey data among dental professionals, 15% directly incorporated AI in 2022 and this growth increased to 18% in 2024. This growth mirrors a wider trend toward integrating AI technologies to enhance diagnostic accuracy and patient care.
Challenge:
-
Ensuring compliance with stringent regulatory standards requires significant time and resources.
Ensuring compliance with stringent regulatory standards in the dental imaging market presents significant challenges. Guidelines from authorities like the U.S. Food and Drug Administration (FDA) and International Electrotechnical Commission (IEC) cover the safety, performance, and labeling of radiographic equipment, and manufacturers must maneuver through these rules to find the proper balance. Although adherent to the 21 CFR Part 1020 requirements of the FDA for radiation protection in dental-specific X-ray devices, which aim to minimize unnecessary exposure, the principles outlined here require significant investment in technology and quality control. In addition, understanding the regulatory environment to relate to compliance with international standards such as, the IEC 60601 series is challenging and time-intensive, making it difficult to distribute products globally. Routine equipment inspections and testing are staples of quality assurance protocols, which further complicate operations. Furthermore, the dynamic nature of technology, with the emergence of modalities like cone beam computed tomography (CBCT), also leads to new regulatory requirements, which keep manufacturers in a constant state of adaptation to meet changing standards and maintain their access to safe products in the market.
Dental Imaging Market Segmentation Insights:
By Type
The intraoral imaging segment dominated the market with a revenue share of 56% in 2023, while the extraoral imaging segment is expected to show lucrative growth. The dominance of intraoral imaging can be attributed to its widespread use in routine dental examinations and its cost-effectiveness. According to the ADA, intraoral radiographs account for over 90% of all dental X-rays performed in the United States. The Centers for Medicare & Medicaid Services (CMS) reports that in 2024, reimbursement rates for intraoral imaging procedures increased by 3.5%, further incentivizing their use. The U.S. Food and Drug Administration (FDA) has been actively promoting the use of digital intraoral imaging systems due to their lower radiation exposure compared to traditional film-based systems. In 2024, the FDA approved 15% more digital intraoral imaging devices than in 2023, indicating a growing market for these technologies. Furthermore, the National Institute of Dental and Craniofacial Research (NIDCR) has allocated USD 25 million in grants for research on advanced intraoral imaging techniques, including AI-assisted diagnostics, which is expected to drive innovation in this segment.
The extraoral imaging segment is showing promising growth potential. This is largely due to the increasing adoption of 3D imaging technologies like cone-beam computed tomography (CBCT) in complex dental procedures. The American Academy of Oral and Maxillofacial Radiology reports that the use of CBCT in dental practices has grown by 20% annually since 2020.
By Application
In 2023, the implantology segment accounted for the largest market share of 39%. This dominance is partially due to the increasing need for dental implants and the significant contribution of advanced imaging to the success of implant planning and placement. According to the American Academy of Implant Dentistry, approximately 3 million Americans have dental implants, with this number growing by 500,000 annually. According to the National Institute of Dental and Craniofacial Research (NIDCR), the success rate for dental implants over the last five years has increased from 95% to 98%, and this is largely due to improvements in imaging technologies that allow for more accurate planning and placement of dental implants. Moreover, the FDA has approved more than 30% more implant-specific imaging software than in the previous two years, signaling a burgeoning market for specialized imaging solutions in this sector. Through its Healthy People 2030 initiative, the U.S. Department of Health and Human Services has set a target for the percentage of adults having a dental visit in the past year to increase from 65.4% to 68%. This is likely to bring in more patients to dental procedures, including implant treatments, which in turn will fuel the growth of imaging technologies in implantology.
By End-user
In 2023, the solo practices segment held the largest revenue share. This is due to a large number of solo dental practices in the United States that have also been increasingly using digital imaging technologies. Based on a data source from the American Dental Association (ADA) in 2023, nearly 50% of all dentists in the U.S. were solo practitioners. In 2023, according to the Health Resources and Services Administration (HRSA), 62% of dental health professional shortage areas were in rural or partially rural locations, where solo practices are more frequent. A 5% increase in reimbursement rates for digital imaging procedures performed in solo practices was implemented by the Centers for Medicare & Medicaid Services (CMS) in 2023, hence further encouraging the said technology. In fiscal year 2023, the Small Business Administration (SBA) offered USD 150 million in loans to solo dental practices to upgrade their technology, including imaging equipment. Such financial assistance has provided a significant push for the expansion of the dental imaging market segment concerning solo practices.
The U.S. Department of Health and Human Services' Office of the National Coordinator for Health Information Technology (ONC), reported that by the end of 2023, 78% of solo dental practices had adopted certified electronic health record (EHR) systems, many of which integrate with digital imaging technologies. The high rate of EHR adoption has enabled the wide use of advanced imaging solutions in solo practices.
Dental Imaging Market Regional Analysis:
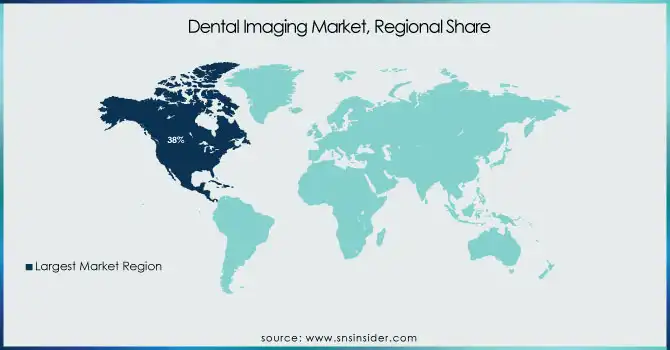
North America held the dental imaging market share of 38% in 2023 driven by its advanced healthcare infrastructure, high adoption rate of novel technologies, and friendly reimbursement policies. Established in 1965, the USA-based Centers for Medicare & Medicaid Services (CMS) recently reported the fact that the highest expenditure for dental services in the USA has remained high, amounting to approximately USD 158 billion in 2023, an increase of 5.2% as compared to 2022. In 2024, the National Institutes of Health (NIH) funded USD 575 million worth of dental and craniofacial research with a substantial portion reserved for imaging technologies. According to the U.S. Food and Drug Administration (FDA), a total of 25% more dental imaging devices were authorized in 2023 than in 2022, which suggests that the demand for advanced imaging devices is increasing in the region. According to the American Dental Association (ADA), adoption rates of digital radiography systems were reported by 85% of dental practices in North America in 2024, compared to 76% in 2020.
The Asia-Pacific region is anticipated to grow with the Highest CAGR during the forecast period Factors such as increasing healthcare spending, heightened awareness about oral health, and government initiatives to enhance access to dental care are driving this rapid growth. The National Health Commission of China noted that the number of dental clinics increased by 15% in 2023 alone, with an emphasis on expanding them to rural areas. In India, the Ministry of Health and Family Welfare launched a National Oral Health Program in 2024, allocating USD 100 million for improving dental care infrastructure, including imaging facilities.
Need any customization research on Dental Imaging Market - Enquiry Now
Key Players:
Key Service Providers/Manufacturers
-
Carestream Health (Carestream Dental X-ray, CS 9600 Cone Beam CT)
-
Dentsply Sirona (Orthophos XG 3D, Sirona XG3)
-
Planmeca (Planmeca ProMax 3D, Planmeca Romexis)
-
Sirona Dental Systems (CEREC, Orthophos SL)
-
Vatech (PaX-i3D Smart, EzRay Air)
-
Fujifilm Holdings Corporation (Fujifilm X-ray, FDR Go Plus)
-
Midmark Corporation (Midmark Imaging System, 3D Panoramic Imaging)
-
3Shape (3Shape TRIOS, 3Shape Dental System)
-
Xoran Technologies (Xoran MiniCat, Xoran X-ray)
-
Konica Minolta (Regius 110, AeroDR X-ray)
Key Users of Dental Imaging Services and Products
-
Private Dental Clinics
-
Dental Hospitals
-
Orthodontic Practices
-
Dental Laboratories
-
University Dental Schools
-
Government Health Departments
-
Veterinary Clinics
-
Research Institutes
-
Public Health Programs
-
Mobile Dental Units
Recent Developments:
-
Planmeca expanded its range with the launch of the Planmeca ProMax 3D Classic system, offering high-resolution 3D imaging with low radiation exposure. The system is also cloud-enabled for seamless data storage and sharing, catering to the growing demand for digital workflows.
-
In March 2024, Carestream Dental introduced a cloud-based imaging platform that allows for seamless integration of various imaging modalities and AI-assisted diagnostics. The company reported a 20% increase in adoption rates among U.S. dental practices within the first six months of launch.
| Report Attributes | Details |
|---|---|
|
Market Size in 2023 |
USD 4.1 Billion |
|
Market Size by 2032 |
USD 8.6 Billion |
|
CAGR |
CAGR of 8.6% From 2024 to 2032 |
|
Base Year |
2023 |
|
Forecast Period |
2024-2032 |
|
Historical Data |
2020-2022 |
|
Report Scope & Coverage |
Market Size, Segments Analysis, Competitive Landscape, Regional Analysis, DROC & SWOT Analysis, Forecast Outlook |
|
Key Segments |
• By Type (Extraoral Imaging {Panoramic Systems, Panoramic & Cephalometric Systems, Intraoral Imaging, Dental Cone Beam Computed Tomography (CBCT), X-ray Systems} Intraoral Sensors {Intraoral Photostimulable Phosphor Systems, Intraoral Cameras, Intraoral Scanners}) |
|
Regional Analysis/Coverage |
North America (US, Canada, Mexico), Europe (Eastern Europe [Poland, Romania, Hungary, Turkey, Rest of Eastern Europe] Western Europe] Germany, France, UK, Italy, Spain, Netherlands, Switzerland, Austria, Rest of Western Europe]), Asia Pacific (China, India, Japan, South Korea, Vietnam, Singapore, Australia, Rest of Asia Pacific), Middle East & Africa (Middle East [UAE, Egypt, Saudi Arabia, Qatar, Rest of Middle East], Africa [Nigeria, South Africa, Rest of Africa], Latin America (Brazil, Argentina, Colombia, Rest of Latin America) |
|
Company Profiles |
Carestream Health, Dentsply Sirona, Planmeca, Sirona Dental Systems, Vatech, Fujifilm Holdings Corporation, Midmark Corporation, 3Shape, Xoran Technologies, Konica Minolta |
