image

Deep Learning Market Report Scope & Overview:
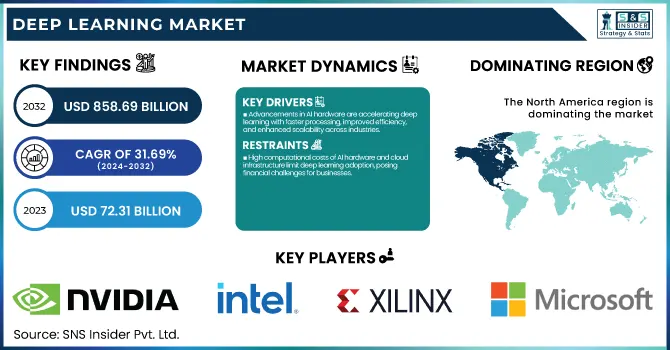
Deep Learning Market was valued at USD 72.31 billion in 2023 and is expected to reach USD 858.69 billion by 2032, growing at a CAGR of 31.69% from 2024-2032. This report includes insights on adoption rates, investment trends, data volume trends, and model training expenses. The industry is growing at a fast pace, fueled by rising adoption across sectors like healthcare, finance, and automotive. Increased investments in AI infrastructure, coupled with growing datasets, are boosting model complexity. Rising training expenses are challenging this, which is further fueling developments in energy-efficient computing. While organizations pursue the use of deep learning to automate and make decisions, the need for cost-effective and scalable solutions is defining market trends, driving innovation and competition.

Deep Learning Market Dynamics

Drivers

  • Advancements in AI hardware are accelerating deep learning with faster processing, improved efficiency, and enhanced scalability across industries.

Increased compute power from GPUs, TPUs, and neuromorphic chips is dramatically accelerating training and inference of deep learning models. Specialized processors bring more efficiency to the table, allowing for processing data faster and designing more complicated neural network topologies. Greater usage of specialty AI hardware lowers power consumption and enhances model precision, bringing deep learning into reach in more sectors. High-performance computing is also driving real-time AI innovation in applications such as autonomous systems, medical diagnostics, and natural language processing. As hardware advancements keep coming, deep learning models are increasingly becoming scalable, efficient, and powerful enough to deal with enormous data sets. All this technological acceleration is transforming industries, powering automation, and making new things possible with AI-based decision-making and predictive analytics.

Restraints

  • High computational costs of AI hardware and cloud infrastructure limit deep learning adoption, posing financial challenges for businesses.

Large amounts of memory and processing capability are required by deep learning training models, using expensive AI processors such as TPUs, GPUs, and optimized processors, requiring large operational investments. The prices of purchasing and keeping these enhanced computing systems bar small and mid-sized businesses, making it restrictive for mass-scale adoption. Also, cloud-based AI solutions, though scalable, are accompanied by recurring expenses that put pressure on budgets. The rising sophistication of deep learning models also increases resource needs, leading to increased energy consumption and infrastructure spending. As organizations try to achieve innovation while remaining cost-effective, the necessity for optimized AI hardware and affordable training methods becomes imperative. These financial issues need to be addressed to ensure increased accessibility and long-term sustainability of deep learning solutions.

Opportunities

  • Deep learning enhances hyper-personalization in e-commerce, entertainment, and customer engagement by delivering AI-driven tailored experiences in real time.

Deep learning is transforming personalization through the ability of AI systems to scrutinize large volumes of user data and provide customized experiences in real time. In online shopping, recommendation systems based on AI boost the shopping experience by accurately anticipating customer preferences. Deep learning is being used in the entertainment sector to develop customized content recommendations, maximizing viewer engagement. Companies are implementing AI-based chatbots and virtual assistants to offer personalized interactions, enhancing customer satisfaction and loyalty. With deep learning models evolving further, hyper-personalization is spreading to healthcare, finance, and education, providing personalized solutions according to personal requirements. This transition towards AI-based personalization is redefining customer engagement strategies, opening up new revenue streams, and building brand loyalty across industries.

Challenges

  • Inconsistent, biased, and insufficient data impact deep learning accuracy, limiting reliability and effectiveness across industries like healthcare and finance.

Deep learning models are dependent on large volumes of high-quality data for training, but inconsistencies, biases, and data unavailability can have a significant effect on their accuracy and effectiveness. Low-quality datasets may produce erroneous predictions, thus reducing the reliability of AI-based decision-making in mission-critical industries such as healthcare, finance, and autonomous vehicles. Biased training data can also yield unjust or incorrect results, posing ethical issues and regulatory problems. Furthermore, data fragmentation across industries prevents one from easily acquiring complete and representative datasets. Standardizing data, enhancing preprocessing methods, and applying bias-mitigation techniques are key to optimizing deep learning performance. Overcoming these data-related issues will be vital to unleashing the full potential of AI-powered innovations across sectors.

Deep Learning Market Segment Analysis

By Application

In 2023, the Image Recognition segment dominated the Deep Learning Market with the largest revenue share of approximately 43%. It is led by its extensive application across industries like security, healthcare, retail, and autonomous cars. Computer vision advancements, demand for facial recognition and object identification, and implementation in smart devices have propelled it. Moreover, the growth of AI-based surveillance systems and e-commerce platforms using image-based search and recommendation algorithms has been a major contributor to its market dominance.

The Data Mining segment is anticipated to expand at the fastest CAGR of approximately 34.98% during 2024-2032. This high growth is due to the rising amount of unstructured data in industries, which is fueling the need for deep learning algorithms to derive meaningful insights. Companies are utilizing data mining for predictive analysis, fraud detection, and customer behavior analysis. The growth of big data technologies, cloud computing, and AI-based decision-making processes further boosts its adoption, rendering it the fastest-growing segment in the Deep Learning Market.

By Solution

In 2023, the Software segment dominated the Deep Learning Market with the highest revenue share of about 48%. This dominance is driven by the increasing adoption of AI-powered applications across industries, including healthcare, finance, and automotive. Advancements in deep learning frameworks, neural network algorithms, and cloud-based AI solutions have further fueled demand. Businesses are investing in AI-driven analytics, automation, and natural language processing (NLP) tools, contributing to software’s strong market position. Additionally, the rise of AI-as-a-Service (AIaaS) has accelerated software adoption globally.

Hardware is anticipated to grow at the fastest CAGR of 33.63% during 2024-2032. It is energized by the surging demand for powerful computing infrastructure to service deep learning-driven applications. Growing usage of GPUs, TPUs, and AI accelerators in model training and inference fuels hardware innovation. Increasing investments in data centers, edge computing, and AI-based processors also amplify growth. The demand for effective, high-speed hardware solutions renders this segment the fastest-growing in the Deep Learning Market.

By End-use

The Automotive segment led the Deep Learning Market with the largest revenue share of approximately 25% in 2023. This is spurred by the increasing adoption of AI-driven technologies in autonomous vehicles, driver assistance systems, and predictive maintenance. Development of computer vision, sensor fusion, and real-time data processing have boosted the pace of AI penetration in automotive usage. Further investments in autonomous vehicle technology, smart transportation systems, and advanced safety features have added to the position of the automotive industry as the leader in the Deep Learning Market.

The Healthcare segment will expand at the fastest CAGR of 34.30% during the period 2024-2032. This high growth is driven by the increasing use of AI-based diagnostics, personalized medicine, and medical imaging solutions. Deep learning boosts disease detection, drug discovery, and patient monitoring, enhancing healthcare efficiency and accuracy. Increasing investments in AI-enabled healthcare solutions, telemedicine, and robotic surgeries also fuel adoption. The growing requirement for sophisticated data analytics and predictive modeling makes healthcare the fastest-growing segment in the Deep Learning Market.

Regional Analysis

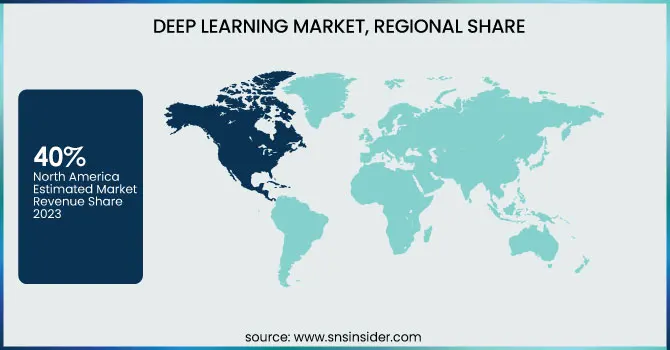
North America led the Deep Learning Market with the largest revenue share of around 40% in 2023. The leadership is based on the extensive presence of prominent AI firms, high research and development activities, and high use of deep learning technologies in various industries. The area is favored with huge investments in AI infrastructure, cloud computing, and autonomous systems. Furthermore, growth in healthcare AI, smart manufacturing, and financial analytics, as well as government initiatives in favor of AI innovation, have further cemented North America's dominance in the Deep Learning Market.

Asia Pacific is expected to grow at the fastest CAGR of 33.73% from 2024 through 2032. Rising uptake of AI technologies in industries like manufacturing, healthcare, and e-commerce powers high growth in the region. Increasing investments in smart cities, automation, and research on AI drive market growth even further. The developing digital economy in the region, increasing number of AI startups, and government initiatives for artificial intelligence development are all factors that support Asia Pacific as the fastest-growing segment in the Deep Learning Market.

Key Players

  • NVIDIA (TensorRT, DGX Systems)

  • Intel (OpenVINO, Habana Gaudi)

  • Xilinx (Versal AI Core, Alveo U50)

  • Samsung Electronics (Exynos AI, HBM-PIM)

  • Micron Technology (Neural Cache, LPDDR5X)

  • Qualcomm (Snapdragon AI, Cloud AI 100)

  • IBM (Watson Studio, Power10 AI)

  • Google (TensorFlow, TPU)

  • Microsoft (Azure Machine Learning, Project Brainwave)

  • AWS (SageMaker, Inferentia)

  • Graphcore (IPU-Machine, Poplar SDK)

  • Mythic (M1076 AMP, Mythic Analog Compute Engine)

  • Adapteva (Epiphany AI Accelerator, Parallella)

  • Koniku (Konikore, Neuromorphic Chips)

  • ARM Ltd. (Ethos-N78, Cortex-A78AE)

  • Clarifai, Inc. (Clarifai API, AI Platform)

  • Entilic (DeepRadiology, Entilic AI Suite)

  • HyperVerge (HyperVerge Vision AI, Face Recognition API)

  • Advanced Micro Devices (Radeon Instinct, ROCm)

Recent Developments:

  • At CES 2025, NVIDIA CEO Jensen Huang unveiled the GeForce RTX 50 Series GPUs, powered by the new Blackwell AI chip, marking a significant advancement in AI-driven rendering for gamers, developers, and creators.

  • In 2025, Microsoft and OpenAI extended their partnership, securing exclusive rights to OpenAI’s models for Copilot and Azure OpenAI Service while maintaining revenue-sharing agreements. OpenAI also committed to expanding its use of Azure for model training and research.

Deep Learning Market Report Scope:

Report Attributes Details
Market Size in 2023 USD 72.31 Billion
Market Size by 2032 USD 858.69 Billion
CAGR CAGR of 31.69% From 2024 to 2032
Base Year 2023
Forecast Period 2024-2032
Historical Data 2020-2022
Report Scope & Coverage Market Size, Segments Analysis, Competitive  Landscape, Regional Analysis, DROC & SWOT Analysis, Forecast Outlook
Key Segments • By Solution (Hardware, Software, Services)
• By Application (Image Recognition, Voice Recognition, Video Surveillance & Diagnostics, Data Mining)
• By End-use (Automotive, Aerospace & Defense, Healthcare, Retail, Others)
Regional Analysis/Coverage North America (US, Canada, Mexico), Europe (Eastern Europe [Poland, Romania, Hungary, Turkey, Rest of Eastern Europe] Western Europe] Germany, France, UK, Italy, Spain, Netherlands, Switzerland, Austria, Rest of Western Europe]), Asia Pacific (China, India, Japan, South Korea, Vietnam, Singapore, Australia, Rest of Asia Pacific), Middle East & Africa (Middle East [UAE, Egypt, Saudi Arabia, Qatar, Rest of Middle East], Africa [Nigeria, South Africa, Rest of Africa], Latin America (Brazil, Argentina, Colombia, Rest of Latin America)
Company Profiles NVIDIA, Intel, Xilinx, Samsung Electronics, Micron Technology, Qualcomm, IBM, Google, Microsoft, AWS, Graphcore, Mythic, Adapteva, Koniku, ARM Ltd., Clarifai Inc., Entilic, HyperVerge, Advanced Micro Devices

Frequently Asked Questions

ANS: Deep Learning Market was valued at USD 72.31 billion in 2023 and is expected to reach USD 858.69 billion by 2032, growing at a CAGR of 31.69% from 2024-2032.

ANS: The Image Recognition segment held the highest revenue share of 43%.

ANS: The Software segment dominated with a 48% revenue share.

ANS: The Automotive segment held the highest revenue share of 25%.

ANS: North America led with a 40% revenue share.

Table of Contents:

1. Introduction

1.1 Market Definition

1.2 Scope (Inclusion and Exclusions)

1.3 Research Assumptions

2. Executive Summary

2.1 Market Overview

2.2 Regional Synopsis

2.3 Competitive Summary

3. Research Methodology

3.1 Top-Down Approach

3.2 Bottom-up Approach

3.3. Data Validation

3.4 Primary Interviews

4. Market Dynamics Impact Analysis

4.1 Market Driving Factors Analysis

4.1.1 Drivers

4.1.2 Restraints

4.1.3 Opportunities

4.1.4 Challenges

4.2 PESTLE Analysis

4.3 Porter’s Five Forces Model

5. Statistical Insights and Trends Reporting

5.1 Adoption Rate

5.2 Investment Trends

5.3 Data Volume Trends

5.4 Model Training Costs

6. Competitive Landscape

6.1 List of Major Companies, By Region

6.2 Market Share Analysis, By Region

6.3 Product Benchmarking

6.3.1 Product specifications and features

6.3.2 Pricing

6.4 Strategic Initiatives

6.4.1 Marketing and promotional activities

6.4.2 Distribution and supply chain strategies

6.4.3 Expansion plans and new product launches

6.4.4 Strategic partnerships and collaborations

6.5 Technological Advancements

6.6 Market Positioning and Branding

7. Deep Learning Market Segmentation, By Solution

7.1 Chapter Overview

7.2 Hardware

7.2.1 Hardware Market Trends Analysis (2020-2032)

7.2.2 Hardware Market Size Estimates and Forecasts to 2032 (USD Billion)

7.3 Software

7.3.1 Software Market Trends Analysis (2020-2032)

7.3.2 Software Market Size Estimates and Forecasts to 2032 (USD Billion)

7.4 Services

7.4.1 Services Market Trends Analysis (2020-2032)

7.4.2 Services Market Size Estimates and Forecasts to 2032 (USD Billion)

8. Deep Learning Market Segmentation, By Application

8.1 Chapter Overview

8.2 Image Recognition

8.2.1 Image Recognition Market Trends Analysis (2020-2032)

8.2.2 Image Recognition Market Size Estimates and Forecasts to 2032 (USD Billion)

8.3 Voice Recognition

8.3.1 Voice Recognition Market Trends Analysis (2020-2032)

8.3.2 Voice Recognition Market Size Estimates and Forecasts to 2032 (USD Billion)

8.4 Video Surveillance & Diagnostics

8.4.1 Video Surveillance & Diagnostics Market Trends Analysis (2020-2032)

8.4.2 Video Surveillance & Diagnostics Market Size Estimates and Forecasts to 2032 (USD Billion)

8.5 Data Mining

8.5.1 Data Mining Market Trends Analysis (2020-2032)

8.5.2 Data Mining Market Size Estimates and Forecasts to 2032 (USD Billion)

9. Deep Learning Market Segmentation, By End-use

9.1 Chapter Overview

9.2 Automotive

9.2.1 Automotive Market Trends Analysis (2020-2032)

9.2.2 Automotive Market Size Estimates and Forecasts to 2032 (USD Billion)

9.3 Aerospace & Defense

9.3.1 Aerospace & Defense Market Trends Analysis (2020-2032)

9.3.2 Aerospace & Defense Market Size Estimates and Forecasts to 2032 (USD Billion)

9.4 Healthcare

               9.4.1 Healthcare Market Trends Analysis (2020-2032)

9.4.2 Healthcare Market Size Estimates and Forecasts to 2032 (USD Billion)

9.5 Retail

9.5.1 Retail Market Trends Analysis (2020-2032)

9.5.2 Retail Market Size Estimates and Forecasts to 2032 (USD Billion)

9.6 Others

9.6.1 Others Market Trends Analysis (2020-2032)

9.6.2 Others Market Size Estimates and Forecasts to 2032 (USD Billion)

10. Regional Analysis

10.1 Chapter Overview

10.2 North America

10.2.1 Trends Analysis

10.2.2 North America Deep Learning Market Estimates and Forecasts, by Country (2020-2032) (USD Billion)

10.2.3 North America Deep Learning Market Estimates and Forecasts, By Solution (2020-2032) (USD Billion) 

10.2.4 North America Deep Learning Market Estimates and Forecasts, By Application (2020-2032) (USD Billion)

10.2.5 North America Deep Learning Market Estimates and Forecasts, By End-use (2020-2032) (USD Billion)

10.2.6 USA

10.2.6.1 USA Deep Learning Market Estimates and Forecasts, By Solution (2020-2032) (USD Billion)

10.2.6.2 USA Deep Learning Market Estimates and Forecasts, By Application (2020-2032) (USD Billion)

10.2.6.3 USA Deep Learning Market Estimates and Forecasts, By End-use (2020-2032) (USD Billion)

10.2.7 Canada

10.2.7.1 Canada Deep Learning Market Estimates and Forecasts, By Solution (2020-2032) (USD Billion)

10.2.7.2 Canada Deep Learning Market Estimates and Forecasts, By Application (2020-2032) (USD Billion)

10.2.7.3 Canada Deep Learning Market Estimates and Forecasts, By End-use (2020-2032) (USD Billion)

10.2.8 Mexico

10.2.8.1 Mexico Deep Learning Market Estimates and Forecasts, By Solution (2020-2032) (USD Billion)

10.2.8.2 Mexico Deep Learning Market Estimates and Forecasts, By Application (2020-2032) (USD Billion)

10.2.8.3 Mexico Deep Learning Market Estimates and Forecasts, By End-use (2020-2032) (USD Billion)

10.3 Europe

10.3.1 Eastern Europe

10.3.1.1 Trends Analysis

10.3.1.2 Eastern Europe Deep Learning Market Estimates and Forecasts, by Country (2020-2032) (USD Billion)

10.3.1.3 Eastern Europe Deep Learning Market Estimates and Forecasts, By Solution (2020-2032) (USD Billion) 

10.3.1.4 Eastern Europe Deep Learning Market Estimates and Forecasts, By Application (2020-2032) (USD Billion)

10.3.1.5 Eastern Europe Deep Learning Market Estimates and Forecasts, By End-use (2020-2032) (USD Billion)

10.3.1.6 Poland

10.3.1.6.1 Poland Deep Learning Market Estimates and Forecasts, By Solution (2020-2032) (USD Billion)

10.3.1.6.2 Poland Deep Learning Market Estimates and Forecasts, By Application (2020-2032) (USD Billion)

10.3.1.6.3 Poland Deep Learning Market Estimates and Forecasts, By End-use (2020-2032) (USD Billion)

10.3.1.7 Romania

10.3.1.7.1 Romania Deep Learning Market Estimates and Forecasts, By Solution (2020-2032) (USD Billion)

10.3.1.7.2 Romania Deep Learning Market Estimates and Forecasts, By Application (2020-2032) (USD Billion)

10.3.1.7.3 Romania Deep Learning Market Estimates and Forecasts, By End-use (2020-2032) (USD Billion)

10.3.1.8 Hungary

10.3.1.8.1 Hungary Deep Learning Market Estimates and Forecasts, By Solution (2020-2032) (USD Billion)

10.3.1.8.2 Hungary Deep Learning Market Estimates and Forecasts, By Application (2020-2032) (USD Billion)

10.3.1.8.3 Hungary Deep Learning Market Estimates and Forecasts, By End-use (2020-2032) (USD Billion)

10.3.1.9 Turkey

10.3.1.9.1 Turkey Deep Learning Market Estimates and Forecasts, By Solution (2020-2032) (USD Billion)

10.3.1.9.2 Turkey Deep Learning Market Estimates and Forecasts, By Application (2020-2032) (USD Billion)

10.3.1.9.3 Turkey Deep Learning Market Estimates and Forecasts, By End-use (2020-2032) (USD Billion)

10.3.1.10 Rest of Eastern Europe

10.3.1.10.1 Rest of Eastern Europe Deep Learning Market Estimates and Forecasts, By Solution (2020-2032) (USD Billion)

10.3.1.10.2 Rest of Eastern Europe Deep Learning Market Estimates and Forecasts, By Application (2020-2032) (USD Billion)

10.3.1.10.3 Rest of Eastern Europe Deep Learning Market Estimates and Forecasts, By End-use (2020-2032) (USD Billion)

10.3.2 Western Europe

10.3.2.1 Trends Analysis

10.3.2.2 Western Europe Deep Learning Market Estimates and Forecasts, by Country (2020-2032) (USD Billion)

10.3.2.3 Western Europe Deep Learning Market Estimates and Forecasts, By Solution (2020-2032) (USD Billion) 

10.3.2.4 Western Europe Deep Learning Market Estimates and Forecasts, By Application (2020-2032) (USD Billion)

10.3.2.5 Western Europe Deep Learning Market Estimates and Forecasts, By End-use (2020-2032) (USD Billion)

10.3.2.6 Germany

10.3.2.6.1 Germany Deep Learning Market Estimates and Forecasts, By Solution (2020-2032) (USD Billion)

10.3.2.6.2 Germany Deep Learning Market Estimates and Forecasts, By Application (2020-2032) (USD Billion)

10.3.2.6.3 Germany Deep Learning Market Estimates and Forecasts, By End-use (2020-2032) (USD Billion)

10.3.2.7 France

10.3.2.7.1 France Deep Learning Market Estimates and Forecasts, By Solution (2020-2032) (USD Billion)

10.3.2.7.2 France Deep Learning Market Estimates and Forecasts, By Application (2020-2032) (USD Billion)

10.3.2.7.3 France Deep Learning Market Estimates and Forecasts, By End-use (2020-2032) (USD Billion)

10.3.2.8 UK

10.3.2.8.1 UK Deep Learning Market Estimates and Forecasts, By Solution (2020-2032) (USD Billion)

10.3.2.8.2 UK Deep Learning Market Estimates and Forecasts, By Application (2020-2032) (USD Billion)

10.3.2.8.3 UK Deep Learning Market Estimates and Forecasts, By End-use (2020-2032) (USD Billion)

10.3.2.9 Italy

10.3.2.9.1 Italy Deep Learning Market Estimates and Forecasts, By Solution (2020-2032) (USD Billion)

10.3.2.9.2 Italy Deep Learning Market Estimates and Forecasts, By Application (2020-2032) (USD Billion)

10.3.2.9.3 Italy Deep Learning Market Estimates and Forecasts, By End-use (2020-2032) (USD Billion)

10.3.2.10 Spain

10.3.2.10.1 Spain Deep Learning Market Estimates and Forecasts, By Solution (2020-2032) (USD Billion)

10.3.2.10.2 Spain Deep Learning Market Estimates and Forecasts, By Application (2020-2032) (USD Billion)

10.3.2.10.3 Spain Deep Learning Market Estimates and Forecasts, By End-use (2020-2032) (USD Billion)

10.3.2.11 Netherlands

10.3.2.11.1 Netherlands Deep Learning Market Estimates and Forecasts, By Solution (2020-2032) (USD Billion)

10.3.2.11.2 Netherlands Deep Learning Market Estimates and Forecasts, By Application (2020-2032) (USD Billion)

10.3.2.11.3 Netherlands Deep Learning Market Estimates and Forecasts, By End-use (2020-2032) (USD Billion)

10.3.2.12 Switzerland

10.3.2.12.1 Switzerland Deep Learning Market Estimates and Forecasts, By Solution (2020-2032) (USD Billion)

10.3.2.12.2 Switzerland Deep Learning Market Estimates and Forecasts, By Application (2020-2032) (USD Billion)

10.3.2.12.3 Switzerland Deep Learning Market Estimates and Forecasts, By End-use (2020-2032) (USD Billion)

10.3.2.13 Austria

10.3.2.13.1 Austria Deep Learning Market Estimates and Forecasts, By Solution (2020-2032) (USD Billion)

10.3.2.13.2 Austria Deep Learning Market Estimates and Forecasts, By Application (2020-2032) (USD Billion)

10.3.2.13.3 Austria Deep Learning Market Estimates and Forecasts, By End-use (2020-2032) (USD Billion)

10.3.2.14 Rest of Western Europe

10.3.2.14.1 Rest of Western Europe Deep Learning Market Estimates and Forecasts, By Solution (2020-2032) (USD Billion)

10.3.2.14.2 Rest of Western Europe Deep Learning Market Estimates and Forecasts, By Application (2020-2032) (USD Billion)

10.3.2.14.3 Rest of Western Europe Deep Learning Market Estimates and Forecasts, By End-use (2020-2032) (USD Billion)

10.4 Asia Pacific

10.4.1 Trends Analysis

10.4.2 Asia Pacific Deep Learning Market Estimates and Forecasts, by Country (2020-2032) (USD Billion)

10.4.3 Asia Pacific Deep Learning Market Estimates and Forecasts, By Solution (2020-2032) (USD Billion) 

10.4.4 Asia Pacific Deep Learning Market Estimates and Forecasts, By Application (2020-2032) (USD Billion)

10.4.5 Asia Pacific Deep Learning Market Estimates and Forecasts, By End-use (2020-2032) (USD Billion)

10.4.6 China

10.4.6.1 China Deep Learning Market Estimates and Forecasts, By Solution (2020-2032) (USD Billion)

10.4.6.2 China Deep Learning Market Estimates and Forecasts, By Application (2020-2032) (USD Billion)

10.4.6.3 China Deep Learning Market Estimates and Forecasts, By End-use (2020-2032) (USD Billion)

10.4.7 India

10.4.7.1 India Deep Learning Market Estimates and Forecasts, By Solution (2020-2032) (USD Billion)

10.4.7.2 India Deep Learning Market Estimates and Forecasts, By Application (2020-2032) (USD Billion)

10.4.7.3 India Deep Learning Market Estimates and Forecasts, By End-use (2020-2032) (USD Billion)

10.4.8 Japan

10.4.8.1 Japan Deep Learning Market Estimates and Forecasts, By Solution (2020-2032) (USD Billion)

10.4.8.2 Japan Deep Learning Market Estimates and Forecasts, By Application (2020-2032) (USD Billion)

10.4.8.3 Japan Deep Learning Market Estimates and Forecasts, By End-use (2020-2032) (USD Billion)

10.4.9 South Korea

10.4.9.1 South Korea Deep Learning Market Estimates and Forecasts, By Solution (2020-2032) (USD Billion)

10.4.9.2 South Korea Deep Learning Market Estimates and Forecasts, By Application (2020-2032) (USD Billion)

10.4.9.3 South Korea Deep Learning Market Estimates and Forecasts, By End-use (2020-2032) (USD Billion)

10.4.10 Vietnam

10.4.10.1 Vietnam Deep Learning Market Estimates and Forecasts, By Solution (2020-2032) (USD Billion)

10.4.10.2 Vietnam Deep Learning Market Estimates and Forecasts, By Application (2020-2032) (USD Billion)

10.4.10.3 Vietnam Deep Learning Market Estimates and Forecasts, By End-use (2020-2032) (USD Billion)

10.4.11 Singapore

10.4.11.1 Singapore Deep Learning Market Estimates and Forecasts, By Solution (2020-2032) (USD Billion)

10.4.11.2 Singapore Deep Learning Market Estimates and Forecasts, By Application (2020-2032) (USD Billion)

10.4.11.3 Singapore Deep Learning Market Estimates and Forecasts, By End-use (2020-2032) (USD Billion)

10.4.12 Australia

10.4.12.1 Australia Deep Learning Market Estimates and Forecasts, By Solution (2020-2032) (USD Billion)

10.4.12.2 Australia Deep Learning Market Estimates and Forecasts, By Application (2020-2032) (USD Billion)

10.4.12.3 Australia Deep Learning Market Estimates and Forecasts, By End-use (2020-2032) (USD Billion)

10.4.13 Rest of Asia Pacific

10.4.13.1 Rest of Asia Pacific Deep Learning Market Estimates and Forecasts, By Solution (2020-2032) (USD Billion)

10.4.13.2 Rest of Asia Pacific Deep Learning Market Estimates and Forecasts, By Application (2020-2032) (USD Billion)

10.4.13.3 Rest of Asia Pacific Deep Learning Market Estimates and Forecasts, By End-use (2020-2032) (USD Billion)

10.5 Middle East and Africa

10.5.1 Middle East

10.5.1.1 Trends Analysis

10.5.1.2 Middle East Deep Learning Market Estimates and Forecasts, by Country (2020-2032) (USD Billion)

10.5.1.3 Middle East Deep Learning Market Estimates and Forecasts, By Solution (2020-2032) (USD Billion) 

10.5.1.4 Middle East Deep Learning Market Estimates and Forecasts, By Application (2020-2032) (USD Billion)

10.5.1.5 Middle East Deep Learning Market Estimates and Forecasts, By End-use (2020-2032) (USD Billion)

10.5.1.6 UAE

10.5.1.6.1 UAE Deep Learning Market Estimates and Forecasts, By Solution (2020-2032) (USD Billion)

10.5.1.6.2 UAE Deep Learning Market Estimates and Forecasts, By Application (2020-2032) (USD Billion)

10.5.1.6.3 UAE Deep Learning Market Estimates and Forecasts, By End-use (2020-2032) (USD Billion)

10.5.1.7 Egypt

10.5.1.7.1 Egypt Deep Learning Market Estimates and Forecasts, By Solution (2020-2032) (USD Billion)

10.5.1.7.2 Egypt Deep Learning Market Estimates and Forecasts, By Application (2020-2032) (USD Billion)

10.5.1.7.3 Egypt Deep Learning Market Estimates and Forecasts, By End-use (2020-2032) (USD Billion)

10.5.1.8 Saudi Arabia

10.5.1.8.1 Saudi Arabia Deep Learning Market Estimates and Forecasts, By Solution (2020-2032) (USD Billion)

10.5.1.8.2 Saudi Arabia Deep Learning Market Estimates and Forecasts, By Application (2020-2032) (USD Billion)

10.5.1.8.3 Saudi Arabia Deep Learning Market Estimates and Forecasts, By End-use (2020-2032) (USD Billion)

10.5.1.9 Qatar

10.5.1.9.1 Qatar Deep Learning Market Estimates and Forecasts, By Solution (2020-2032) (USD Billion)

10.5.1.9.2 Qatar Deep Learning Market Estimates and Forecasts, By Application (2020-2032) (USD Billion)

10.5.1.9.3 Qatar Deep Learning Market Estimates and Forecasts, By End-use (2020-2032) (USD Billion)

10.5.1.10 Rest of Middle East

10.5.1.10.1 Rest of Middle East Deep Learning Market Estimates and Forecasts, By Solution (2020-2032) (USD Billion)

10.5.1.10.2 Rest of Middle East Deep Learning Market Estimates and Forecasts, By Application (2020-2032) (USD Billion)

10.5.1.10.3 Rest of Middle East Deep Learning Market Estimates and Forecasts, By End-use (2020-2032) (USD Billion)

10.5.2 Africa

10.5.2.1 Trends Analysis

10.5.2.2 Africa Deep Learning Market Estimates and Forecasts, by Country (2020-2032) (USD Billion)

10.5.2.3 Africa Deep Learning Market Estimates and Forecasts, By Solution (2020-2032) (USD Billion) 

10.5.2.4 Africa Deep Learning Market Estimates and Forecasts, By Application (2020-2032) (USD Billion)

10.5.2.5 Africa Deep Learning Market Estimates and Forecasts, By End-use (2020-2032) (USD Billion)

10.5.2.6 South Africa

10.5.2.6.1 South Africa Deep Learning Market Estimates and Forecasts, By Solution (2020-2032) (USD Billion)

10.5.2.6.2 South Africa Deep Learning Market Estimates and Forecasts, By Application (2020-2032) (USD Billion)

10.5.2.6.3 South Africa Deep Learning Market Estimates and Forecasts, By End-use (2020-2032) (USD Billion)

10.5.2.7 Nigeria

10.5.2.7.1 Nigeria Deep Learning Market Estimates and Forecasts, By Solution (2020-2032) (USD Billion)

10.5.2.7.2 Nigeria Deep Learning Market Estimates and Forecasts, By Application (2020-2032) (USD Billion)

10.5.2.7.3 Nigeria Deep Learning Market Estimates and Forecasts, By End-use (2020-2032) (USD Billion)

10.5.2.8 Rest of Africa

10.5.2.8.1 Rest of Africa Deep Learning Market Estimates and Forecasts, By Solution (2020-2032) (USD Billion)

10.5.2.8.2 Rest of Africa Deep Learning Market Estimates and Forecasts, By Application (2020-2032) (USD Billion)

10.5.2.8.3 Rest of Africa Deep Learning Market Estimates and Forecasts, By End-use (2020-2032) (USD Billion)

10.6 Latin America

10.6.1 Trends Analysis

10.6.2 Latin America Deep Learning Market Estimates and Forecasts, by Country (2020-2032) (USD Billion)

10.6.3 Latin America Deep Learning Market Estimates and Forecasts, By Solution (2020-2032) (USD Billion) 

10.6.4 Latin America Deep Learning Market Estimates and Forecasts, By Application (2020-2032) (USD Billion)

10.6.5 Latin America Deep Learning Market Estimates and Forecasts, By End-use (2020-2032) (USD Billion)

10.6.6 Brazil

10.6.6.1 Brazil Deep Learning Market Estimates and Forecasts, By Solution (2020-2032) (USD Billion)

10.6.6.2 Brazil Deep Learning Market Estimates and Forecasts, By Application (2020-2032) (USD Billion)

10.6.6.3 Brazil Deep Learning Market Estimates and Forecasts, By End-use (2020-2032) (USD Billion)

10.6.7 Argentina

10.6.7.1 Argentina Deep Learning Market Estimates and Forecasts, By Solution (2020-2032) (USD Billion)

10.6.7.2 Argentina Deep Learning Market Estimates and Forecasts, By Application (2020-2032) (USD Billion)

10.6.7.3 Argentina Deep Learning Market Estimates and Forecasts, By End-use (2020-2032) (USD Billion)

10.6.8 Colombia

10.6.8.1 Colombia Deep Learning Market Estimates and Forecasts, By Solution (2020-2032) (USD Billion)

10.6.8.2 Colombia Deep Learning Market Estimates and Forecasts, By Application (2020-2032) (USD Billion)

10.6.8.3 Colombia Deep Learning Market Estimates and Forecasts, By End-use (2020-2032) (USD Billion)

10.6.9 Rest of Latin America

10.6.9.1 Rest of Latin America Deep Learning Market Estimates and Forecasts, By Solution (2020-2032) (USD Billion)

10.6.9.2 Rest of Latin America Deep Learning Market Estimates and Forecasts, By Application (2020-2032) (USD Billion)

10.6.9.3 Rest of Latin America Deep Learning Market Estimates and Forecasts, By End-use (2020-2032) (USD Billion)

11. Company Profiles

11.1 NVIDIA

11.1.1 Company Overview

11.1.2 Financial

11.1.3 Products/ Services Offered

11.1.4 SWOT Analysis

11.2 Intel

11.2.1 Company Overview

11.2.2 Financial

11.2.3 Products/ Services Offered

11.2.4 SWOT Analysis

11.3 Xilinx

11.3.1 Company Overview

11.3.2 Financial

11.3.3 Products/ Services Offered

11.3.4 SWOT Analysis

11.4 Samsung Electronics

11.4.1 Company Overview

11.4.2 Financial

11.4.3 Products/ Services Offered

11.4.4 SWOT Analysis

11.5 Micron Technology

11.5.1 Company Overview

11.5.2 Financial

11.5.3 Products/ Services Offered

11.5.4 SWOT Analysis

11.6 Qualcomm

11.6.1 Company Overview

11.6.2 Financial

11.6.3 Products/ Services Offered

11.6.4 SWOT Analysis

11.7 IBM

11.7.1 Company Overview

11.7.2 Financial

11.7.3 Products/ Services Offered

11.7.4 SWOT Analysis

11.8 Google

11.8.1 Company Overview

11.8.2 Financial

11.8.3 Products/ Services Offered

11.8.4 SWOT Analysis

11.9 Microsoft

11.9.1 Company Overview

11.9.2 Financial

11.9.3 Products/ Services Offered

11.9.4 SWOT Analysis

11.10 AWS

11.10.1 Company Overview

11.10.2 Financial

11.10.3 Products/ Services Offered

11.10.4 SWOT Analysis

12. Use Cases and Best Practices

13. Conclusio

An accurate research report requires proper strategizing as well as implementation. There are multiple factors involved in the completion of good and accurate research report and selecting the best methodology to compete the research is the toughest part. Since the research reports we provide play a crucial role in any company’s decision-making process, therefore we at SNS Insider always believe that we should choose the best method which gives us results closer to reality. This allows us to reach at a stage wherein we can provide our clients best and accurate investment to output ratio.

Each report that we prepare takes a timeframe of 350-400 business hours for production. Starting from the selection of titles through a couple of in-depth brain storming session to the final QC process before uploading our titles on our website we dedicate around 350 working hours. The titles are selected based on their current market cap and the foreseen CAGR and growth.


The 5 steps process:

Step 1: Secondary Research:

Secondary Research or Desk Research is as the name suggests is a research process wherein, we collect data through the readily available information. In this process we use various paid and unpaid databases which our team has access to and gather data through the same. This includes examining of listed companies’ annual reports, Journals, SEC filling etc. Apart from this our team has access to various associations across the globe across different industries. Lastly, we have exchange relationships with various university as well as individual libraries.

Secondary Research

Step 2: Primary Research

When we talk about primary research, it is a type of study in which the researchers collect relevant data samples directly, rather than relying on previously collected data.  This type of research is focused on gaining content specific facts that can be sued to solve specific problems. Since the collected data is fresh and first hand therefore it makes the study more accurate and genuine.

We at SNS Insider have divided Primary Research into 2 parts.

Part 1 wherein we interview the KOLs of major players as well as the upcoming ones across various geographic regions. This allows us to have their view over the market scenario and acts as an important tool to come closer to the accurate market numbers. As many as 45 paid and unpaid primary interviews are taken from both the demand and supply side of the industry to make sure we land at an accurate judgement and analysis of the market.

This step involves the triangulation of data wherein our team analyses the interview transcripts, online survey responses and observation of on filed participants. The below mentioned chart should give a better understanding of the part 1 of the primary interview.

Primary Research

Part 2: In this part of primary research the data collected via secondary research and the part 1 of the primary research is validated with the interviews from individual consultants and subject matter experts.

Consultants are those set of people who have at least 12 years of experience and expertise within the industry whereas Subject Matter Experts are those with at least 15 years of experience behind their back within the same space. The data with the help of two main processes i.e., FGDs (Focused Group Discussions) and IDs (Individual Discussions). This gives us a 3rd party nonbiased primary view of the market scenario making it a more dependable one while collation of the data pointers.

Step 3: Data Bank Validation

Once all the information is collected via primary and secondary sources, we run that information for data validation. At our intelligence centre our research heads track a lot of information related to the market which includes the quarterly reports, the daily stock prices, and other relevant information. Our data bank server gets updated every fortnight and that is how the information which we collected using our primary and secondary information is revalidated in real time.

Data Bank Validation

Step 4: QA/QC Process

After all the data collection and validation our team does a final level of quality check and quality assurance to get rid of any unwanted or undesired mistakes. This might include but not limited to getting rid of the any typos, duplication of numbers or missing of any important information. The people involved in this process include technical content writers, research heads and graphics people. Once this process is completed the title gets uploader on our platform for our clients to read it.

Step 5: Final QC/QA Process:

This is the last process and comes when the client has ordered the study. In this process a final QA/QC is done before the study is emailed to the client. Since we believe in giving our clients a good experience of our research studies, therefore, to make sure that we do not lack at our end in any way humanly possible we do a final round of quality check and then dispatch the study to the client.

Key Segments:

By Solution

    • Hardware

    • Software

    • Services

By Application

    • Image Recognition

    • Voice Recognition

    • Video Surveillance & Diagnostics

    • Data Mining

By End-use

    • Automotive

    • Aerospace & Defense

    • Healthcare

    • Retail

    • Others

Request for Segment Customization as per your Business Requirement: Segment Customization Request

Regional Coverage:

North America

  • US

  • Canada

  • Mexico

Europe

  • Eastern Europe

    • Poland

    • Romania

    • Hungary

    • Turkey

    • Rest of Eastern Europe

  • Western Europe

    • Germany

    • France

    • UK

    • Italy

    • Spain

    • Netherlands

    • Switzerland

    • Austria

    • Rest of Western Europe

Asia Pacific

  • China

  • India

  • Japan

  • South Korea

  • Vietnam

  • Singapore

  • Australia

  • Rest of Asia Pacific

Middle East & Africa

  • Middle East

    • UAE

    • Egypt

    • Saudi Arabia

    • Qatar

    • Rest of Middle East

  • Africa

    • Nigeria

    • South Africa

    • Rest of Africa

Latin America

  • Brazil

  • Argentina

  • Colombia

  • Rest of Latin America

Request for Country Level Research Report: Country Level Customization Request

Available Customization

With the given market data, SNS Insider offers customization as per the company’s specific needs. The following customization options are available for the report:

  • Detailed Volume Analysis

  • Criss-Cross segment analysis (e.g. Product X Application)

  • Competitive Product Benchmarking

  • Geographic Analysis

  • Additional countries in any of the regions

  • Customized Data Representation

  • Detailed analysis and profiling of additional market players


  •            5000 (33% Discount)


  •            8950 (40% Discount)


  •            3050 (23% Discount)

Start a Conversation

Hi! Click one of our member below to chat on Phone