Get more information on Decentralized Finance (DeFi) Market - Request Sample Report
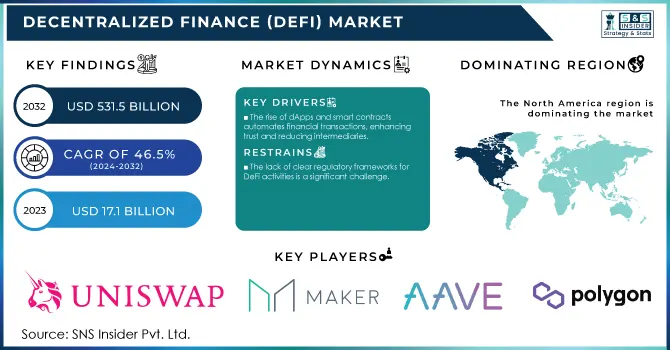
The Decentralized Finance (DeFi) Market Size was valued at USD 17.1 Billion in 2023 and is expected to reach USD 531.5 Billion by 2032, growing at a CAGR of 46.5% over the forecast period 2024-2032.
Increasing global adoption of blockchain technologies, driven by governmental initiatives to promote financial technology innovation is the key factor driving growth of the Decentralized Finance (DeFi) market. In 2023, the U.S. government reported a 65% year-over-year increase in blockchain-related investments and noted the growing trend of decentralized finance applications offering alternatives to traditional financial systems. Additionally, the European Commission has been actively supporting the blockchain ecosystem through the European Blockchain Services Infrastructure (EBSI), which focuses on enhancing digital financial services.
The World Bank also noted that developing countries where traditional banking infrastructure is scarce have been increasingly turning to blockchain-based financial services. For instance, in 2023, over 32% of financial transactions in certain African nations were conducted through DeFi platforms, marking a substantial shift in the financial landscape. The push for digital currencies, including the Digital Euro and Digital Yuan alongside the investment into DeFi infrastructure by global governments has also driven this narrative in building reliable financial systems. This not only serves to increase financial inclusion but also fosters the adoption of decentralized platforms by decreasing dependence on central intermediaries. Governments are increasingly seeing DeFi as a new way to promote economic growth by lowering transaction costs and increasing efficiency. The latest International Monetary Fund (IMF) report stated that global digital assets inclusive of DeFi could comprise upwards of 12% of the global financial system by 2030.
Drivers
The growing adoption of blockchain across various industries is boosting the use of DeFi platforms. Blockchain’s ability to provide transparency, immutability, and security has made it an ideal choice for financial services, pushing the expansion of DeFi solutions.
DeFi offers access to financial services without traditional intermediaries, catering to underserved populations. This democratization of finance, especially in regions with limited banking infrastructure, is driving demand for decentralized solutions.
The rapid development of decentralized applications (dApps) and smart contracts is making financial transactions more automated and efficient, enhancing trust and reducing the need for intermediaries.
Blockchain technology has become increasingly popular, which in turn has led to the rapid expansion of decentralized finance (DeFi) platforms. Blockchain offers a clear, secure, and decentralized infrastructure that does not require any intermediaries such as banks or financial institutions. Moving more towards the decentralization part is very attractive to users who want their assets and financial transactions to be as transparent as possible. The rise of decentralized applications (dApps) and smart contracts highlights this with their ability to radically alter financial systems by automating complex processes without any need for an intermediary. In 2023, the number of decentralized applications (dApps) has recorded an exponential increase with over 4,000 active DeFi projects of Ethereum, which is still the leading blockchain for this ecosystem. This growth is driven by blockchain’s ability to provide tamper-proof, immutable records of financial transactions, increasing trust among users.
In 2023 the total value locked (TVL) of DeFi protocols has grown to over USD 50 billion in 2023, up from just USD 10 billion in 2020, reflecting a belief that blockchain finance will return more benefits to users than conventional finance. Moreover, a Deloitte report found that 76% of global financial institutions are interested in blockchain adoption for improving their functionalities which further corroborates the transformative nature of Blockchain Technology in finance. Prominent examples of blockchain driving DeFi adoption include platforms like Aave and Compound, which leverage Ethereum’s blockchain to enable peer-to-peer lending and borrowing. These platforms provide transparency, eliminate the need for credit checks, and reduce transaction costs, contributing to DeFi’s expanding user base.
Restraints
The lack of clear regulatory frameworks for DeFi activities is a significant challenge.
DeFi platforms are frequently targeted by hackers due to their open-source nature. Smart contract bugs, rug pulls, and other exploits pose significant risks to users, reducing trust and slowing down the growth of the market.
Regulatory uncertainty is one of the largest restraints in the DeFi market and it will highly affect growth and mainstream adoption of DeFi. DeFi operates in a largely unregulated environment, which poses challenges for both users and regulators. The issue of how to classify and regulate decentralized financial systems is still open for governments and financial authorities all over the world. This lack of clear and consistent regulation creates uncertainty for investors, businesses, and developers, leading to hesitation in participating in the market.
Lack of regulation will cause fraud, money laundering, and consumer protection problems. Moreover, stringent regulations could be introduced in the future, potentially limiting the scope of DeFi platforms. The lack of clarity on regulation creates the inability to have institutional players enter with confidence, given that it is unclear what compliance and legal risks they are assuming. Since then, regulatory uncertainty has strangled the full potential of DeFi and preventing it from achieving wider acceptance and integration with traditional financial systems.
By Component
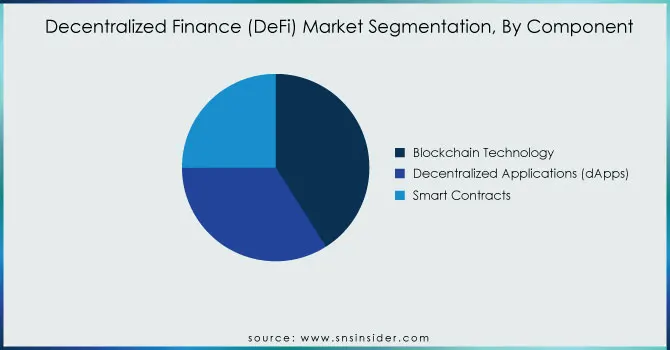
In 2023, the Decentralized Finance (DeFi) market was dominated by the blockchain technology segment with a major revenue share of over 40.0%. The large share of this segment is because it provides a safe, transparent and decentralized infrastructure for DeFi applications to run on. All the decentralized platforms work on blockchain. It is a technology that Bitcoin and many other cryptocurrencies are based on, It makes sure that transactions cannot be modified and are fully trustless without requiring intermediaries like banks or traditional financial institutions. The government helped a lot in creating the environment for blockchain technology to grow, and in 2023 U.S. Department of Commerce has shown that there is a rise of around 42% in blockchain patents filed around the world now as compared to previous years. Such high levels of endorsement and push for blockchain by the government itself have led to widespread adoption across multiple sectors including DeFi. In addition, regulatory institutions like the European Securities and Markets Authority (ESMA) identified blockchain as a means of boosting transparent financial systems, which drives the growth of this segment.
By Application
The data and analytics segment dominated the market in 2023, accounting for 19% of global revenue. The prominence of the data and analytics segment is due to their ability to leverage the excessive amount of transactional data produced by the DeFi platforms, executing advanced risk assessments, fraud detection, and market predictions. This boom has been accelerated by proximity and government-backed initiatives including the EU's Data Act in 2023 that encourage open access to financial data.
On the other side, the payments segment is projected to grow fastest over the forecast period. we expect the payments business to grow quickly due to the increased need for seamless cross-border payments at lower cost and higher speed with DeFi platforms than traditional ones. In fact, we had seen 60% low cost of cross-border payment due to the DeFi solution in the year 2023 according to the Bank for International Settlements (BIS) which surely makes this a very attractive application segment for global commerce.
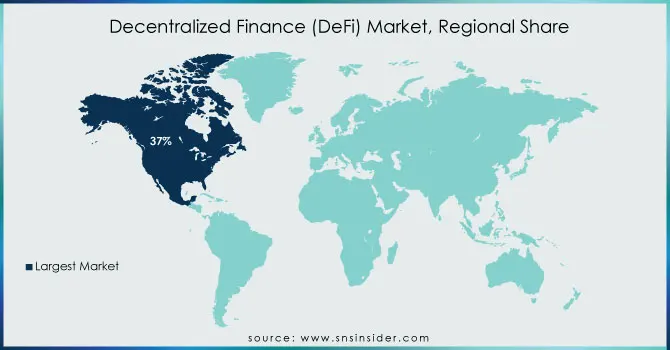
North America held a 37% revenue share of the world DeFi market in 2023. With its improved regulatory frameworks, high blockchain technology investment rates, and robust startup ecosystem, the United States has been one of the global leaders in DeFi adoption. As per the U.S. Department of Treasury, more than $15 billion has been invested into DeFi start-ups in 2023 so far, consolidating the dominance of the region. In addition, the regulating DeFi space by the Securities and Exchange Commission (SEC) adds some more clarity and can potentially attract institutional investors into the market. Regulatory bodies in North America are working with industry players to create a framework that fosters innovation while ensuring financial stability. The U.S. is a key player in the DeFi market, supported by a robust ecosystem of blockchain engineers, investors, and entrepreneurs. Its advanced technology infrastructure and significant investment are driving the rapid growth of DeFi applications. Organizations like the CFTC aim to balance innovation with consumer protection by collaborating with industry participants. As a major hub for DeFi, the U.S. attracts global interest and investment. For example, in April 2024, Repple announced plans to introduce a Stablecoin fully backed by U.S. dollar deposits and pegged to the dollar on a 1:1 basis.
On the other hand, the Asia-Pacific (APAC) region will register the fastest CAGR during the forecast period. This growth is particularly driven by Singapore, Japan, and South Korea. The growth was a result of various programs launched by the Monetary Authority of Singapore (MAS), including one such blockchain innovation program initiated in early 2023 to promote scalable DeFi applications. This rapid growth is also propelled by the support of blockchain technology in China, as well as the growing volume of venture capital investments in decentralized platforms.
Get Customized Report as per your Business Requirement - Request For Customized Report
The U.S. Federal Reserve recently announced plans for a pilot program to incorporate blockchain-based payment systems into the traditional banking sector in Aug 2023 This represents the next crucial link between DeFi and traditional financial players.
June 2023: The European Central Bank (ECB) released a report discussing the relevance of blockchain technology in financial services. DeFi was highlighted in the report for its potential to lower transaction costs by approximately 20% across the European Union over the next five years.
April 2023: The Monetary Authority of Singapore (MAS) introduced the "DeFi Sandbox," a regulatory framework that allows blockchain startups to test their decentralized applications in a controlled environment. This initiative has attracted major global players to set up operations in Singapore, contributing to the region’s rapid growth in the DeFi market.
Service Providers / Manufacturers:
Uniswap Labs (Uniswap v3, Auto Router)
MakerDAO (Dai, Oasis)
Aave (Aave Protocol, Aave Arc)
Compound Labs (Compound Protocol, Compound Treasury)
Curve Finance (Curve Pool, CurveDAO)
SushiSwap (SushiSwap Exchange, BentoBox)
Chainlink Labs (Chainlink Price Feeds, Chainlink VRF)
Yearn Finance (Yearn Vaults, Yearn Strategies)
Balancer Labs (Balancer Pool, Balancer Smart Pools)
Polygon (Polygon zkEVM, Polygon POS)
Tesla, Inc.
Microsoft Corporation
Visa, Inc.
Goldman Sachs
PayPal Holdings, Inc.
Meta Platforms, Inc.
Shopify
Amazon Web Services (AWS)
JPMorgan Chase & Co.
Apple Inc.
Report Attributes | Details |
---|---|
Market Size in 2023 | USD 17.1 Billion |
Market Size by 2032 | USD 531.9 Billion |
CAGR | CAGR of 46.5% From 2024 to 2032 |
Base Year | 2023 |
Forecast Period | 2024-2032 |
Historical Data | 2020-2022 |
Report Scope & Coverage | Market Size, Segments Analysis, Competitive Landscape, Regional Analysis, DROC & SWOT Analysis, Forecast Outlook |
Key Segments | • By Component (Blockchain Technology, Decentralized Applications (dApps), Smart Contracts) • By Application (Assets Tokenization, Compliance & Identity, Marketplaces & Liquidity, Payments, Data & Analytics, Decentralized Exchanges, Prediction Industry, Stablecoins, Others) |
Regional Analysis/Coverage | North America (US, Canada, Mexico), Europe (Eastern Europe [Poland, Romania, Hungary, Turkey, Rest of Eastern Europe] Western Europe] Germany, France, UK, Italy, Spain, Netherlands, Switzerland, Austria, Rest of Western Europe]), Asia Pacific (China, India, Japan, South Korea, Vietnam, Singapore, Australia, Rest of Asia Pacific), Middle East & Africa (Middle East [UAE, Egypt, Saudi Arabia, Qatar, Rest of Middle East], Africa [Nigeria, South Africa, Rest of Africa], Latin America (Brazil, Argentina, Colombia, Rest of Latin America) |
Company Profiles | Uniswap Labs, MakerDAO, Aave, Compound Labs, Curve Finance, SushiSwap, Chainlink Labs, Yearn Finance, Balancer Labs, Polygon |
Key Drivers | • The growing adoption of blockchain across various industries is boosting the use of DeFi platforms. Blockchain’s ability to provide transparency, immutability, and security has made it an ideal choice for financial services, pushing the expansion of DeFi solutions. • DeFi offers access to financial services without traditional intermediaries, catering to underserved populations. This democratization of finance, especially in regions with limited banking infrastructure, is driving demand for decentralized solutions. |
Restraints | • The lack of clear regulatory frameworks for DeFi activities is a significant challenge. • DeFi platforms are frequently targeted by hackers due to their open-source nature. Smart contract bugs, rug pulls, and other exploits pose significant risks to users, reducing trust and slowing down the growth of the market. |
Ans. The projected market size for the Decentralized Finance (DeFi) Market is USD 531.9 billion by 2032.
Ans: The North American region dominated the Decentralized Finance (DeFi) Market in 2023.
Ans. The CAGR of the Decentralized Finance (DeFi) Market is 46.5% During the forecast period of 2024-2032.
And: The blockchain technology segment dominated the Decentralized Finance (DeFi) Market in 2023.
Ans: The key players in the Decentralized Finance (DeFi) market are SES S.A., Viasat Inc., Intelsat, Hughes Network Systems, OneWeb, SpaceX, Thales Alenia Space, Lockheed Martin Corporation, Telesat, Eutelsat Communications and others
Table of Contents
1. Introduction
1.1 Market Definition
1.2 Scope (Inclusion and Exclusions)
1.3 Research Assumptions
2. Executive Summary
2.1 Market Overview
2.2 Regional Synopsis
2.3 Competitive Summary
3. Research Methodology
3.1 Top-Down Approach
3.2 Bottom-up Approach
3.3. Data Validation
3.4 Primary Interviews
4. Market Dynamics Impact Analysis
4.1 Market Driving Factors Analysis
4.1.2 Drivers
4.1.2 Restraints
4.1.3 Opportunities
4.1.4 Challenges
4.2 PESTLE Analysis
4.3 Porter’s Five Forces Model
5. Statistical Insights and Trends Reporting
5.1 Adoption Rates of Emerging Technologies
5.2 Network Infrastructure Expansion, by Region
5.3 Cybersecurity Incidents, by Region (2020-2023)
5.4 Cloud Services Usage, by Region
6. Competitive Landscape
6.1 List of Major Companies, By Region
6.2 Market Share Analysis, By Region
6.3 Product Benchmarking
6.3.1 Product specifications and features
6.3.2 Pricing
6.4 Strategic Initiatives
6.4.1 Marketing and promotional activities
6.4.2 Distribution and supply chain strategies
6.4.3 Expansion plans and new product launches
6.4.4 Strategic partnerships and collaborations
6.5 Technological Advancements
6.6 Market Positioning and Branding
7. Decentralized Finance (DeFi) Market Segmentation, By Component
7.1 Chapter Overview
7.2 Blockchain Technology
7.2.1 Blockchain Technology Market Trends Analysis (2020-2032)
7.2.2 Blockchain Technology Market Size Estimates and Forecasts to 2032 (USD Billion)
7.3 Decentralized Applications (dApps)
7.3.1 Decentralized Applications (dApps) Market Trends Analysis (2020-2032)
7.3.2 Decentralized Applications (dApps) Market Size Estimates and Forecasts to 2032 (USD Billion)
7.4 Smart Contracts
7.4.1 Smart Contracts Market Trends Analysis (2020-2032)
7.4.2 Smart Contracts Market Size Estimates and Forecasts to 2032 (USD Billion)
8. Decentralized Finance (DeFi) Market Segmentation, By Application
8.1 Chapter Overview
8.2 Assets Tokenization
8.2.1 Assets Tokenization Market Trends Analysis (2020-2032)
8.2.2 Assets Tokenization Market Size Estimates and Forecasts to 2032 (USD Billion)
8.3 Compliance & Identity
8.3.1 Compliance & Identity Market Trends Analysis (2020-2032)
8.3.2 Compliance & Identity Market Size Estimates and Forecasts to 2032 (USD Billion)
8.4 Marketplaces & Liquidity
8.4.1 Marketplaces & Liquidity Market Trends Analysis (2020-2032)
8.4.2 Marketplaces & Liquidity Market Size Estimates and Forecasts to 2032 (USD Billion)
8.5 Payments
8.5.1 Payments Market Trends Analysis (2020-2032)
8.5.2 Payments Market Size Estimates and Forecasts to 2032 (USD Billion)
8.6 Data & Analytics
8.6.1 Data & Analytics Market Trends Analysis (2020-2032)
8.6.2 Data & Analytics Market Size Estimates and Forecasts to 2032 (USD Billion)
8.7 Decentralized Exchanges
8.7.1 Decentralized Exchanges Market Trends Analysis (2020-2032)
8.7.2 Decentralized Exchanges Market Size Estimates and Forecasts to 2032 (USD Billion)
8.8 Prediction Industry
8.8.1 Prediction Industry Market Trends Analysis (2020-2032)
8.8.2 Prediction Industry Market Size Estimates and Forecasts to 2032 (USD Billion)
8.9 Stablecoins
8.9.1 Stablecoins Market Trends Analysis (2020-2032)
8.9.2 Stablecoins Market Size Estimates and Forecasts to 2032 (USD Billion)
8.10 Others
8.10.1 Others Market Trends Analysis (2020-2032)
8.10.2 Others Market Size Estimates and Forecasts to 2032 (USD Billion)
9. Regional Analysis
9.1 Chapter Overview
9.2 North America
9.2.1 Trends Analysis
9.2.2 North America Decentralized Finance (DeFi) Market Estimates and Forecasts, by Country (2020-2032) (USD Billion)
9.2.3 North America Decentralized Finance (DeFi) Market Estimates and Forecasts, By Component (2020-2032) (USD Billion)
9.2.4 North America Decentralized Finance (DeFi) Market Estimates and Forecasts, By Application (2020-2032) (USD Billion)
9.2.5 USA
9.2.5.1 USA Decentralized Finance (DeFi) Market Estimates and Forecasts, By Component (2020-2032) (USD Billion)
9.2.5.2 USA Decentralized Finance (DeFi) Market Estimates and Forecasts, By Application (2020-2032) (USD Billion)
9.2.6 Canada
9.2.6.1 Canada Decentralized Finance (DeFi) Market Estimates and Forecasts, By Component (2020-2032) (USD Billion)
9.2.6.2 Canada Decentralized Finance (DeFi) Market Estimates and Forecasts, By Application (2020-2032) (USD Billion)
9.2.7 Mexico
9.2.7.1 Mexico Decentralized Finance (DeFi) Market Estimates and Forecasts, By Component (2020-2032) (USD Billion)
9.2.7.2 Mexico Decentralized Finance (DeFi) Market Estimates and Forecasts, By Application (2020-2032) (USD Billion)
9.3 Europe
9.3.1 Eastern Europe
9.3.1.1 Trends Analysis
9.3.1.2 Eastern Europe Decentralized Finance (DeFi) Market Estimates and Forecasts, by Country (2020-2032) (USD Billion)
9.3.1.3 Eastern Europe Decentralized Finance (DeFi) Market Estimates and Forecasts, By Component (2020-2032) (USD Billion)
9.3.1.4 Eastern Europe Decentralized Finance (DeFi) Market Estimates and Forecasts, By Application (2020-2032) (USD Billion)
9.3.1.5 Poland
9.3.1.5.1 Poland Decentralized Finance (DeFi) Market Estimates and Forecasts, By Component (2020-2032) (USD Billion)
9.3.1.5.2 Poland Decentralized Finance (DeFi) Market Estimates and Forecasts, By Application (2020-2032) (USD Billion)
9.3.1.6 Romania
9.3.1.6.1 Romania Decentralized Finance (DeFi) Market Estimates and Forecasts, By Component (2020-2032) (USD Billion)
9.3.1.6.2 Romania Decentralized Finance (DeFi) Market Estimates and Forecasts, By Application (2020-2032) (USD Billion)
9.3.1.7 Hungary
9.3.1.7.1 Hungary Decentralized Finance (DeFi) Market Estimates and Forecasts, By Component (2020-2032) (USD Billion)
9.3.1.7.2 Hungary Decentralized Finance (DeFi) Market Estimates and Forecasts, By Application (2020-2032) (USD Billion)
9.3.1.8 Turkey
9.3.1.8.1 Turkey Decentralized Finance (DeFi) Market Estimates and Forecasts, By Component (2020-2032) (USD Billion)
9.3.1.8.2 Turkey Decentralized Finance (DeFi) Market Estimates and Forecasts, By Application (2020-2032) (USD Billion)
9.3.1.9 Rest of Eastern Europe
9.3.1.9.1 Rest of Eastern Europe Decentralized Finance (DeFi) Market Estimates and Forecasts, By Component (2020-2032) (USD Billion)
9.3.1.9.2 Rest of Eastern Europe Decentralized Finance (DeFi) Market Estimates and Forecasts, By Application (2020-2032) (USD Billion)
9.3.2 Western Europe
9.3.2.1 Trends Analysis
9.3.2.2 Western Europe Decentralized Finance (DeFi) Market Estimates and Forecasts, by Country (2020-2032) (USD Billion)
9.3.2.3 Western Europe Decentralized Finance (DeFi) Market Estimates and Forecasts, By Component (2020-2032) (USD Billion)
9.3.2.4 Western Europe Decentralized Finance (DeFi) Market Estimates and Forecasts, By Application (2020-2032) (USD Billion)
9.3.2.5 Germany
9.3.2.5.1 Germany Decentralized Finance (DeFi) Market Estimates and Forecasts, By Component (2020-2032) (USD Billion)
9.3.2.5.2 Germany Decentralized Finance (DeFi) Market Estimates and Forecasts, By Application (2020-2032) (USD Billion)
9.3.2.6 France
9.3.2.6.1 France Decentralized Finance (DeFi) Market Estimates and Forecasts, By Component (2020-2032) (USD Billion)
9.3.2.6.2 France Decentralized Finance (DeFi) Market Estimates and Forecasts, By Application (2020-2032) (USD Billion)
9.3.2.7 UK
9.3.2.7.1 UK Decentralized Finance (DeFi) Market Estimates and Forecasts, By Component (2020-2032) (USD Billion)
9.3.2.7.2 UK Decentralized Finance (DeFi) Market Estimates and Forecasts, By Application (2020-2032) (USD Billion)
9.3.2.8 Italy
9.3.2.8.1 Italy Decentralized Finance (DeFi) Market Estimates and Forecasts, By Component (2020-2032) (USD Billion)
9.3.2.8.2 Italy Decentralized Finance (DeFi) Market Estimates and Forecasts, By Application (2020-2032) (USD Billion)
9.3.2.9 Spain
9.3.2.9.1 Spain Decentralized Finance (DeFi) Market Estimates and Forecasts, By Component (2020-2032) (USD Billion)
9.3.2.9.2 Spain Decentralized Finance (DeFi) Market Estimates and Forecasts, By Application (2020-2032) (USD Billion)
9.3.2.10 Netherlands
9.3.2.10.1 Netherlands Decentralized Finance (DeFi) Market Estimates and Forecasts, By Component (2020-2032) (USD Billion)
9.3.2.10.2 Netherlands Decentralized Finance (DeFi) Market Estimates and Forecasts, By Application (2020-2032) (USD Billion)
9.3.2.11 Switzerland
9.3.2.11.1 Switzerland Decentralized Finance (DeFi) Market Estimates and Forecasts, By Component (2020-2032) (USD Billion)
9.3.2.11.2 Switzerland Decentralized Finance (DeFi) Market Estimates and Forecasts, By Application (2020-2032) (USD Billion)
9.3.2.12 Austria
9.3.2.12.1 Austria Decentralized Finance (DeFi) Market Estimates and Forecasts, By Component (2020-2032) (USD Billion)
9.3.2.12.2 Austria Decentralized Finance (DeFi) Market Estimates and Forecasts, By Application (2020-2032) (USD Billion)
9.3.2.13 Rest of Western Europe
9.3.2.13.1 Rest of Western Europe Decentralized Finance (DeFi) Market Estimates and Forecasts, By Component (2020-2032) (USD Billion)
9.3.2.13.2 Rest of Western Europe Decentralized Finance (DeFi) Market Estimates and Forecasts, By Application (2020-2032) (USD Billion)
9.4 Asia Pacific
9.4.1 Trends Analysis
9.4.2 Asia Pacific Decentralized Finance (DeFi) Market Estimates and Forecasts, by Country (2020-2032) (USD Billion)
9.4.3 Asia Pacific Decentralized Finance (DeFi) Market Estimates and Forecasts, By Component (2020-2032) (USD Billion)
9.4.4 Asia Pacific Decentralized Finance (DeFi) Market Estimates and Forecasts, By Application (2020-2032) (USD Billion)
9.4.5 China
9.4.5.1 China Decentralized Finance (DeFi) Market Estimates and Forecasts, By Component (2020-2032) (USD Billion)
9.4.5.2 China Decentralized Finance (DeFi) Market Estimates and Forecasts, By Application (2020-2032) (USD Billion)
9.4.6 India
9.4.5.1 India Decentralized Finance (DeFi) Market Estimates and Forecasts, By Component (2020-2032) (USD Billion)
9.4.5.2 India Decentralized Finance (DeFi) Market Estimates and Forecasts, By Application (2020-2032) (USD Billion)
9.4.5 Japan
9.4.5.1 Japan Decentralized Finance (DeFi) Market Estimates and Forecasts, By Component (2020-2032) (USD Billion)
9.4.5.2 Japan Decentralized Finance (DeFi) Market Estimates and Forecasts, By Application (2020-2032) (USD Billion)
9.4.6 South Korea
9.4.6.1 South Korea Decentralized Finance (DeFi) Market Estimates and Forecasts, By Component (2020-2032) (USD Billion)
9.4.6.2 South Korea Decentralized Finance (DeFi) Market Estimates and Forecasts, By Application (2020-2032) (USD Billion)
9.4.7 Vietnam
9.4.7.1 Vietnam Decentralized Finance (DeFi) Market Estimates and Forecasts, By Component (2020-2032) (USD Billion)
9.2.7.2 Vietnam Decentralized Finance (DeFi) Market Estimates and Forecasts, By Application (2020-2032) (USD Billion)
9.4.8 Singapore
9.4.8.1 Singapore Decentralized Finance (DeFi) Market Estimates and Forecasts, By Component (2020-2032) (USD Billion)
9.4.8.2 Singapore Decentralized Finance (DeFi) Market Estimates and Forecasts, By Application (2020-2032) (USD Billion)
9.4.9 Australia
9.4.9.1 Australia Decentralized Finance (DeFi) Market Estimates and Forecasts, By Component (2020-2032) (USD Billion)
9.4.9.2 Australia Decentralized Finance (DeFi) Market Estimates and Forecasts, By Application (2020-2032) (USD Billion)
9.4.10 Rest of Asia Pacific
9.4.10.1 Rest of Asia Pacific Decentralized Finance (DeFi) Market Estimates and Forecasts, By Component (2020-2032) (USD Billion)
9.4.10.2 Rest of Asia Pacific Decentralized Finance (DeFi) Market Estimates and Forecasts, By Application (2020-2032) (USD Billion)
9.5 Middle East and Africa
9.5.1 Middle East
9.5.1.1 Trends Analysis
9.5.1.2 Middle East Decentralized Finance (DeFi) Market Estimates and Forecasts, by Country (2020-2032) (USD Billion)
9.5.1.3 Middle East Decentralized Finance (DeFi) Market Estimates and Forecasts, By Component (2020-2032) (USD Billion)
9.5.1.4 Middle East Decentralized Finance (DeFi) Market Estimates and Forecasts, By Application (2020-2032) (USD Billion)
9.5.1.5 UAE
9.5.1.5.1 UAE Decentralized Finance (DeFi) Market Estimates and Forecasts, By Component (2020-2032) (USD Billion)
9.5.1.5.2 UAE Decentralized Finance (DeFi) Market Estimates and Forecasts, By Application (2020-2032) (USD Billion)
9.5.1.6 Egypt
9.5.1.6.1 Egypt Decentralized Finance (DeFi) Market Estimates and Forecasts, By Component (2020-2032) (USD Billion)
9.5.1.6.2 Egypt Decentralized Finance (DeFi) Market Estimates and Forecasts, By Application (2020-2032) (USD Billion)
9.5.1.7 Saudi Arabia
9.5.1.7.1 Saudi Arabia Decentralized Finance (DeFi) Market Estimates and Forecasts, By Component (2020-2032) (USD Billion)
9.5.1.7.2 Saudi Arabia Decentralized Finance (DeFi) Market Estimates and Forecasts, By Application (2020-2032) (USD Billion)
9.5.1.8 Qatar
9.5.1.8.1 Qatar Decentralized Finance (DeFi) Market Estimates and Forecasts, By Component (2020-2032) (USD Billion)
9.5.1.8.2 Qatar Decentralized Finance (DeFi) Market Estimates and Forecasts, By Application (2020-2032) (USD Billion)
9.5.1.9 Rest of Middle East
9.5.1.9.1 Rest of Middle East Decentralized Finance (DeFi) Market Estimates and Forecasts, By Component (2020-2032) (USD Billion)
9.5.1.9.2 Rest of Middle East Decentralized Finance (DeFi) Market Estimates and Forecasts, By Application (2020-2032) (USD Billion)
9.5.2 Africa
9.5.2.1 Trends Analysis
9.5.2.2 Africa Decentralized Finance (DeFi) Market Estimates and Forecasts, by Country (2020-2032) (USD Billion)
9.5.2.3 Africa Decentralized Finance (DeFi) Market Estimates and Forecasts, By Component (2020-2032) (USD Billion)
9.5.2.4 Africa Decentralized Finance (DeFi) Market Estimates and Forecasts, By Application (2020-2032) (USD Billion)
9.5.2.5 South Africa
9.5.2.5.1 South Africa Decentralized Finance (DeFi) Market Estimates and Forecasts, By Component (2020-2032) (USD Billion)
9.5.2.5.2 South Africa Decentralized Finance (DeFi) Market Estimates and Forecasts, By Application (2020-2032) (USD Billion)
9.5.2.6 Nigeria
9.5.2.6.1 Nigeria Decentralized Finance (DeFi) Market Estimates and Forecasts, By Component (2020-2032) (USD Billion)
9.5.2.6.2 Nigeria Decentralized Finance (DeFi) Market Estimates and Forecasts, By Application (2020-2032) (USD Billion)
9.5.2.7 Rest of Africa
9.5.2.7.1 Rest of Africa Decentralized Finance (DeFi) Market Estimates and Forecasts, By Component (2020-2032) (USD Billion)
9.5.2.7.2 Rest of Africa Decentralized Finance (DeFi) Market Estimates and Forecasts, By Application (2020-2032) (USD Billion)
9.6 Latin America
9.6.1 Trends Analysis
9.6.2 Latin America Decentralized Finance (DeFi) Market Estimates and Forecasts, by Country (2020-2032) (USD Billion)
9.6.3 Latin America Decentralized Finance (DeFi) Market Estimates and Forecasts, By Component (2020-2032) (USD Billion)
9.6.4 Latin America Decentralized Finance (DeFi) Market Estimates and Forecasts, By Application (2020-2032) (USD Billion)
9.6.5 Brazil
9.6.5.1 Brazil Decentralized Finance (DeFi) Market Estimates and Forecasts, By Component (2020-2032) (USD Billion)
9.6.5.2 Brazil Decentralized Finance (DeFi) Market Estimates and Forecasts, By Application (2020-2032) (USD Billion)
9.6.6 Argentina
9.6.6.1 Argentina Decentralized Finance (DeFi) Market Estimates and Forecasts, By Component (2020-2032) (USD Billion)
9.6.6.2 Argentina Decentralized Finance (DeFi) Market Estimates and Forecasts, By Application (2020-2032) (USD Billion)
9.6.7 Colombia
9.6.7.1 Colombia Decentralized Finance (DeFi) Market Estimates and Forecasts, By Component (2020-2032) (USD Billion)
9.6.7.2 Colombia Decentralized Finance (DeFi) Market Estimates and Forecasts, By Application (2020-2032) (USD Billion)
9.6.8 Rest of Latin America
9.6.8.1 Rest of Latin America Decentralized Finance (DeFi) Market Estimates and Forecasts, By Component (2020-2032) (USD Billion)
9.6.8.2 Rest of Latin America Decentralized Finance (DeFi) Market Estimates and Forecasts, By Application (2020-2032) (USD Billion)
10. Company Profiles
10.1 Uniswap Labs.
10.1.1 Company Overview
10.1.2 Financial
10.1.3 Products/ Services Offered
110.1.4 SWOT Analysis
10.2 MakerDAO
10.2.1 Company Overview
10.2.2 Financial
10.2.3 Products/ Services Offered
10.2.4 SWOT Analysis
10.3 Aave
10.3.1 Company Overview
10.3.2 Financial
10.3.3 Products/ Services Offered
10.3.4 SWOT Analysis
10.4 Compound Labs
10.4.1 Company Overview
10.4.2 Financial
10.4.3 Products/ Services Offered
10.4.4 SWOT Analysis
10.5 Curve Finance
10.5.1 Company Overview
10.5.2 Financial
10.5.3 Products/ Services Offered
10.5.4 SWOT Analysis
10.6 SushiSwap
10.6.1 Company Overview
10.6.2 Financial
10.6.3 Products/ Services Offered
10.6.4 SWOT Analysis
10.7 Chainlink Labs
10.7.1 Company Overview
10.7.2 Financial
10.7.3 Products/ Services Offered
10.7.4 SWOT Analysis
10.8 Yearn Finance
10.8.1 Company Overview
10.8.2 Financial
10.8.3 Products/ Services Offered
10.8.4 SWOT Analysis
10.9 Balancer Labs
10.9.1 Company Overview
10.9.2 Financial
10.9.3 Products/ Services Offered
10.9.4 SWOT Analysis
10.10 AC Polygon
10.9.1 Company Overview
10.9.2 Financial
10.9.3 Products/ Services Offered
10.9.4 SWOT Analysis
11. Use Cases and Best Practices
12. Conclusion
An accurate research report requires proper strategizing as well as implementation. There are multiple factors involved in the completion of good and accurate research report and selecting the best methodology to compete the research is the toughest part. Since the research reports we provide play a crucial role in any company’s decision-making process, therefore we at SNS Insider always believe that we should choose the best method which gives us results closer to reality. This allows us to reach at a stage wherein we can provide our clients best and accurate investment to output ratio.
Each report that we prepare takes a timeframe of 350-400 business hours for production. Starting from the selection of titles through a couple of in-depth brain storming session to the final QC process before uploading our titles on our website we dedicate around 350 working hours. The titles are selected based on their current market cap and the foreseen CAGR and growth.
The 5 steps process:
Step 1: Secondary Research:
Secondary Research or Desk Research is as the name suggests is a research process wherein, we collect data through the readily available information. In this process we use various paid and unpaid databases which our team has access to and gather data through the same. This includes examining of listed companies’ annual reports, Journals, SEC filling etc. Apart from this our team has access to various associations across the globe across different industries. Lastly, we have exchange relationships with various university as well as individual libraries.
Step 2: Primary Research
When we talk about primary research, it is a type of study in which the researchers collect relevant data samples directly, rather than relying on previously collected data. This type of research is focused on gaining content specific facts that can be sued to solve specific problems. Since the collected data is fresh and first hand therefore it makes the study more accurate and genuine.
We at SNS Insider have divided Primary Research into 2 parts.
Part 1 wherein we interview the KOLs of major players as well as the upcoming ones across various geographic regions. This allows us to have their view over the market scenario and acts as an important tool to come closer to the accurate market numbers. As many as 45 paid and unpaid primary interviews are taken from both the demand and supply side of the industry to make sure we land at an accurate judgement and analysis of the market.
This step involves the triangulation of data wherein our team analyses the interview transcripts, online survey responses and observation of on filed participants. The below mentioned chart should give a better understanding of the part 1 of the primary interview.
Part 2: In this part of primary research the data collected via secondary research and the part 1 of the primary research is validated with the interviews from individual consultants and subject matter experts.
Consultants are those set of people who have at least 12 years of experience and expertise within the industry whereas Subject Matter Experts are those with at least 15 years of experience behind their back within the same space. The data with the help of two main processes i.e., FGDs (Focused Group Discussions) and IDs (Individual Discussions). This gives us a 3rd party nonbiased primary view of the market scenario making it a more dependable one while collation of the data pointers.
Step 3: Data Bank Validation
Once all the information is collected via primary and secondary sources, we run that information for data validation. At our intelligence centre our research heads track a lot of information related to the market which includes the quarterly reports, the daily stock prices, and other relevant information. Our data bank server gets updated every fortnight and that is how the information which we collected using our primary and secondary information is revalidated in real time.
Step 4: QA/QC Process
After all the data collection and validation our team does a final level of quality check and quality assurance to get rid of any unwanted or undesired mistakes. This might include but not limited to getting rid of the any typos, duplication of numbers or missing of any important information. The people involved in this process include technical content writers, research heads and graphics people. Once this process is completed the title gets uploader on our platform for our clients to read it.
Step 5: Final QC/QA Process:
This is the last process and comes when the client has ordered the study. In this process a final QA/QC is done before the study is emailed to the client. Since we believe in giving our clients a good experience of our research studies, therefore, to make sure that we do not lack at our end in any way humanly possible we do a final round of quality check and then dispatch the study to the client.
Key Segments:
By Component
Blockchain Technology
Decentralized Applications (dApps)
Smart Contracts
By Application
Assets Tokenization
Compliance & Identity
Marketplaces & Liquidity
Payments
Data & Analytics
Decentralized Exchanges
Prediction Industry
Stablecoins
Others
Request for Segment Customization as per your Business Requirement: Segment Customization Request
REGIONAL COVERAGE:
North America
US
Canada
Mexico
Europe
Eastern Europe
Poland
Romania
Hungary
Turkey
Rest of Eastern Europe
Western Europe
Germany
France
UK
Italy
Spain
Netherlands
Switzerland
Austria
Rest of Western Europe
Asia Pacific
China
India
Japan
South Korea
Vietnam
Singapore
Australia
Rest of Asia Pacific
Middle East & Africa
Middle East
UAE
Egypt
Saudi Arabia
Qatar
Rest of the Middle East
Africa
Nigeria
South Africa
Rest of Africa
Latin America
Brazil
Argentina
Colombia
Rest of Latin America
Request for Country Level Research Report: Country Level Customization Request
Available Customization
With the given market data, SNS Insider offers customization as per the company’s specific needs. The following customization options are available for the report:
Product Analysis
Criss-Cross segment analysis (e.g. Product X Application)
Product Matrix which gives a detailed comparison of product portfolio of each company
Geographic Analysis
Additional countries in any of the regions
Company Information
Detailed analysis and profiling of additional market players (Up to five)
The Wireless Microphone Market size was valued at USD 1.7 billion in 2023 and is expected to grow to USD 4.45 billion by 2031 and grow at a CAGR of 11.3% over the forecast period of 2024-2032.
Email Marketing Software Market size was valued at USD 1.43 billion in 2023 and is expected to grow to USD 3.83 billion by 2032 and grow at a CAGR of 11.6% over the forecast period of 2024-2032.
The Enterprise Metadata Management (EMM) Market size was valued at USD 4.07 Bn in 2023 and is expected to reach USD 15.9 Bn by 2032 and grow at a CAGR of 16.4% over the forecast period 2024-2032.
The Smart Home Market size was valued at USD 105 Billion in 2023 and is expected to grow to USD 550 Billion By 2032 and grow at a CAGR of 20.2% over the forecast period of 2024-2032.
The ATM Market size was valued at USD 23.52 Billion in 2023 and is expected to reach USD 34.38 Billion by 2032 and its growing with a CAGR of 4.31% over the forecast period 2024-2032.
Mobile application market size was valued at USD 235 Billion in 2023. It is expected to reach USD 783.3 Billion by 2032 and grow at a CAGR of 14.33% over the forecast period of 2024-2032.
Hi! Click one of our member below to chat on Phone