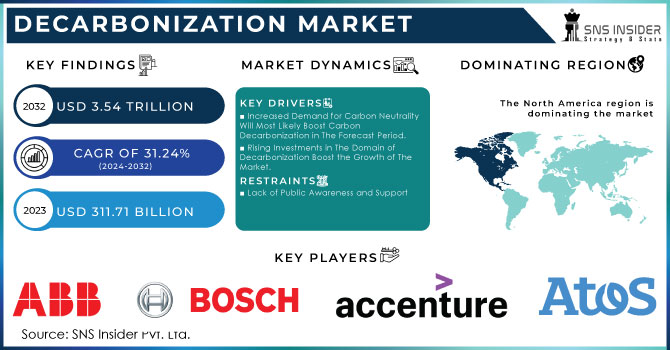
The Decarbonization Market was valued at USD 1906.1 Billion in 2023 and is expected to reach USD 5644.2 Billion by 2032, growing at a CAGR of 12.84% from 2024-2032. The adoption of decarbonization technologies like carbon capture, green hydrogen, and sustainable fuels is rising, driven by regulations and corporate sustainability goals. Renewable energy infrastructure is expanding globally, with investments in solar, wind, and grid modernization, while emission reductions vary by region based on carbon policies. Green energy consumption is increasing, supported by government incentives, with emerging trends in AI-driven energy optimization and blockchain for carbon credit trading.
Get More Information on Decarbonization Market - Request Sample Report
Market Dynamics
Drivers
Decarbonizing is being driven rapidly by governments everywhere, using a mix of stringent carbon emission regulations, carbon pricing, and emission trading systems. Investment in renewables and sustainable technologies continue to gain momentum as a result of policies such as the EU Green Deal, the U.S. Inflation Reduction Act, and China's carbon neutrality targets. Moreover, net-zero pledges by corporations will drive an uptake of carbon capture, green hydrogen, and electrification solutions across industries. Furthermore, the rising need for sustainability reporting and ESG compliance drives businesses to embed decarbonization strategies which indirectly impacts the market growth.
Restraints
Although interest in decarbonization technologies is expanding, their adoption is impeded by significant capital costs, with the high upfront price tags of carbon capture systems, green hydrogen production, and renewable energy storage discouraging many industries. Moreover, slow scaling is due to insufficient infrastructure for energy transmission, hydrogen transport, and carbon sequestration. Most developing economies face challenges in financing and a lack of institutional frameworks to support decarbonization efforts, thus limiting their transition to low-carbon solutions. The cost-effectiveness of utilizing decarbonization technologies is a critical challenge in the absence of significant government support and private-sector financing.
Opportunities
New clean energy technology, including next-gen batteries, AI-optimized energy efficiency, and blockchain-based carbon credit trading, has been progressing swiftly enough to create major new opportunities in the decarbonization market. Green hydrogen, biofuels, and direct air capture technologies are maturing into globally commercializable solutions, generating both public and private investments. Moreover, the growing inter-industry collaborations and partnerships between research institutes and governments are accelerating progress in low-carbon technologies. With digital tools facilitating emissions monitoring in real-time and smart grid management, new markets are materializing as companies emerge with innovative solutions that will help them decarbonize faster and at reduced costs.
Challenges
Decarbonizing across different industries and geographies is still a major challenge because scaling the energy transition from fossil fuels to renewables is a complex process. The discontinuous character of solar and wind power and the heightened demand for effective storage are available through both technical and economic messages. Geopolitical considerations, policy uncertainties, and volatility in carbon credit pricing only make long-term investments in decarbonization more uncertain. This stakeholder-level market coordination is arguably one of the largest hurdles to overcome for a just energy transition in the context of balancing economic growth and environmental impact.
Need any customization research on Decarbonization Market - Enquiry Now
Segment Analysis
By Technology
In 2023, the renewable energy technologies segment dominated the market and accounted for a significant revenue share 2023, Due to the stringent government regulations concerning emissions, renewable energy plants in the region have increased. The country is experiencing a transition in the energy sectors — a shift from coal-based power generation to gas-based and renewable power.
The electric vehicle segment is projected to maintain a considerable CAGR throughout the forecast period. Tight regulations on vehicle emissions have fueled the demand for electric vehicles. On-road emissions are lower for electric vehicles than for other conventional vehicles.
By Service
The sustainable transportation services segment dominated the market in 2023 and accounted for a significant revenue share. Sustainable transportation encompasses environmentally friendly solutions, reducing carbon emissions, lowering resource consumption, and promoting equity in society. By providing effective mobility for people and goods, they help tackle the environmental and social issues related to conventional transportation solutions.
The carbon accounting and reporting services segment is projected to record the fastest CAGR during the forecast period. Carbon accounting services track, analyze, calculate, and communicate emissions within a company across sectors that need to be audited for greenhouse gases. It helps businesses to manage their carbon discharges.
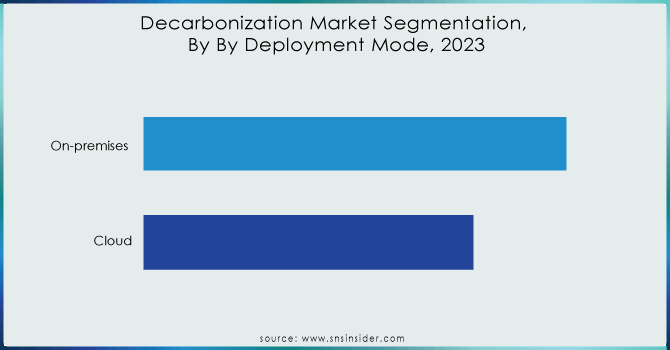
By Deployment
In 2023, the on-premise segment dominated the market and accounted for 73% of revenue share. On-premises deployment in decarbonization signifies cutting back on carbon emissions, whether they arise from industrial processes, energy production, transportation, or buildings, to mitigate climate change. On-site renewable generation—including solar panels, wind turbines, and even small-scale hydroelectric facilities—can help facilities reduce their reliance on fossil fuels and the associated emissions from power consumption.
The cloud segment is projected to have the fastest growth rate. Cloud-based decarburization is an economical, highly scalable, and easy-to-execute, maintain, and upgrade solution for this purpose. Alongside it offers benefits such as security, data control, speed, and availability which is a 24/7 presence and truly helps to make it the best choice for clients.
By End-Use
The oil & gas segment dominated the market in 2023 and accounted for a significant revenue share in 2023. Decarbonization is the process of reducing or eliminating carbon dioxide (CO2) and other greenhouse gas emissions from the energy and utility sector that result from the supply and demand of energy. This is key to combating climate change and moving toward a greener, cleaner energy system in the future. The main approach to decarbonizing is to replace fossil fuels with renewable energy sources including solar, wind, hydropower, and geothermal energy.
The oil & gas segment is anticipated to grow at the fastest CAGR during the forecast period. Oil and gas companies are responsible for a large portion of global greenhouse gas emissions from fossil fuels and their extraction and production. Decarbonization in oil and gas means efforts to reduce the carbon footprint of the sector and eventual shift towards a low-carbon energy system.
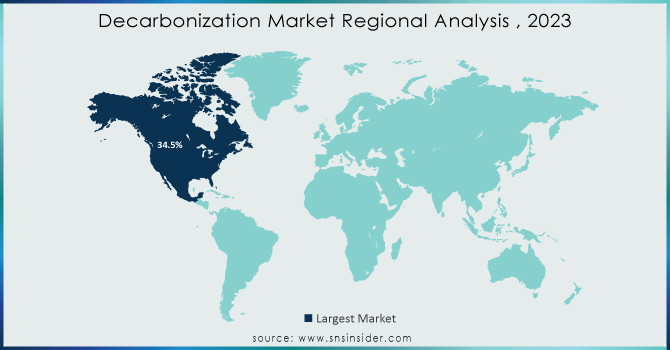
Regional Analysis
North America dominated the market and accounted for a significant revenue share in 2023. Prominent players in the industry are increasingly indulging in the various initiatives that are contributing to the growth of the market. For example, in June 2023, the Biden-Harris Administration announced an investment of approximately USD 30 million in sustainable federal buildings and clean energy technologies via the U.S. Department of Energy. In a more recent example, the North American Climate, Energy, and Environment Partnership urged governments to set sustainable energy policies and buy renewable energy and electric vehicles, as they see fit.
The Asia Pacific region is projected to have the fastest CAGR during the forecast period. The growing installation of solar power projects in China, India, and other Asia Pacific countries is increasing the adoption of renewable energy in the region. Asia Pacific includes some of the largest solar panel markets across the globe, such as these three countries.
Key Players
The major key players along with their products are
May 2024: The TEC under UNFCCC's Technology Mechanism noted global and regional efforts promoting decarbonization technologies in high-emission industrial sectors, accounting for 34% of global emissions.
February 2024: SECI launched India's largest solar-battery project in Chhattisgarh, combining solar panels and battery storage to store solar energy for peak demand, targeting significant annual CO2 emission reductions.
October 2023: Stargate Hydrogen and NextHeat formed a strategic partnership to develop innovative solutions for decarbonizing the industrial sector. They intend to replace natural gas with green hydrogen for applications such as industrial heating.
May 2023: Envision Digital and Dassault Systèmes have allied to pave the way toward industrial decarbonization by pairing the former's EnOS framework with the latter's 3DEXPERIENCE platform for energizing sustainable energy solutions and virtual twin experiences across industries.
| Report Attributes | Details |
|---|---|
| Market Size in 2023 | USD 1906.1 Billion |
| Market Size by 2032 | USD 5644.2 Billion |
| CAGR | CAGR of 12.84% From 2024 to 2032 |
| Base Year | 2023 |
| Forecast Period | 2024-2032 |
| Historical Data | 2020-2022 |
| Report Scope & Coverage | Market Size, Segments Analysis, Competitive Landscape, Regional Analysis, DROC & SWOT Analysis, Forecast Outlook |
| Key Segments | • By Technology (Renewable Energy Technologies, Energy Efficiency Solutions, Electric Vehicles (EVs), Carbon Removal Technologies, Carbon Capture and Storage (CCS)) • By Service (Carbon Accounting and Reporting Services, Sustainable Transportation Services, Waste Reduction and Circular Economy Services) • By Deployment (On-premises, Cloud) • By End-Use (Oil & Gas, Energy and Utility, Agriculture, Government, Automotive & Transportation, Aerospace & Defense, Manufacturing) |
| Regional Analysis/Coverage | North America (US, Canada, Mexico), Europe (Eastern Europe [Poland, Romania, Hungary, Turkey, Rest of Eastern Europe] Western Europe] Germany, France, UK, Italy, Spain, Netherlands, Switzerland, Austria, Rest of Western Europe]), Asia Pacific (China, India, Japan, South Korea, Vietnam, Singapore, Australia, Rest of Asia Pacific), Middle East & Africa (Middle East [UAE, Egypt, Saudi Arabia, Qatar, Rest of Middle East], Africa [Nigeria, South Africa, Rest of Africa], Latin America (Brazil, Argentina, Colombia, Rest of Latin America) |
| Company Profiles | Siemens Energy, General Electric (GE), Schneider Electric, ABB, Honeywell, Mitsubishi Heavy Industries (MHI), Shell, TotalEnergies, Ørsted, ExxonMobil, Air Liquide, Linde plc, BASF, Engie, Climeworks |
Ans: The North American region dominated the Decarbonization Market holding the largest market share of about 34.5% during the forecast period.
Ans The Decarbonization Market was valued at USD 1906.1 Billion in 2023 and is expected to reach USD 5644.2 Billion by 2032.
Ans- Asia-Pacific is expected to register the fastest CAGR during the forecast period.
Ans-Governments and corporations are enforcing strict carbon policies and sustainability goals, driving investments in decarbonization technologies.
Ans- Transitioning from fossil fuels to renewables faces challenges like energy intermittency, policy uncertainties, and geopolitical risks.
Table of Contents
1. Introduction
1.1 Market Definition
1.2 Scope (Inclusion and Exclusions)
1.3 Research Assumptions
2. Executive Summary
2.1 Market Overview
2.2 Regional Synopsis
2.3 Competitive Summary
3. Research Methodology
3.1 Top-Down Approach
3.2 Bottom-up Approach
3.3. Data Validation
3.4 Primary Interviews
4. Market Dynamics Impact Analysis
4.1 Market Driving Factors Analysis
4.1.1 Drivers
4.1.2 Restraints
4.1.3 Opportunities
4.1.4 Challenges
4.2 PESTLE Analysis
4.3 Porter’s Five Forces Model
5. Statistical Insights and Trends Reporting
5.1 Adoption Rates of Decarbonization Technologies
5.2 Renewable Energy Infrastructure Expansion, by Region
5.3 Emission Reduction Trends, by Region (2020-2023)
5.4 Green Energy Consumption, by Region
6. Competitive Landscape
6.1 List of Major Companies, By Region
6.2 Market Share Analysis, By Region
6.3 Product Benchmarking
6.3.1 Product specifications and features
6.3.2 Pricing
6.4 Strategic Initiatives
6.4.1 Marketing and promotional activities
6.4.2 Distribution and supply chain strategies
6.4.3 Expansion plans and new product launches
6.4.4 Strategic partnerships and collaborations
6.5 Technological Advancements
6.6 Market Positioning and Branding
7. Decarbonization Market Segmentation, by Deployment
7.1 Chapter Overview
7.2 On-premises
7.2.1 On-premises Market Trends Analysis (2020-2032)
7.2.2 On-premises Market Size Estimates and Forecasts to 2032 (USD Billion)
7.3 Cloud-based
7.3.1 Cloud-based Market Trends Analysis (2020-2032)
7.3.2 Cloud-based Market Size Estimates and Forecasts to 2032 (USD Billion)
8. Decarbonization Market Segmentation, by Service
8.1 Chapter Overview
8.2 Carbon Accounting and Reporting Services
8.2.1 Carbon Accounting and Reporting Services Market Trends Analysis (2020-2032)
8.2.2 Carbon Accounting and Reporting Services Market Size Estimates and Forecasts to 2032 (USD Billion)
8.3 Sustainable Transportation Services
8.3.1 Sustainable Transportation Services Market Trends Analysis (2020-2032)
8.3.2 Sustainable Transportation Services Market Size Estimates and Forecasts to 2032 (USD Billion)
8.4 Waste Reduction and Circular Economy Services
8.4.1 Waste Reduction and Circular Economy Services Market Trends Analysis (2020-2032)
8.4.2 Waste Reduction and Circular Economy Services Market Size Estimates and Forecasts to 2032 (USD Billion)
9. Decarbonization Market Segmentation, by Technology
9.1 Chapter Overview
9.2 Renewable Energy Technologies
9.2.1 Renewable Energy Technologies Market Trends Analysis (2020-2032)
9.2.2 Renewable Energy Technologies Market Size Estimates and Forecasts to 2032 (USD Billion)
9.3 Energy Efficiency Solutions
9.3.1 Energy Efficiency Solutions Market Trends Analysis (2020-2032)
9.3.2 Energy Efficiency Solutions Market Size Estimates and Forecasts to 2032 (USD Billion)
9.3 Electric Vehicles (EVs)
9.3.1 Electric Vehicles (EVs) Market Trends Analysis (2020-2032)
9.3.2 Electric Vehicles (EVs) Market Size Estimates and Forecasts to 2032 (USD Billion)
9.4 Carbon Removal Technologies
9.4.1 Carbon Removal Technologies Market Trends Analysis (2020-2032)
9.4.2 Carbon Removal Technologies Market Size Estimates and Forecasts to 2032 (USD Billion)
9.5 Carbon Capture and Storage (CCS)
9.5.1 Carbon Capture and Storage (CCS) Market Trends Analysis (2020-2032)
9.5.2 Carbon Capture and Storage (CCS) Market Size Estimates and Forecasts to 2032 (USD Billion)
10. Decarbonization Market Segmentation, by End-Use
10.1 Chapter Overview
10.2 Oil & Gas
10.2.1 Oil & Gas Market Trends Analysis (2020-2032)
10.2.2 Oil & Gas Market Size Estimates and Forecasts to 2032 (USD Billion)
10.3 Energy and Utility
10.3.1 Energy and Utility Market Trends Analysis (2020-2032)
10.3.2 Energy and Utility Market Size Estimates and Forecasts to 2032 (USD Billion)
10.4 Agriculture
10.4.1Agriculture Market Trends Analysis (2020-2032)
10.4.2Agriculture Market Size Estimates and Forecasts to 2032 (USD Billion)
10.5 Government
10.5.1 Government Market Trends Analysis (2020-2032)
10.5.2 Government Market Size Estimates and Forecasts to 2032 (USD Billion)
10.6 Automotive & Transportation
10.6.1 Automotive & Transportation Market Trends Analysis (2020-2032)
10.6.2 Automotive & Transportation Market Size Estimates and Forecasts to 2032 (USD Billion)
10.7 Aerospace & Defense
10.7.1 Aerospace & Defense Market Trends Analysis (2020-2032)
10.7.2 Aerospace & Defense Market Size Estimates and Forecasts to 2032 (USD Billion)
10.8 Manufacturing
10.8.1 Manufacturing Market Trends Analysis (2020-2032)
10.8.2 Manufacturing Market Size Estimates and Forecasts to 2032 (USD Billion)
11. Regional Analysis
11.1 Chapter Overview
11.2 North America
11.2.1 Trends Analysis
11.2.2 North America Decarbonization Market Estimates and Forecasts, by Country (2020-2032) (USD Billion)
11.2.3 North America Decarbonization Market Estimates and Forecasts, by Deployment (2020-2032) (USD Billion)
11.2.4 North America Decarbonization Market Estimates and Forecasts, by Service (2020-2032) (USD Billion)
11.2.5 North America Decarbonization Market Estimates and Forecasts, by Technology (2020-2032) (USD Billion)
11.2.6 North America Decarbonization Market Estimates and Forecasts, by End-Use (2020-2032) (USD Billion)
11.2.7 USA
11.2.7.1 USA Decarbonization Market Estimates and Forecasts, by Deployment (2020-2032) (USD Billion)
11.2.7.2 USA Decarbonization Market Estimates and Forecasts, by Service (2020-2032) (USD Billion)
11.2.7.3 USA Decarbonization Market Estimates and Forecasts, by Technology (2020-2032) (USD Billion)
11.2.7.4 USA Decarbonization Market Estimates and Forecasts, by End-Use (2020-2032) (USD Billion)
11.2.8 Canada
11.2.8.1 Canada Decarbonization Market Estimates and Forecasts, by Deployment (2020-2032) (USD Billion)
11.2.8.2 Canada Decarbonization Market Estimates and Forecasts, by Service (2020-2032) (USD Billion)
11.2.8.3 Canada Decarbonization Market Estimates and Forecasts, by Technology (2020-2032) (USD Billion)
11.2.8.4 Canada Decarbonization Market Estimates and Forecasts, by End-Use (2020-2032) (USD Billion)
11.2.9 Mexico
11.2.9.1 Mexico Decarbonization Market Estimates and Forecasts, by Deployment (2020-2032) (USD Billion)
11.2.9.2 Mexico Decarbonization Market Estimates and Forecasts, by Service (2020-2032) (USD Billion)
11.2.9.3 Mexico Decarbonization Market Estimates and Forecasts, by Technology (2020-2032) (USD Billion)
11.2.9.4 Mexico Decarbonization Market Estimates and Forecasts, by End-Use (2020-2032) (USD Billion)
11.3 Europe
11.3.1 Eastern Europe
11.3.1.1 Trends Analysis
11.3.1.2 Eastern Europe Decarbonization Market Estimates and Forecasts, by Country (2020-2032) (USD Billion)
11.3.1.3 Eastern Europe Decarbonization Market Estimates and Forecasts, by Deployment (2020-2032) (USD Billion)
11.3.1.4 Eastern Europe Decarbonization Market Estimates and Forecasts, by Service (2020-2032) (USD Billion)
11.3.1.5 Eastern Europe Decarbonization Market Estimates and Forecasts, by Technology (2020-2032) (USD Billion)
11.3.1.6 Eastern Europe Decarbonization Market Estimates and Forecasts, by End-Use (2020-2032) (USD Billion)
11.3.1.7 Poland
11.3.1.7.1 Poland Decarbonization Market Estimates and Forecasts, by Deployment (2020-2032) (USD Billion)
11.3.1.7.2 Poland Decarbonization Market Estimates and Forecasts, by Service (2020-2032) (USD Billion)
11.3.1.7.3 Poland Decarbonization Market Estimates and Forecasts, by Technology (2020-2032) (USD Billion)
11.3.1.7.4 Poland Decarbonization Market Estimates and Forecasts, by End-Use (2020-2032) (USD Billion)
11.3.1.8 Romania
11.3.1.8.1 Romania Decarbonization Market Estimates and Forecasts, by Deployment (2020-2032) (USD Billion)
11.3.1.8.2 Romania Decarbonization Market Estimates and Forecasts, by Service (2020-2032) (USD Billion)
11.3.1.8.3 Romania Decarbonization Market Estimates and Forecasts, by Technology (2020-2032) (USD Billion)
11.3.1.8.4 Romania Decarbonization Market Estimates and Forecasts, by End-Use (2020-2032) (USD Billion)
11.3.1.9 Hungary
11.3.1.9.1 Hungary Decarbonization Market Estimates and Forecasts, by Deployment (2020-2032) (USD Billion)
11.3.1.9.2 Hungary Decarbonization Market Estimates and Forecasts, by Service (2020-2032) (USD Billion)
11.3.1.9.3 Hungary Decarbonization Market Estimates and Forecasts, by Technology (2020-2032) (USD Billion)
11.3.1.9.4 Hungary Decarbonization Market Estimates and Forecasts, by End-Use (2020-2032) (USD Billion)
11.3.1.10 Turkey
11.3.1.10.1 Turkey Decarbonization Market Estimates and Forecasts, by Deployment (2020-2032) (USD Billion)
11.3.1.10.2 Turkey Decarbonization Market Estimates and Forecasts, by Service (2020-2032) (USD Billion)
11.3.1.10.3 Turkey Decarbonization Market Estimates and Forecasts, by Technology (2020-2032) (USD Billion)
11.3.1.10.4 Turkey Decarbonization Market Estimates and Forecasts, by End-Use (2020-2032) (USD Billion)
11.3.1.11 Rest of Eastern Europe
11.3.1.11.1 Rest of Eastern Europe Decarbonization Market Estimates and Forecasts, by Deployment (2020-2032) (USD Billion)
11.3.1.11.2 Rest of Eastern Europe Decarbonization Market Estimates and Forecasts, by Service (2020-2032) (USD Billion)
11.3.1.11.3 Rest of Eastern Europe Decarbonization Market Estimates and Forecasts, by Technology (2020-2032) (USD Billion)
11.3.1.11.4 Rest of Eastern Europe Decarbonization Market Estimates and Forecasts, by End-Use (2020-2032) (USD Billion)
11.3.2 Western Europe
11.3.2.1 Trends Analysis
11.3.2.2 Western Europe Decarbonization Market Estimates and Forecasts, by Country (2020-2032) (USD Billion)
11.3.2.3 Western Europe Decarbonization Market Estimates and Forecasts, by Deployment (2020-2032) (USD Billion)
11.3.2.4 Western Europe Decarbonization Market Estimates and Forecasts, by Service (2020-2032) (USD Billion)
11.3.2.5 Western Europe Decarbonization Market Estimates and Forecasts, by Technology (2020-2032) (USD Billion)
11.3.2.6 Western Europe Decarbonization Market Estimates and Forecasts, by End-Use (2020-2032) (USD Billion)
11.3.2.7 Germany
11.3.2.7.1 Germany Decarbonization Market Estimates and Forecasts, by Deployment (2020-2032) (USD Billion)
11.3.2.7.2 Germany Decarbonization Market Estimates and Forecasts, by Service (2020-2032) (USD Billion)
11.3.2.7.3 Germany Decarbonization Market Estimates and Forecasts, by Technology (2020-2032) (USD Billion)
11.3.2.7.4 Germany Decarbonization Market Estimates and Forecasts, by End-Use (2020-2032) (USD Billion)
11.3.2.8 France
11.3.2.8.1 France Decarbonization Market Estimates and Forecasts, by Deployment (2020-2032) (USD Billion)
11.3.2.8.2 France Decarbonization Market Estimates and Forecasts, by Service (2020-2032) (USD Billion)
11.3.2.8.3 France Decarbonization Market Estimates and Forecasts, by Technology (2020-2032) (USD Billion)
11.3.2.8.4 France Decarbonization Market Estimates and Forecasts, by End-Use (2020-2032) (USD Billion)
11.3.2.9 UK
11.3.2.9.1 UK Decarbonization Market Estimates and Forecasts, by Deployment (2020-2032) (USD Billion)
11.3.2.9.2 UK Decarbonization Market Estimates and Forecasts, by Service (2020-2032) (USD Billion)
11.3.2.9.3 UK Decarbonization Market Estimates and Forecasts, by Technology (2020-2032) (USD Billion)
11.3.2.9.4 UK Decarbonization Market Estimates and Forecasts, by End-Use (2020-2032) (USD Billion)
11.3.2.10 Italy
11.3.2.10.1 Italy Decarbonization Market Estimates and Forecasts, by Deployment (2020-2032) (USD Billion)
11.3.2.10.2 Italy Decarbonization Market Estimates and Forecasts, by Service (2020-2032) (USD Billion)
11.3.2.10.3 Italy Decarbonization Market Estimates and Forecasts, by Technology (2020-2032) (USD Billion)
11.3.2.10.4 Italy Decarbonization Market Estimates and Forecasts, by End-Use (2020-2032) (USD Billion)
11.3.2.11 Spain
11.3.2.11.1 Spain Decarbonization Market Estimates and Forecasts, by Deployment (2020-2032) (USD Billion)
11.3.2.11.2 Spain Decarbonization Market Estimates and Forecasts, by Service (2020-2032) (USD Billion)
11.3.2.11.3 Spain Decarbonization Market Estimates and Forecasts, by Technology (2020-2032) (USD Billion)
11.3.2.11.4 Spain Decarbonization Market Estimates and Forecasts, by End-Use (2020-2032) (USD Billion)
11.3.2.12 Netherlands
11.3.2.12.1 Netherlands Decarbonization Market Estimates and Forecasts, by Deployment (2020-2032) (USD Billion)
11.3.2.12.2 Netherlands Decarbonization Market Estimates and Forecasts, by Service (2020-2032) (USD Billion)
11.3.2.12.3 Netherlands Decarbonization Market Estimates and Forecasts, by Technology (2020-2032) (USD Billion)
11.3.2.12.4 Netherlands Decarbonization Market Estimates and Forecasts, by End-Use (2020-2032) (USD Billion)
11.3.2.13 Switzerland
11.3.2.13.1 Switzerland Decarbonization Market Estimates and Forecasts, by Deployment (2020-2032) (USD Billion)
11.3.2.13.2 Switzerland Decarbonization Market Estimates and Forecasts, by Service (2020-2032) (USD Billion)
11.3.2.13.3 Switzerland Decarbonization Market Estimates and Forecasts, by Technology (2020-2032) (USD Billion)
11.3.2.13.4 Switzerland Decarbonization Market Estimates and Forecasts, by End-Use (2020-2032) (USD Billion)
11.3.2.14 Austria
11.3.2.14.1 Austria Decarbonization Market Estimates and Forecasts, by Deployment (2020-2032) (USD Billion)
11.3.2.14.2 Austria Decarbonization Market Estimates and Forecasts, by Service (2020-2032) (USD Billion)
11.3.2.14.3 Austria Decarbonization Market Estimates and Forecasts, by Technology (2020-2032) (USD Billion)
11.3.2.14.4 Austria Decarbonization Market Estimates and Forecasts, by End-Use (2020-2032) (USD Billion)
11.3.2.15 Rest of Western Europe
11.3.2.15.1 Rest of Western Europe Decarbonization Market Estimates and Forecasts, by Deployment (2020-2032) (USD Billion)
11.3.2.15.2 Rest of Western Europe Decarbonization Market Estimates and Forecasts, by Service (2020-2032) (USD Billion)
11.3.2.15.3 Rest of Western Europe Decarbonization Market Estimates and Forecasts, by Technology (2020-2032) (USD Billion)
11.3.2.15.4 Rest of Western Europe Decarbonization Market Estimates and Forecasts, by End-Use (2020-2032) (USD Billion)
11.4 Asia Pacific
11.4.1 Trends Analysis
11.4.2 Asia Pacific Decarbonization Market Estimates and Forecasts, by Country (2020-2032) (USD Billion)
11.4.3 Asia Pacific Decarbonization Market Estimates and Forecasts, by Deployment (2020-2032) (USD Billion)
11.4.4 Asia Pacific Decarbonization Market Estimates and Forecasts, by Service (2020-2032) (USD Billion)
11.4.5 Asia Pacific Decarbonization Market Estimates and Forecasts, by Technology (2020-2032) (USD Billion)
11.4.6 Asia Pacific Decarbonization Market Estimates and Forecasts, by End-Use (2020-2032) (USD Billion)
11.4.7 China
11.4.7.1 China Decarbonization Market Estimates and Forecasts, by Deployment (2020-2032) (USD Billion)
11.4.7.2 China Decarbonization Market Estimates and Forecasts, by Service (2020-2032) (USD Billion)
11.4.7.3 China Decarbonization Market Estimates and Forecasts, by Technology (2020-2032) (USD Billion)
11.4.7.4 China Decarbonization Market Estimates and Forecasts, by End-Use (2020-2032) (USD Billion)
11.4.8 India
11.4.8.1 India Decarbonization Market Estimates and Forecasts, by Deployment (2020-2032) (USD Billion)
11.4.8.2 India Decarbonization Market Estimates and Forecasts, by Service (2020-2032) (USD Billion)
11.4.8.3 India Decarbonization Market Estimates and Forecasts, by Technology (2020-2032) (USD Billion)
11.4.8.4 India Decarbonization Market Estimates and Forecasts, by End-Use (2020-2032) (USD Billion)
11.4.9 Japan
11.4.9.1 Japan Decarbonization Market Estimates and Forecasts, by Deployment (2020-2032) (USD Billion)
11.4.9.2 Japan Decarbonization Market Estimates and Forecasts, by Service (2020-2032) (USD Billion)
11.4.9.3 Japan Decarbonization Market Estimates and Forecasts, by Technology (2020-2032) (USD Billion)
11.4.9.4 Japan Decarbonization Market Estimates and Forecasts, by End-Use (2020-2032) (USD Billion)
11.4.10 South Korea
11.4.10.1 South Korea Decarbonization Market Estimates and Forecasts, by Deployment (2020-2032) (USD Billion)
11.4.10.2 South Korea Decarbonization Market Estimates and Forecasts, by Service (2020-2032) (USD Billion)
11.4.10.3 South Korea Decarbonization Market Estimates and Forecasts, by Technology (2020-2032) (USD Billion)
11.4.10.4 South Korea Decarbonization Market Estimates and Forecasts, by End-Use (2020-2032) (USD Billion)
11.4.11 Vietnam
11.4.11.1 Vietnam Decarbonization Market Estimates and Forecasts, by Deployment (2020-2032) (USD Billion)
11.4.11.2 Vietnam Decarbonization Market Estimates and Forecasts, by Service (2020-2032) (USD Billion)
11.4.11.3 Vietnam Decarbonization Market Estimates and Forecasts, by Technology (2020-2032) (USD Billion)
11.4.11.4 Vietnam Decarbonization Market Estimates and Forecasts, by End-Use (2020-2032) (USD Billion)
11.4.12 Singapore
11.4.12.1 Singapore Decarbonization Market Estimates and Forecasts, by Deployment (2020-2032) (USD Billion)
11.4.12.2 Singapore Decarbonization Market Estimates and Forecasts, by Service (2020-2032) (USD Billion)
11.4.12.3 Singapore Decarbonization Market Estimates and Forecasts, by Technology (2020-2032) (USD Billion)
11.4.12.4 Singapore Decarbonization Market Estimates and Forecasts, by End-Use (2020-2032) (USD Billion)
11.4.13 Australia
11.4.13.1 Australia Decarbonization Market Estimates and Forecasts, by Deployment (2020-2032) (USD Billion)
11.4.13.2 Australia Decarbonization Market Estimates and Forecasts, by Service (2020-2032) (USD Billion)
11.4.13.3 Australia Decarbonization Market Estimates and Forecasts, by Technology (2020-2032) (USD Billion)
11.4.13.4 Australia Decarbonization Market Estimates and Forecasts, by End-Use (2020-2032) (USD Billion)
11.4.14 Rest of Asia Pacific
11.4.14.1 Rest of Asia Pacific Decarbonization Market Estimates and Forecasts, by Deployment (2020-2032) (USD Billion)
11.4.14.2 Rest of Asia Pacific Decarbonization Market Estimates and Forecasts, by Service (2020-2032) (USD Billion)
11.4.14.3 Rest of Asia Pacific Decarbonization Market Estimates and Forecasts, by Technology (2020-2032) (USD Billion)
11.4.14.4 Rest of Asia Pacific Decarbonization Market Estimates and Forecasts, by End-Use (2020-2032) (USD Billion)
11.5 Middle East and Africa
11.5.1 Middle East
11.5.1.1 Trends Analysis
11.5.1.2 Middle East Decarbonization Market Estimates and Forecasts, by Country (2020-2032) (USD Billion)
11.5.1.3 Middle East Decarbonization Market Estimates and Forecasts, by Deployment (2020-2032) (USD Billion)
11.5.1.4 Middle East Decarbonization Market Estimates and Forecasts, by Service (2020-2032) (USD Billion)
11.5.1.5 Middle East Decarbonization Market Estimates and Forecasts, by Technology (2020-2032) (USD Billion)
11.5.1.6 Middle East Decarbonization Market Estimates and Forecasts, by End-Use (2020-2032) (USD Billion)
11.5.1.7 UAE
11.5.1.7.1 UAE Decarbonization Market Estimates and Forecasts, by Deployment (2020-2032) (USD Billion)
11.5.1.7.2 UAE Decarbonization Market Estimates and Forecasts, by Service (2020-2032) (USD Billion)
11.5.1.7.3 UAE Decarbonization Market Estimates and Forecasts, by Technology (2020-2032) (USD Billion)
11.5.1.7.4 UAE Decarbonization Market Estimates and Forecasts, by End-Use (2020-2032) (USD Billion)
11.5.1.8 Egypt
11.5.1.8.1 Egypt Decarbonization Market Estimates and Forecasts, by Deployment (2020-2032) (USD Billion)
11.5.1.8.2 Egypt Decarbonization Market Estimates and Forecasts, by Service (2020-2032) (USD Billion)
11.5.1.8.3 Egypt Decarbonization Market Estimates and Forecasts, by Technology (2020-2032) (USD Billion)
11.5.1.8.4 Egypt Decarbonization Market Estimates and Forecasts, by End-Use (2020-2032) (USD Billion)
11.5.1.9 Saudi Arabia
11.5.1.9.1 Saudi Arabia Decarbonization Market Estimates and Forecasts, by Deployment (2020-2032) (USD Billion)
11.5.1.9.2 Saudi Arabia Decarbonization Market Estimates and Forecasts, by Service (2020-2032) (USD Billion)
11.5.1.9.3 Saudi Arabia Decarbonization Market Estimates and Forecasts, by Technology (2020-2032) (USD Billion)
11.5.1.9.4 Saudi Arabia Decarbonization Market Estimates and Forecasts, by End-Use (2020-2032) (USD Billion)
11.5.1.10 Qatar
11.5.1.10.1 Qatar Decarbonization Market Estimates and Forecasts, by Deployment (2020-2032) (USD Billion)
11.5.1.10.2 Qatar Decarbonization Market Estimates and Forecasts, by Service (2020-2032) (USD Billion)
11.5.1.10.3 Qatar Decarbonization Market Estimates and Forecasts, by Technology (2020-2032) (USD Billion)
11.5.1.10.4 Qatar Decarbonization Market Estimates and Forecasts, by End-Use (2020-2032) (USD Billion)
11.5.1.11 Rest of Middle East
11.5.1.11.1 Rest of Middle East Decarbonization Market Estimates and Forecasts, by Deployment (2020-2032) (USD Billion)
11.5.1.11.2 Rest of Middle East Decarbonization Market Estimates and Forecasts, by Service (2020-2032) (USD Billion)
11.5.1.11.3 Rest of Middle East Decarbonization Market Estimates and Forecasts, by Technology (2020-2032) (USD Billion)
11.5.1.11.4 Rest of Middle East Decarbonization Market Estimates and Forecasts, by End-Use (2020-2032) (USD Billion)
11.5.2 Africa
11.5.2.1 Trends Analysis
11.5.2.2 Africa Decarbonization Market Estimates and Forecasts, by Country (2020-2032) (USD Billion)
11.5.2.3 Africa Decarbonization Market Estimates and Forecasts, by Deployment (2020-2032) (USD Billion)
11.5.2.4 Africa Decarbonization Market Estimates and Forecasts, by Service (2020-2032) (USD Billion)
11.5.2.5 Africa Decarbonization Market Estimates and Forecasts, by Technology (2020-2032) (USD Billion)
11.5.2.6 Africa Decarbonization Market Estimates and Forecasts, by End-Use (2020-2032) (USD Billion)
11.5.2.7 South Africa
11.5.2.7.1 South Africa Decarbonization Market Estimates and Forecasts, by Deployment (2020-2032) (USD Billion)
11.5.2.7.2 South Africa Decarbonization Market Estimates and Forecasts, by Service (2020-2032) (USD Billion)
11.5.2.7.3 South Africa Decarbonization Market Estimates and Forecasts, by Technology (2020-2032) (USD Billion)
11.5.2.7.4 South Africa Decarbonization Market Estimates and Forecasts, by End-Use (2020-2032) (USD Billion)
11.5.2.8 Nigeria
11.5.2.8.1 Nigeria Decarbonization Market Estimates and Forecasts, by Deployment (2020-2032) (USD Billion)
11.5.2.8.2 Nigeria Decarbonization Market Estimates and Forecasts, by Service (2020-2032) (USD Billion)
11.5.2.8.3 Nigeria Decarbonization Market Estimates and Forecasts, by Technology (2020-2032) (USD Billion)
11.5.2.8.4 Nigeria Decarbonization Market Estimates and Forecasts, by End-Use (2020-2032) (USD Billion)
11.5.2.9 Rest of Africa
11.5.2.9.1 Rest of Africa Decarbonization Market Estimates and Forecasts, by Deployment (2020-2032) (USD Billion)
11.5.2.9.2 Rest of Africa Decarbonization Market Estimates and Forecasts, by Service (2020-2032) (USD Billion)
11.5.2.9.3 Rest of Africa Decarbonization Market Estimates and Forecasts, by Technology (2020-2032) (USD Billion)
11.5.2.9.4 Rest of Africa Decarbonization Market Estimates and Forecasts, by End-Use (2020-2032) (USD Billion)
11.6 Latin America
11.6.1 Trends Analysis
11.6.2 Latin America Decarbonization Market Estimates and Forecasts, by Country (2020-2032) (USD Billion)
11.6.3 Latin America Decarbonization Market Estimates and Forecasts, by Deployment (2020-2032) (USD Billion)
11.6.4 Latin America Decarbonization Market Estimates and Forecasts, by Service (2020-2032) (USD Billion)
11.6.5 Latin America Decarbonization Market Estimates and Forecasts, by Technology (2020-2032) (USD Billion)
11.6.6 Latin America Decarbonization Market Estimates and Forecasts, by End-Use (2020-2032) (USD Billion)
11.6.7 Brazil
11.6.7.1 Brazil Decarbonization Market Estimates and Forecasts, by Deployment (2020-2032) (USD Billion)
11.6.7.2 Brazil Decarbonization Market Estimates and Forecasts, by Service (2020-2032) (USD Billion)
11.6.7.3 Brazil Decarbonization Market Estimates and Forecasts, by Technology (2020-2032) (USD Billion)
11.6.7.4 Brazil Decarbonization Market Estimates and Forecasts, by End-Use (2020-2032) (USD Billion)
11.6.8 Argentina
11.6.8.1 Argentina Decarbonization Market Estimates and Forecasts, by Deployment (2020-2032) (USD Billion)
11.6.8.2 Argentina Decarbonization Market Estimates and Forecasts, by Service (2020-2032) (USD Billion)
11.6.8.3 Argentina Decarbonization Market Estimates and Forecasts, by Technology (2020-2032) (USD Billion)
11.6.8.4 Argentina Decarbonization Market Estimates and Forecasts, by End-Use (2020-2032) (USD Billion)
11.6.9 Colombia
11.6.9.1 Colombia Decarbonization Market Estimates and Forecasts, by Deployment (2020-2032) (USD Billion)
11.6.9.2 Colombia Decarbonization Market Estimates and Forecasts, by Service (2020-2032) (USD Billion)
11.6.9.3 Colombia Decarbonization Market Estimates and Forecasts, by Technology (2020-2032) (USD Billion)
11.6.9.4 Colombia Decarbonization Market Estimates and Forecasts, by End-Use (2020-2032) (USD Billion)
11.6.10 Rest of Latin America
11.6.10.1 Rest of Latin America Decarbonization Market Estimates and Forecasts, by Deployment (2020-2032) (USD Billion)
11.6.10.2 Rest of Latin America Decarbonization Market Estimates and Forecasts, by Service (2020-2032) (USD Billion)
11.6.10.3 Rest of Latin America Decarbonization Market Estimates and Forecasts, by Technology (2020-2032) (USD Billion)
11.6.10.4 Rest of Latin America Decarbonization Market Estimates and Forecasts, by End-Use (2020-2032) (USD Billion)
12. Company Profiles
12.1 Siemens Energy
12.1.1 Company Overview
12.1.2 Financial
12.1.3 Products/ Services Offered
12.1.4 SWOT Analysis
12.2 General Electric (GE)
12.2.1 Company Overview
12.2.2 Financial
12.2.3 Products/ Services Offered
12.2.4 SWOT Analysis
12.3 RingCentral
12.3.1 Company Overview
12.3.2 Financial
12.3.3 Products/ Services Offered
12.3.4 SWOT Analysis
12.4 Schneider Electric
12.4.1 Company Overview
12.4.2 Financial
12.4.3 Products/ Services Offered
12.4.4 SWOT Analysis
12.5 ABB
12.5.1 Company Overview
12.5.2 Financial
12.5.3 Products/ Services Offered
12.5.4 SWOT Analysis
12.6 Honeywell
12.6.1 Company Overview
12.6.2 Financial
12.6.3 Products/ Services Offered
12.6.4 SWOT Analysis
12.7 Mitsubishi Heavy Industries
12.7.1 Company Overview
12.7.2 Financial
12.7.3 Products/ Services Offered
12.7.4 SWOT Analysis
12.8 Shell
12.8.1 Company Overview
12.8.2 Financial
12.8.3 Products/ Services Offered
12.8.4 SWOT Analysis
12.9 TotalEnergies
12.9.1 Company Overview
12.9.2 Financial
12.9.3 Products/ Services Offered
12.9.4 SWOT Analysis
12.10 ExxonMobil
12.10.1 Company Overview
12.10.2 Financial
12.10.3 Products/ Services Offered
12.10.4 SWOT Analysis
13. Use Cases and Best Practices
14. Conclusion
An accurate research report requires proper strategizing as well as implementation. There are multiple factors involved in the completion of good and accurate research report and selecting the best methodology to compete the research is the toughest part. Since the research reports we provide play a crucial role in any company’s decision-making process, therefore we at SNS Insider always believe that we should choose the best method which gives us results closer to reality. This allows us to reach at a stage wherein we can provide our clients best and accurate investment to output ratio.
Each report that we prepare takes a timeframe of 350-400 business hours for production. Starting from the selection of titles through a couple of in-depth brain storming session to the final QC process before uploading our titles on our website we dedicate around 350 working hours. The titles are selected based on their current market cap and the foreseen CAGR and growth.
The 5 steps process:
Step 1: Secondary Research:
Secondary Research or Desk Research is as the name suggests is a research process wherein, we collect data through the readily available information. In this process we use various paid and unpaid databases which our team has access to and gather data through the same. This includes examining of listed companies’ annual reports, Journals, SEC filling etc. Apart from this our team has access to various associations across the globe across different industries. Lastly, we have exchange relationships with various university as well as individual libraries.

Step 2: Primary Research
When we talk about primary research, it is a type of study in which the researchers collect relevant data samples directly, rather than relying on previously collected data. This type of research is focused on gaining content specific facts that can be sued to solve specific problems. Since the collected data is fresh and first hand therefore it makes the study more accurate and genuine.
We at SNS Insider have divided Primary Research into 2 parts.
Part 1 wherein we interview the KOLs of major players as well as the upcoming ones across various geographic regions. This allows us to have their view over the market scenario and acts as an important tool to come closer to the accurate market numbers. As many as 45 paid and unpaid primary interviews are taken from both the demand and supply side of the industry to make sure we land at an accurate judgement and analysis of the market.
This step involves the triangulation of data wherein our team analyses the interview transcripts, online survey responses and observation of on filed participants. The below mentioned chart should give a better understanding of the part 1 of the primary interview.

Part 2: In this part of primary research the data collected via secondary research and the part 1 of the primary research is validated with the interviews from individual consultants and subject matter experts.
Consultants are those set of people who have at least 12 years of experience and expertise within the industry whereas Subject Matter Experts are those with at least 15 years of experience behind their back within the same space. The data with the help of two main processes i.e., FGDs (Focused Group Discussions) and IDs (Individual Discussions). This gives us a 3rd party nonbiased primary view of the market scenario making it a more dependable one while collation of the data pointers.
Step 3: Data Bank Validation
Once all the information is collected via primary and secondary sources, we run that information for data validation. At our intelligence centre our research heads track a lot of information related to the market which includes the quarterly reports, the daily stock prices, and other relevant information. Our data bank server gets updated every fortnight and that is how the information which we collected using our primary and secondary information is revalidated in real time.

Step 4: QA/QC Process
After all the data collection and validation our team does a final level of quality check and quality assurance to get rid of any unwanted or undesired mistakes. This might include but not limited to getting rid of the any typos, duplication of numbers or missing of any important information. The people involved in this process include technical content writers, research heads and graphics people. Once this process is completed the title gets uploader on our platform for our clients to read it.
Step 5: Final QC/QA Process:
This is the last process and comes when the client has ordered the study. In this process a final QA/QC is done before the study is emailed to the client. Since we believe in giving our clients a good experience of our research studies, therefore, to make sure that we do not lack at our end in any way humanly possible we do a final round of quality check and then dispatch the study to the client.
Key Segments:
By Technology
Renewable Energy Technologies
Energy Efficiency Solutions
Electric Vehicles (EVs)
Carbon Removal Technologies
Carbon Capture and Storage (CCS)
By Service
Carbon Accounting and Reporting Services
Sustainable Transportation Services
Waste Reduction and Circular Economy Services
By Deployment
On-premises
Cloud
By End-Use
Oil & Gas
Energy and Utility
Agriculture
Government
Automotive & Transportation
Aerospace & Defense
Manufacturing
Request for Segment Customization as per your Business Requirement: Segment Customization Request
Regional Coverage:
North America
US
Canada
Mexico
Europe
Eastern Europe
Poland
Romania
Hungary
Turkey
Rest of Eastern Europe
Western Europe
Germany
France
UK
Italy
Spain
Netherlands
Switzerland
Austria
Rest of Western Europe
Asia Pacific
China
India
Japan
South Korea
Vietnam
Singapore
Australia
Rest of Asia Pacific
Middle East & Africa
Middle East
UAE
Egypt
Saudi Arabia
Qatar
Rest of Middle East
Africa
Nigeria
South Africa
Rest of Africa
Latin America
Brazil
Argentina
Colombia
Rest of Latin America
Request for Country Level Research Report: Country Level Customization Request
Available Customization
With the given market data, SNS Insider offers customization as per the company’s specific needs. The following customization options are available for the report:
Detailed Volume Analysis
Criss-Cross segment analysis (e.g. Product X Application)
Competitive Product Benchmarking
Geographic Analysis
Additional countries in any of the regions
Customized Data Representation
Detailed analysis and profiling of additional market players
Cold Chain Packaging Market size was USD 25.8 Billion in 2023 and is expected to reach USD 70.4 Billion by 2032 and grow at a CAGR of 11.82% from 2024-2032.
Gelcoat Market was valued at USD 1,390.34 Million in 2023 and is expected to reach USD 4,237.75 Million by 2032, growing at a CAGR of 4.70% from 2024-2032.
Acoustic Insulation Market was valued at USD 14.85 billion in 2023 and is expected to reach USD 23.14 billion by 2032, growing at a CAGR of 5.08% by 2024-2032.
The Glycerol Derivatives Market Size was USD 16.0 Billion in 2023 and is expected to reach USD 28.4 Bn by 2032 and grow at a CAGR of 6.6% by 2024-2032.
Polypropylene Market size was USD 85.40 Billion in 2023 and is expected to reach USD 139.15 Billion by 2032, growing at a CAGR of 5.57% from 2024 to 2032.
Chromium Phosphate Market size was USD 131.01 Million in 2023 and is expected to reach USD 328.76 Million by 2032, growing at a CAGR of 10.76% from 2024-2032.

Hi! Click one of our member below to chat on Phone
© 2025 All Rights Reserved by SNS Insider Pvt Ltd


