Data Wrangling Market Report Scope & Overview:
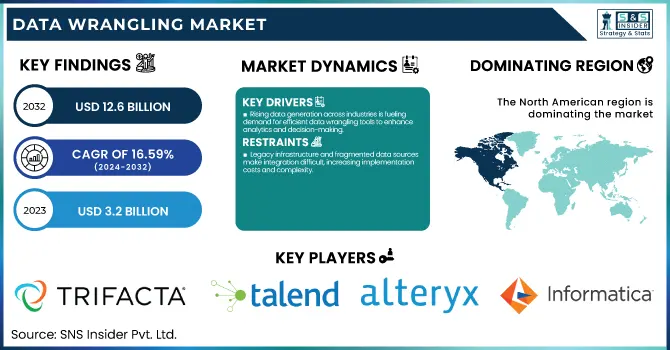
The Data Wrangling Market was valued at USD 3.2 Billion in 2023 and is expected to reach USD 12.6 Billion by 2032, growing at a CAGR of 16.59% from 2024-2032.
To Get more information on Data Wrangling Market - Request Free Sample Report
The Data Wrangling Market is expanding across industries, with finance, healthcare, and retail driving adoption. Cloud-based solutions dominate over on-premises due to cost efficiency and scalability. Data processing volumes are highest in North America and Asia-Pacific, reflecting strong data generation trends. AI/ML integration is boosting efficiency by automating data cleaning, transformation, and anomaly detection, minimizing manual effort and enhancing accuracy.
Market Dynamics
Drivers
-
Rising data generation across industries is fueling demand for efficient data wrangling tools to enhance analytics and decision-making.
Data's exponential growth across industries drives demand for efficient data-wrangling solutions. Businesses rely on data-driven insights for strategic decision-making, requiring tools to clean, transform, and structure raw data efficiently. The rise of big data analytics, IoT, and AI-driven applications further amplifies the need for robust data-wrangling processes. Organizations seek automation to reduce manual data preparation time, improve accuracy, and enhance operational efficiency. Additionally, regulatory requirements for data governance and compliance compel enterprises to adopt advanced data-wrangling solutions to ensure data integrity, consistency, and security across diverse data sources.
Restraints
-
Legacy infrastructure and fragmented data sources make integration difficult, increasing implementation costs and complexity.
However, data wrangling is limited mainly because legacy systems, which usually work on outdated architectures, do not support integrating with newer architectures. Most enterprise data sources are fragmented, and they often need extensive tuning to work well with the modern wrangling toolset. With unstructured and semi-structured data becoming the norm, this trickles into the implementation time and the resources required to manage that complexity. Moreover, ill-equipped businesses often have limited technical expertise which can reach its limitations when it comes to using and refining data wrangling solutions, resulting in lost time and money. Moreover, the high initial expenditure required to deploy advanced tools may hinder small and medium-sized enterprises from adopting these solutions, thus limiting market growth.
Opportunities
-
AI-driven automation enhances data cleaning, transformation, and anomaly detection, improving efficiency and accuracy.
Data-wrangling tools that integrate AI and machine learning have high growth potential. By automating the less interesting tasks — cleaning the data, detecting anomalies, and transforming — AI-powered solutions can free much of the manual work involved in preprocessing data and speed up the processing time. By using algorithms to detect patterns and inconsistencies within the data, automated data wrangling improves accuracy compared to traditional methods. The market growth is further driven by the growing popularity of self-service analytics and augmented data management as companies are looking for easier tools that reduce the reliance on IT teams. Moreover, its wrangling solutions, powered by AI, help industries such as finance, healthcare, and retail to process data in real-time, which, in turn, enhances invention and widespread acceptance.
Challenges
-
Regulatory concerns and data security risks pose challenges for enterprises handling sensitive information across multiple regions.
As businesses have to handle sensitive data inevitably due to various reasons, they also need to comply with data privacy and security regulations including GDPR, CCPA, HIPAA, and many others as they have gained ground in the recent past. Despite being an essential aspect of data processing, data wrangling solutions process highly sensitive, enormous volumes of both unstructured and structured data potentially prone to being accessed or breached without authorization. To safeguard sensitive data, enterprises must enforce robust security frameworks like encryption and access control. Moreover, regional compliance requirements differ, making it difficult to use globally, especially since multinational companies are also unable to standardize every data wrangling-related practice across different regions. There are legal penalties, plus damage to reputation, for failing to meet industry regulatory standards, so security is a top priority in data wrangling market adoption.
Segmentation Analysis
By Component
The solutions segment dominated the market and accounted for 74% of revenue share, Data wrangling is growing and nurturing towards its future surrounding with innovation and open into end-to-end data wrangling Components containing various tools and Technologies data integration, data preparation, and Data Analysis. Additionally, numerous data wrangling components are currently integrating with cloud-based analytics Platforms, including, Microsoft Azure, Amazon Web Services, and Google Cloud Platform.
The services segment is expected to register the fastest CAGR during the forecast period. as organizations leverage to optimize its data wrangling processes and consequently obtain a competitive edge through increased data-informed actions. The services segment of the market comprises professional services including consulting, implementation, and training that assist organizations in streamlining their data wrangling process.
By Deployment
In 2023, the on-premises segment dominated the market and accounted for a significant revenue share. With the increasing concerns about data privacy and security, we expect on-premises Components to become even more appealing to organizations that are subject to stringent regulation and data protection legislation.
The cloud segment is anticipated to register the fastest CAGR during the forecast period, as the global demand for cloud-based Components increases and these components improve the major advantages of cloud solutions including scalability, flexibility, and cost-effectiveness. Multi-cloud and hybrid cloud strategies are gaining popularity among organizations to leverage the benefits of multiple cloud providers and complex organization workloads and to mitigate vendor lock-in risk. Data-wrangling Components enabling these strategies should increasingly gain traction.
By Enterprise Size
The large enterprise segment dominated the market and accounted for a significant revenue share in 2023, The data wrangling tools and Components are being adopted by large enterprises handling large data volumes with complex data infrastructure. In addition to that, large enterprises usually have complicated data infrastructures with numerous sources and systems of data.
The SME segment is expected to have the fastest CAGR during the forecast period. This segment of the market is the version of data wrangling tools and Components targeted at small & medium-sized enterprises organizations. But while the data volumes of SMEs may be smaller than those of a large enterprise, the data needs of an SME can grow quickly.
By End-User
In 2023, the BFSI segment dominated the market and accounted for a significant revenue share. The BFSI sector deals with sensitive information and is highly regulated. Data-wrangling Components have high data security measures and comply with data protection laws. Additionally, BFSI firms demand stringent governance and management frameworks to maintain the accuracy, reliability, and compliance of their data.
The IT and Telecom segment is expected to register the fastest CAGR during the forecasted Period. IT and Telecom companies usually function in multi-layered ecosystems with multiple data sources and systems. Tools for data wrangling assist in the collection and consolidation of data from a range of sources, including CRM systems, billing systems, network logs, and customer support platforms.
Regional Analysis
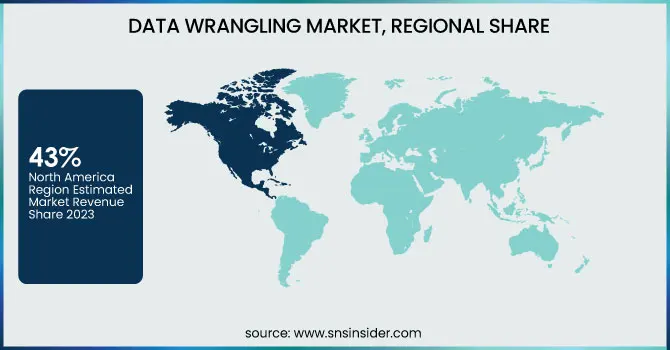
The North American region dominated the market and held a 43% share in 2023, Increasing adoption of automated technologies and AI Components which enhance data processing capabilities are some of the key factors driving the growth of AI in the pathway analysis market. The dominance of the region in the market is due to the presence of key tech companies and a strong commitment to data-driven decision-making in several sectors such as finance, retail, and e-commerce.
The data wrangling market is growing at a very fast pace in the Asia Pacific region due to increased digital technology adoption, the rise of the internet, and the big data analytics emergence there is a rising demand for data wrangling tools and services in the Asia Pacific region. The market is witnessing growth in this region due to industries related to telecommunications, e-commerce, retail, and finance.
Get Customized Report as per Your Business Requirement - Enquiry Now
Key Players
The major key players along with their products are
-
Trifacta – Trifacta Wrangler
-
Talend – Talend Data Preparation
-
IBM – IBM Data Refinery
-
Alteryx – Alteryx Designer
-
Informatica – Informatica Data Preparation
-
DataRobot – DataRobot Paxata
-
TIBCO Software – TIBCO Clarity
-
Microsoft – Power Query (Excel & Power BI)
-
Google – Google Cloud Dataprep
-
Oracle – Oracle Data Integrator
-
AWS – AWS Glue DataBrew
-
SAS Institute – SAS Data Preparation
-
Hitachi Vantara – Pentaho Data Integration
-
Qlik – Qlik Data Integration
-
Datameer – Datameer Spectrum
Recent Developments
October 2024: Technavio projected that the global data wrangling market would expand by USD 1.49 billion between 2024 and 2028, driven by the numerous benefits provided by data wrangling solutions.
|
Report Attributes |
Details |
|
Market Size in 2023 |
USD 3.2 Billion |
|
Market Size by 2032 |
USD 12.6 Billion |
|
CAGR |
CAGR of 16.59% From 2024 to 2032 |
|
Base Year |
2023 |
|
Forecast Period |
2024-2032 |
|
Historical Data |
2020-2022 |
|
Report Scope & Coverage |
Market Size, Segments Analysis, Competitive Landscape, Regional Analysis, DROC & SWOT Analysis, Forecast Outlook |
|
Key Segments |
• By Component (Solution, Services) |
|
Regional Analysis/Coverage |
North America (US, Canada, Mexico), Europe (Eastern Europe [Poland, Romania, Hungary, Turkey, Rest of Eastern Europe] Western Europe] Germany, France, UK, Italy, Spain, Netherlands, Switzerland, Austria, Rest of Western Europe]), Asia Pacific (China, India, Japan, South Korea, Vietnam, Singapore, Australia, Rest of Asia Pacific), Middle East & Africa (Middle East [UAE, Egypt, Saudi Arabia, Qatar, Rest of Middle East], Africa [Nigeria, South Africa, Rest of Africa], Latin America (Brazil, Argentina, Colombia, Rest of Latin America) |
|
Company Profiles |
Trifacta, Talend, IBM, Alteryx, Informatica, DataRobot, TIBCO Software, Microsoft, Google, Oracle, AWS, SAS Institute, Hitachi Vantara, Qlik, Datameer |
