image

Data Collection And Labeling Market Report Scope & Overview:

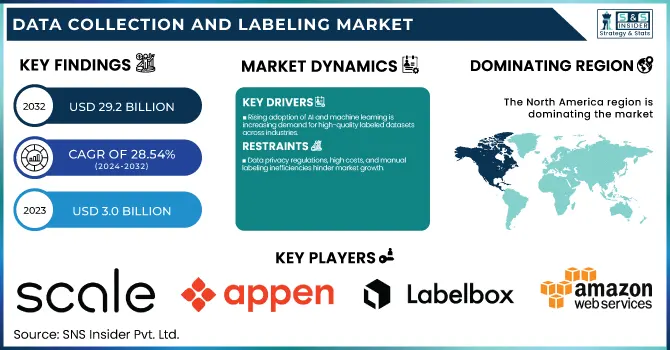
The Data Collection And Labeling Market was valued at USD 3.0 Billion in 2023 and is expected to reach USD 29.2 Billion by 2032, growing at a CAGR of 28.54% from 2024-2032.

Data Collection And Labeling Market Revenue Analysis

To Get more information on Data Collection And Labeling Market - Request Free Sample Report

In 2023, AI-driven data labeling technologies saw increased adoption, enhancing speed and accuracy in annotation. Regional deployment of data annotation platforms showed North America and Asia-Pacific leading in AI adoption. AI and automation's impact on labeling efficiency improved processing large datasets while minimizing manual work. Meanwhile, crowdsourced data labeling services grew, offering scalable and cost-effective human-in-the-loop solutions. The latest report highlights a shift toward hybrid models that blend AI automation with human oversight, improving accuracy and efficiency in data labeling.

Data Collection And Labeling Market Dynamics

Drivers

  • Rising adoption of AI and machine learning is increasing demand for high-quality labeled datasets across industries.

There is a need for high-quality labeled datasets across industries due to the increasing adoption of AI and machine learning. As more companies look to train AI models for things like self-driving cars, medical diagnostics or natural language processing, data annotation is becoming. Automated as well as AI-driven data labeling tools have made the process more efficient, which in turn has reduced the time and cost of manual labeling. At the same time, the rapid growth of sectors including e-commerce, social media, and customer analytics is creating an insatiable demand for massive amounts of labeled data. Cloud-based platforms have allowed organizations to adopt scalable solutions for real-time data labeling, which will accommodate faster market expansion.

Restraints: 

  • Data privacy regulations, high costs, and manual labeling inefficiencies hinder market growth.

Although it is being adopted slowly, we are bound to face non-trivial challenges regarding data collection, data labeling, data privacy, data security, and compliance. Regulations like GDPR and CCPA have a real impact on what you can do with user data, and the number of usable high-quality datasets out there is few and far between. Although manual labeling has been labor-intensive and error-prone, lowering accuracy and scalability. High expenses of proficient annotators as well as cutting-edge AI-driven tagging solutions can be challenging for small-to-mid-sized organizations. Bias data and its effect on the decision-making process of AI is another ethical issue that largely restrains the digital workforce, which forces organizations to implement transparent data labeling practices properly, according to the information they desire.

Opportunities: 

  • AI-driven automation and self-supervised learning enhance scalability and accuracy in data labeling.

The growing penetration of AI-powered automation in data labeling, coupled with the enormous scope, creates lucrative growth opportunities in the market. The latency will be reduced, and costs will be lower because of the combination of AI-powered annotation tools with a human-in-the-loop model that provides a trade-off between the accuracy and costs. Self-supervised and semi-supervised learning grows the capability of an AI model to label data with little or no human input while providing strong scalability. New healthcare, robotics, and autonomous systems applications continue to open fresh use cases. Furthermore, the growth of edge computing and IoT devices naturally produces massive volumes of unstructured data, creating opportunities for AI-enabled data-labeling solutions to optimize real-time processing and analysis.

Challenges: 

  • Ensuring data quality, managing large datasets, and addressing cybersecurity risks remain key concerns.

Maintaining the quality and the consistency of the data is one of the main challenges that the data collection and labeling market has to face. Human errors in labeling can cause adverse effects when feeding into AI models as the learning data is biased. Full-scale, heterogeneous text corpora in multiple languages and domains require a huge amount of resources, which makes for a consistently standardized labeling process problematic to implement. The increasing complexity of the models themselves is another hurdle requiring more complex labelled datasets. In addition, malicious actors may target these data annotation platforms as well, undermining the integrity and confidentiality of data. Addressing these hurdles demands constant automation innovation, rigorous quality controls, and secure frameworks.

Data Collection And Labeling Market Segmentation Analysis

By Data Type

In 2023, the image/video segment led the global market with a revenue share of more than 41%, attributed to the growing need for high-quality annotated visual data to train AI and machine learning models. Industries from autonomous driving to facial recognition and healthcare diagnostics depend on images and videos with annotations to train their algorithms to identify patterns accurately.

The text is expected to register the fastest CAGR During the forecast period, which has been driven by the demand for natural language processing and sentiment analysis across a wide range of sectors. High-quality labeled text data is necessary for training language understanding, chatbot, translation, and voice recognition models as businesses across finance, customer service, healthcare, and e-commerce increasingly embrace AI-driven tools.

By Vertical

In 2023, the IT segment dominated the market and accounted for significant revenue share. Driven by the increasing adoption of artificial intelligence and machine learning across the sector to automate and optimize business processes. As organizations see more value in AI-driven insights for their day-to-day operations, labeling data accurately — a key step that underpins the effectiveness of the algorithms and models — has become more critical than ever, driving demand. Labeled data is widely used in the IT industry for a variety of applications including predictive analytics, cybersecurity and IT automation, making accurate data labeling critical to improving the effectiveness of algorithms.

The automotive segment is expected to register the fastest CAGR during the period of forecast, with advanced driver-assistance systems. Automakers, technology companies and startups need high volume, accurately labeled image and sensor data to train neural networks and AI models to perform functions like object detection, lane recognition and pedestrian safety under normal driving scenarios.
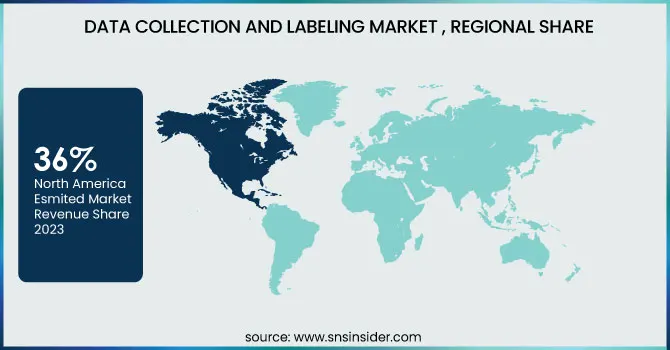
Regional Analysis

North America dominated the market and accounted for 36% in 2023, owing to the region's high level of technological development and strong demand for AI and machine learning applications. North America is home to tech giants and AI research centers and has high demand for labeled data to support innovations across automotive, health, and retail industries.

The Asia Pacific region is also expected to see the fastest CAGR in the data collection and labeling industry over the forecast period, due to accelerated technology growth and a growing digital economy. Moreover, in countries such as China and India, the latent investment in AI research and development has led to a flourishing market of data annotation start-ups.

Data-Collection-And-Labeling-Market--Regional

Get Customized Report as per Your Business Requirement - Enquiry Now

Key Players

The major key players along with their products are

  • Scale AI – Scale Data Engine

  • Appen – Appen Data Annotation Platform

  • Labelbox – Labelbox AI Annotation Platform

  • Amazon Web Services (AWS) – Amazon SageMaker Ground Truth

  • Google – Google Cloud AutoML Data Labeling Service

  • IBM – IBM Watson Data Annotation

  • Microsoft – Azure Machine Learning Data Labeling

  • Playment (by TELUS International AI) – Playment Annotation Platform

  • Hive AI – Hive Data Labeling Platform

  • Samasource – Sama AI Data Annotation

  • CloudFactory – CloudFactory Data Labeling Services

  • SuperAnnotate – SuperAnnotate AI Annotation Tool

  • iMerit – iMerit Data Enrichment Services

  • Figure Eight (by Appen) – Figure Eight Data Labeling

  • Cogito Tech – Cogito Data Annotation Services

Recent Developments

  • In November 2024, Uber launched its "Scaled Solutions" division, leveraging gig workers for data labeling tasks to support machine learning and AI models. This initiative extends Uber's business model into the AI sector, offering services like data annotation and feature testing to external clients. 

  • In 2024, Scale AI continued to grow, employing over 100,000 contractors worldwide for data labeling tasks essential in training AI models. This expansion has positioned Scale AI as a significant player in the AI data annotation industry.

Data Collection And Labeling Market Report Scope:

Report Attributes

Details

Market Size in 2023

USD 3.0 Billion

Market Size by 2032

USD 29.2  Billion

CAGR

CAGR of 28.54% From 2024 to 2032

Base Year

2023

Forecast Period

2024-2032

Historical Data

2020-2022

Report Scope & Coverage

Market Size, Segments Analysis, Competitive  Landscape, Regional Analysis, DROC & SWOT Analysis, Forecast Outlook

Key Segments

•  By Data Type (Text, Image/Video, Audio)
•  By Vertical (IT, Automotive, Government, Healthcare, BFSI, Retail & E-commerce, Others)

Regional Analysis/Coverage

North America (US, Canada, Mexico), Europe (Eastern Europe [Poland, Romania, Hungary, Turkey, Rest of Eastern Europe] Western Europe] Germany, France, UK, Italy, Spain, Netherlands, Switzerland, Austria, Rest of Western Europe]), Asia Pacific (China, India, Japan, South Korea, Vietnam, Singapore, Australia, Rest of Asia Pacific), Middle East & Africa (Middle East [UAE, Egypt, Saudi Arabia, Qatar, Rest of Middle East], Africa [Nigeria, South Africa, Rest of Africa], Latin America (Brazil, Argentina, Colombia, Rest of Latin America)

Company Profiles

Scale AI, Appen, Labelbox, Amazon Web Services (AWS), Google, IBM, Microsoft, Playment (by TELUS International AI), Hive AI, Samasource, CloudFactory, SuperAnnotate, iMerit, Figure Eight (by Appen), Cogito Tech

Frequently Asked Questions

Ans- The Data Collection and Labeling Market was valued at USD 3.0 Billion in 2023 and is expected to reach USD 29.2 Billion by 2032

Ans- The CAGR of the Data Collection And Labeling Market during the forecast period is 28.54% from 2024-2032.

Ans- Asia-Pacific is expected to register the fastest CAGR during the forecast period.

Ans- Rising adoption of AI and machine learning is increasing demand for high-quality labeled datasets across industries.

Ans- Ensuring data quality, managing large datasets, and addressing cybersecurity risks remain key concerns.

Table of Content

1. Introduction

1.1 Market Definition

1.2 Scope (Inclusion and Exclusions)

1.3 Research Assumptions

2. Executive Summary

2.1 Market Overview

2.2 Regional Synopsis

2.3 Competitive Summary

3. Research Methodology

3.1 Top-Down Approach

3.2 Bottom-up Approach

3.3. Data Validation

3.4 Primary Interviews

4. Market Dynamics Impact Analysis

4.1 Market Driving Factors Analysis

4.1.2 Drivers

4.1.2 Restraints

4.1.3 Opportunities

4.1.4 Challenges

4.2 PESTLE Analysis

4.3 Porter’s Five Forces Data Type

5. Statistical Insights and Trends Reporting

5.1 Adoption Rates of AI-driven Data Labeling Technologies, 2023

5.2 Data Annotation Platform Deployment, by Region

5.3 Impact of AI and Automation on Data Labeling Efficiency

5.4 Growth of Crowdsourced Data Labeling Services, 2023

6. Competitive Landscape

6.1 List of Major Companies, By Region

6.2 Market Share Analysis, By Region

6.3 Product Benchmarking

6.3.1 Product specifications and features

6.3.2 Pricing

6.4 Strategic Initiatives

6.4.1 Marketing and promotional activities

6.4.2 Distribution and supply chain strategies

6.4.3 Expansion plans and new product launches

6.4.4 Strategic partnerships and collaborations

6.5 Technological Advancements

6.6 Market Positioning and Branding

7. Data Collection And Labeling Market Segmentation, by Data Type

7.1 Chapter Overview

7.2 Text

7.2.1 Text Market Trends Analysis (2020-2032)

7.2.2 Text Market Size Estimates and Forecasts to 2032 (USD Billion)

7.3 Image/Video

7.3.1 Image/Video Market Trends Analysis (2020-2032)

7.3.2 Image/Video Market Size Estimates and Forecasts to 2032 (USD Billion)

7.4 Audio

7.4.1 Audio Market Trends Analysis (2020-2032)

7.4.2 Audio Market Size Estimates and Forecasts to 2032 (USD Billion)

8. Data Collection And Labeling Market Segmentation, by Vertical

8.1 Chapter Overview

8.2 IT

8.2.1 IT Market Trends Analysis (2020-2032)

8.2.2 IT Market Size Estimates and Forecasts to 2032 (USD Billion)

8.3 Automotive

8.3.1Automotive Market Trends Analysis (2020-2032)

8.3.2Automotive Market Size Estimates and Forecasts to 2032 (USD Billion)

8.4 Government

8.4.1Government Market Trends Analysis (2020-2032)

8.4.2Government Market Size Estimates and Forecasts to 2032 (USD Billion)

8.5 Healthcare

8.5.1Healthcare Market Trends Analysis (2020-2032)

8.5.2Healthcare Market Size Estimates and Forecasts to 2032 (USD Billion)

8.6 BFSI

8.6.1BFSI Market Trends Analysis (2020-2032)

8.6.2BFSI Market Size Estimates and Forecasts to 2032 (USD Billion)

8.7 Retail & E-commerce

8.7.1Retail & E-commerce Market Trends Analysis (2020-2032)

8.7.2Retail & E-commerce Market Size Estimates and Forecasts to 2032 (USD Billion)

8.8 Others

8.8.1Others Market Trends Analysis (2020-2032)

8.8.2Others Market Size Estimates and Forecasts to 2032 (USD Billion)

9. Regional Analysis

9.1 Chapter Overview

9.2 North America

9.2.1 Trends Analysis

9.2.2 North America Data Collection And Labeling Market Estimates and Forecasts, by Country (2020-2032) (USD Billion)

9.2.3 North America Data Collection And Labeling Market Estimates and Forecasts, by Data Type (2020-2032) (USD Billion) 

9.2.4 North America Data Collection And Labeling Market Estimates and Forecasts, by Vertical (2020-2032) (USD Billion)

9.2.5 USA

9.2.5.1 USA Data Collection And Labeling Market Estimates and Forecasts, by Data Type (2020-2032) (USD Billion)

9.2.5.2 USA Data Collection And Labeling Market Estimates and Forecasts, by Vertical (2020-2032) (USD Billion)

9.2.6 Canada

9.2.6.1 Canada Data Collection And Labeling Market Estimates and Forecasts, by Data Type (2020-2032) (USD Billion)

9.2.6.2 Canada Data Collection And Labeling Market Estimates and Forecasts, by Vertical (2020-2032) (USD Billion)

9.2.7 Mexico

9.2.7.1 Mexico Data Collection And Labeling Market Estimates and Forecasts, by Data Type (2020-2032) (USD Billion)

9.2.7.2 Mexico Data Collection And Labeling Market Estimates and Forecasts, by Vertical (2020-2032) (USD Billion)

9.3 Europe

9.3.1 Eastern Europe

9.3.1.1 Trends Analysis

9.3.1.2 Eastern Europe Data Collection And Labeling Market Estimates and Forecasts, by Country (2020-2032) (USD Billion)

9.3.1.3 Eastern Europe Data Collection And Labeling Market Estimates and Forecasts, by Data Type (2020-2032) (USD Billion) 

9.3.1.4 Eastern Europe Data Collection And Labeling Market Estimates and Forecasts, by Vertical (2020-2032) (USD Billion)

9.3.1.5 Poland

9.3.1.5.1 Poland Data Collection And Labeling Market Estimates and Forecasts, by Data Type (2020-2032) (USD Billion)

9.3.1.5.2 Poland Data Collection And Labeling Market Estimates and Forecasts, by Vertical (2020-2032) (USD Billion)

9.3.1.6 Romania

9.3.1.6.1 Romania Data Collection And Labeling Market Estimates and Forecasts, by Data Type (2020-2032) (USD Billion)

9.3.1.6.2 Romania Data Collection And Labeling Market Estimates and Forecasts, by Vertical (2020-2032) (USD Billion)

9.3.1.7 Hungary

9.3.1.7.1 Hungary Data Collection And Labeling Market Estimates and Forecasts, by Data Type (2020-2032) (USD Billion)

9.3.1.7.2 Hungary Data Collection And Labeling Market Estimates and Forecasts, by Vertical (2020-2032) (USD Billion)

9.3.1.8 Turkey

9.3.1.8.1 Turkey Data Collection And Labeling Market Estimates and Forecasts, by Data Type (2020-2032) (USD Billion)

9.3.1.8.2 Turkey Data Collection And Labeling Market Estimates and Forecasts, by Vertical (2020-2032) (USD Billion)

9.3.1.9 Rest of Eastern Europe

9.3.1.9.1 Rest of Eastern Europe Data Collection And Labeling Market Estimates and Forecasts, by Data Type (2020-2032) (USD Billion)

9.3.1.9.2 Rest of Eastern Europe Data Collection And Labeling Market Estimates and Forecasts, by Vertical (2020-2032) (USD Billion)

9.3.2 Western Europe

9.3.2.1 Trends Analysis

9.3.2.2 Western Europe Data Collection And Labeling Market Estimates and Forecasts, by Country (2020-2032) (USD Billion)

9.3.2.3 Western Europe Data Collection And Labeling Market Estimates and Forecasts, by Data Type (2020-2032) (USD Billion) 

9.3.2.4 Western Europe Data Collection And Labeling Market Estimates and Forecasts, by Vertical (2020-2032) (USD Billion)

9.3.2.5 Germany

9.3.2.5.1 Germany Data Collection And Labeling Market Estimates and Forecasts, by Data Type (2020-2032) (USD Billion)

9.3.2.5.2 Germany Data Collection And Labeling Market Estimates and Forecasts, by Vertical (2020-2032) (USD Billion)

9.3.2.6 France

9.3.2.6.1 France Data Collection And Labeling Market Estimates and Forecasts, by Data Type (2020-2032) (USD Billion)

9.3.2.6.2 France Data Collection And Labeling Market Estimates and Forecasts, by Vertical (2020-2032) (USD Billion)

9.3.2.7 UK

9.3.2.7.1 UK Data Collection And Labeling Market Estimates and Forecasts, by Data Type (2020-2032) (USD Billion)

9.3.2.7.2 UK Data Collection And Labeling Market Estimates and Forecasts, by Vertical (2020-2032) (USD Billion)

9.3.2.8 Italy

9.3.2.8.1 Italy Data Collection And Labeling Market Estimates and Forecasts, by Data Type (2020-2032) (USD Billion)

9.3.2.8.2 Italy Data Collection And Labeling Market Estimates and Forecasts, by Vertical (2020-2032) (USD Billion)

9.3.2.9 Spain

9.3.2.9.1 Spain Data Collection And Labeling Market Estimates and Forecasts, by Data Type (2020-2032) (USD Billion)

9.3.2.9.2 Spain Data Collection And Labeling Market Estimates and Forecasts, by Vertical (2020-2032) (USD Billion)

9.3.2.10 Netherlands

9.3.2.10.1 Netherlands Data Collection And Labeling Market Estimates and Forecasts, by Data Type (2020-2032) (USD Billion)

9.3.2.10.2 Netherlands Data Collection And Labeling Market Estimates and Forecasts, by Vertical (2020-2032) (USD Billion)

9.3.2.11 Switzerland

9.3.2.11.1 Switzerland Data Collection And Labeling Market Estimates and Forecasts, by Data Type (2020-2032) (USD Billion)

9.3.2.11.2 Switzerland Data Collection And Labeling Market Estimates and Forecasts, by Vertical (2020-2032) (USD Billion)

9.3.2.12 Austria

9.3.2.12.1 Austria Data Collection And Labeling Market Estimates and Forecasts, by System (2020-2032) (USD Billion)

9.3.2.12.2 Austria Data Collection And Labeling Market Estimates and Forecasts, by Vertical (2020-2032) (USD Billion)

9.3.2.13 Rest of Western Europe

9.3.2.13.1 Rest of Western Europe Data Collection And Labeling Market Estimates and Forecasts, by Data Type (2020-2032) (USD Billion)

9.3.2.13.2 Rest of Western Europe Data Collection And Labeling Market Estimates and Forecasts, by Vertical (2020-2032) (USD Billion)

9.4 Asia Pacific

9.4.1 Trends Analysis

9.4.2 Asia Pacific Data Collection And Labeling Market Estimates and Forecasts, by Country (2020-2032) (USD Billion)

9.4.3 Asia Pacific Data Collection And Labeling Market Estimates and Forecasts, by Data Type (2020-2032) (USD Billion) 

9.4.4 Asia Pacific Data Collection And Labeling Market Estimates and Forecasts, by Vertical (2020-2032) (USD Billion)

9.4.5 China

9.4.5.1 China Data Collection And Labeling Market Estimates and Forecasts, by Data Type (2020-2032) (USD Billion)

9.4.5.2 China Data Collection And Labeling Market Estimates and Forecasts, by Vertical (2020-2032) (USD Billion)

9.4.6 India

9.4.5.1 India Data Collection And Labeling Market Estimates and Forecasts, by Data Type (2020-2032) (USD Billion)

9.4.5.2 India Data Collection And Labeling Market Estimates and Forecasts, by Vertical (2020-2032) (USD Billion)

9.4.5 Japan

9.4.5.1 Japan Data Collection And Labeling Market Estimates and Forecasts, by Data Type (2020-2032) (USD Billion)

9.4.5.2 Japan Data Collection And Labeling Market Estimates and Forecasts, by Vertical (2020-2032) (USD Billion)

9.4.6 South Korea

9.4.6.1 South Korea Data Collection And Labeling Market Estimates and Forecasts, by Data Type (2020-2032) (USD Billion)

9.4.6.2 South Korea Data Collection And Labeling Market Estimates and Forecasts, by Vertical (2020-2032) (USD Billion)

9.4.7 Vietnam

9.4.7.1 Vietnam Data Collection And Labeling Market Estimates and Forecasts, by Data Type (2020-2032) (USD Billion)

9.2.7.2 Vietnam Data Collection And Labeling Market Estimates and Forecasts, by Vertical (2020-2032) (USD Billion)

9.4.8 Singapore

9.4.8.1 Singapore Data Collection And Labeling Market Estimates and Forecasts, by Data Type (2020-2032) (USD Billion)

9.4.8.2 Singapore Data Collection And Labeling Market Estimates and Forecasts, by Vertical (2020-2032) (USD Billion)

9.4.9 Australia

9.4.9.1 Australia Data Collection And Labeling Market Estimates and Forecasts, by Data Type (2020-2032) (USD Billion)

9.4.9.2 Australia Data Collection And Labeling Market Estimates and Forecasts, by Vertical (2020-2032) (USD Billion)

9.4.10 Rest of Asia Pacific

9.4.10.1 Rest of Asia Pacific Data Collection And Labeling Market Estimates and Forecasts, by Data Type (2020-2032) (USD Billion)

9.4.10.2 Rest of Asia Pacific Data Collection And Labeling Market Estimates and Forecasts, by Vertical (2020-2032) (USD Billion)

9.5 Middle East and Africa

9.5.1 Middle East

9.5.1.1 Trends Analysis

9.5.1.2 Middle East Data Collection And Labeling Market Estimates and Forecasts, by Country (2020-2032) (USD Billion)

9.5.1.3 Middle East Data Collection And Labeling Market Estimates and Forecasts, by Data Type (2020-2032) (USD Billion) 

9.5.1.4 Middle East Data Collection And Labeling Market Estimates and Forecasts, by Vertical (2020-2032) (USD Billion)

9.5.1.5 UAE

9.5.1.5.1 UAE Data Collection And Labeling Market Estimates and Forecasts, by Data Type (2020-2032) (USD Billion)

9.5.1.5.2 UAE Data Collection And Labeling Market Estimates and Forecasts, by Vertical (2020-2032) (USD Billion)

9.5.1.6 Egypt

9.5.1.6.1 Egypt Data Collection And Labeling Market Estimates and Forecasts, by Data Type (2020-2032) (USD Billion)

9.5.1.6.2 Egypt Data Collection And Labeling Market Estimates and Forecasts, by Vertical (2020-2032) (USD Billion)

9.5.1.7 Saudi Arabia

9.5.1.7.1 Saudi Arabia Data Collection And Labeling Market Estimates and Forecasts, by Data Type (2020-2032) (USD Billion)

9.5.1.7.2 Saudi Arabia Data Collection And Labeling Market Estimates and Forecasts, by Vertical (2020-2032) (USD Billion)

9.5.1.8 Qatar

9.5.1.8.1 Qatar Data Collection And Labeling Market Estimates and Forecasts, by Data Type (2020-2032) (USD Billion)

9.5.1.8.2 Qatar Data Collection And Labeling Market Estimates and Forecasts, by Vertical (2020-2032) (USD Billion)

9.5.1.9 Rest of Middle East

9.5.1.9.1 Rest of Middle East Data Collection And Labeling Market Estimates and Forecasts, by Data Type (2020-2032) (USD Billion)

9.5.1.9.2 Rest of Middle East Data Collection And Labeling Market Estimates and Forecasts, by Vertical (2020-2032) (USD Billion)

9.5.2 Africa

9.5.2.1 Trends Analysis

9.5.2.2 Africa Data Collection And Labeling Market Estimates and Forecasts, by Country (2020-2032) (USD Billion)

9.5.2.3 Africa Data Collection And Labeling Market Estimates and Forecasts, by Data Type (2020-2032) (USD Billion) 

9.5.2.4 Africa Data Collection And Labeling Market Estimates and Forecasts, by Vertical (2020-2032) (USD Billion)

9.5.2.5 South Africa

9.5.2.5.1 South Africa Data Collection And Labeling Market Estimates and Forecasts, by Data Type (2020-2032) (USD Billion)

9.5.2.5.2 South Africa Data Collection And Labeling Market Estimates and Forecasts, by Vertical (2020-2032) (USD Billion)

9.5.2.6 Nigeria

9.5.2.6.1 Nigeria Data Collection And Labeling Market Estimates and Forecasts, by Data Type (2020-2032) (USD Billion)

9.5.2.6.2 Nigeria Data Collection And Labeling Market Estimates and Forecasts, by Vertical (2020-2032) (USD Billion)

9.5.2.7 Rest of Africa

9.5.2.7.1 Rest of Africa Data Collection And Labeling Market Estimates and Forecasts, by Data Type (2020-2032) (USD Billion)

9.5.2.7.2 Rest of Africa Data Collection And Labeling Market Estimates and Forecasts, by Vertical (2020-2032) (USD Billion)

9.6 Latin America

9.6.1 Trends Analysis

9.6.2 Latin America Data Collection And Labeling Market Estimates and Forecasts, by Country (2020-2032) (USD Billion)

9.6.3 Latin America Data Collection And Labeling Market Estimates and Forecasts, by Data Type (2020-2032) (USD Billion) 

9.6.4 Latin America Data Collection And Labeling Market Estimates and Forecasts, by Vertical (2020-2032) (USD Billion)

9.6.5 Brazil

9.6.5.1 Brazil Data Collection And Labeling Market Estimates and Forecasts, by Data Type (2020-2032) (USD Billion)

9.6.5.2 Brazil Data Collection And Labeling Market Estimates and Forecasts, by Vertical (2020-2032) (USD Billion)

9.6.6 Argentina

9.6.6.1 Argentina Data Collection And Labeling Market Estimates and Forecasts, by Data Type (2020-2032) (USD Billion)

9.6.6.2 Argentina Data Collection And Labeling Market Estimates and Forecasts, by Vertical (2020-2032) (USD Billion)

9.6.7 Colombia

9.6.7.1 Colombia Data Collection And Labeling Market Estimates and Forecasts, by Data Type (2020-2032) (USD Billion)

9.6.7.2 Colombia Data Collection And Labeling Market Estimates and Forecasts, by Vertical (2020-2032) (USD Billion)

9.6.8 Rest of Latin America

9.6.8.1 Rest of Latin America Data Collection And Labeling Market Estimates and Forecasts, by Data Type (2020-2032) (USD Billion)

9.6.8.2 Rest of Latin America Data Collection And Labeling Market Estimates and Forecasts, by Vertical (2020-2032) (USD Billion)

10. Company Profiles

10.1 Scale AI

              10.1.1 Company Overview

10.1.2 Financial

10.1.3 Products/ Services Offered

110.1.4 SWOT Analysis

10.2 Appen

10.2.1 Company Overview

10.2.2 Financial

10.2.3 Products/ Services Offered

10.2.4 SWOT Analysis

10.3 Labelbox

              10.3.1 Company Overview

10.3.2 Financial

10.3.3 Products/ Services Offered

10.3.4 SWOT Analysis

10.4 Amazon Web Services (AWS)

10.4.1 Company Overview

10.4.2 Financial

10.4.3 Products/ Services Offered

10.4.4 SWOT Analysis

10.5 Google

               10.5.1 Company Overview

10.5.2 Financial

10.5.3 Products/ Services Offered

10.5.4 SWOT Analysis

10.6 IBM

              10.6.1 Company Overview

10.6.2 Financial

10.6.3 Products/ Services Offered

10.6.4 SWOT Analysis

10.7 Microsoft

             10.7.1 Company Overview

10.7.2 Financial

10.7.3 Products/ Services Offered

10.7.4 SWOT Analysis

10.8 Playment (by TELUS International AI)

              10.8.1 Company Overview

10.8.2 Financial

10.8.3 Products/ Services Offered

10.8.4 SWOT Analysis

10.9 IBM 

10.9.1 Company Overview

10.9.2 Financial

10.9.3 Products/ Services Offered

10.9.4 SWOT Analysis

10.10 Hive AI

             10.9.1 Company Overview

10.9.2 Financial

10.9.3 Products/ Services Offered

10.9.4 SWOT Analysis

11. Use Cases and Best Practices

12. Conclusion

An accurate research report requires proper strategizing as well as implementation. There are multiple factors involved in the completion of good and accurate research report and selecting the best methodology to compete the research is the toughest part. Since the research reports we provide play a crucial role in any company’s decision-making process, therefore we at SNS Insider always believe that we should choose the best method which gives us results closer to reality. This allows us to reach at a stage wherein we can provide our clients best and accurate investment to output ratio.

Each report that we prepare takes a timeframe of 350-400 business hours for production. Starting from the selection of titles through a couple of in-depth brain storming session to the final QC process before uploading our titles on our website we dedicate around 350 working hours. The titles are selected based on their current market cap and the foreseen CAGR and growth.


The 5 steps process:

Step 1: Secondary Research:

Secondary Research or Desk Research is as the name suggests is a research process wherein, we collect data through the readily available information. In this process we use various paid and unpaid databases which our team has access to and gather data through the same. This includes examining of listed companies’ annual reports, Journals, SEC filling etc. Apart from this our team has access to various associations across the globe across different industries. Lastly, we have exchange relationships with various university as well as individual libraries.

Secondary Research

Step 2: Primary Research

When we talk about primary research, it is a type of study in which the researchers collect relevant data samples directly, rather than relying on previously collected data.  This type of research is focused on gaining content specific facts that can be sued to solve specific problems. Since the collected data is fresh and first hand therefore it makes the study more accurate and genuine.

We at SNS Insider have divided Primary Research into 2 parts.

Part 1 wherein we interview the KOLs of major players as well as the upcoming ones across various geographic regions. This allows us to have their view over the market scenario and acts as an important tool to come closer to the accurate market numbers. As many as 45 paid and unpaid primary interviews are taken from both the demand and supply side of the industry to make sure we land at an accurate judgement and analysis of the market.

This step involves the triangulation of data wherein our team analyses the interview transcripts, online survey responses and observation of on filed participants. The below mentioned chart should give a better understanding of the part 1 of the primary interview.

Primary Research

Part 2: In this part of primary research the data collected via secondary research and the part 1 of the primary research is validated with the interviews from individual consultants and subject matter experts.

Consultants are those set of people who have at least 12 years of experience and expertise within the industry whereas Subject Matter Experts are those with at least 15 years of experience behind their back within the same space. The data with the help of two main processes i.e., FGDs (Focused Group Discussions) and IDs (Individual Discussions). This gives us a 3rd party nonbiased primary view of the market scenario making it a more dependable one while collation of the data pointers.

Step 3: Data Bank Validation

Once all the information is collected via primary and secondary sources, we run that information for data validation. At our intelligence centre our research heads track a lot of information related to the market which includes the quarterly reports, the daily stock prices, and other relevant information. Our data bank server gets updated every fortnight and that is how the information which we collected using our primary and secondary information is revalidated in real time.

Data Bank Validation

Step 4: QA/QC Process

After all the data collection and validation our team does a final level of quality check and quality assurance to get rid of any unwanted or undesired mistakes. This might include but not limited to getting rid of the any typos, duplication of numbers or missing of any important information. The people involved in this process include technical content writers, research heads and graphics people. Once this process is completed the title gets uploader on our platform for our clients to read it.

Step 5: Final QC/QA Process:

This is the last process and comes when the client has ordered the study. In this process a final QA/QC is done before the study is emailed to the client. Since we believe in giving our clients a good experience of our research studies, therefore, to make sure that we do not lack at our end in any way humanly possible we do a final round of quality check and then dispatch the study to the client.

Key Segmentation:

By Data Type

  • Text

  • Image/Video

  • Audio

By Vertical

  • IT

  • Automotive

  • Government

  • Healthcare

  • BFSI

  • Retail & E-commerce

  • Others

Request for Segment Customization as per your Business Requirement: Segment Customization Request

Regional Coverage:

North America

  • US

  • Canada

  • Mexico

Europe

  • Eastern Europe

    • Poland

    • Romania

    • Hungary

    • Turkey

    • Rest of Eastern Europe

  • Western Europe

    • Germany

    • France

    • UK

    • Italy

    • Spain

    • Netherlands

    • Switzerland

    • Austria

    • Rest of Western Europe

Asia Pacific

  • China

  • India

  • Japan

  • South Korea

  • Vietnam

  • Singapore

  • Australia

  • Rest of Asia Pacific

Middle East & Africa

  • Middle East

    • UAE

    • Egypt

    • Saudi Arabia

    • Qatar

    • Rest of Middle East

  • Africa

    • Nigeria

    • South Africa

    • Rest of Africa

Latin America

  • Brazil

  • Argentina

  • Colombia

  • Rest of Latin America

Request for Country Level Research Report: Country Level Customization Request

Available Customization

With the given market data, SNS Insider offers customization as per the company’s specific needs. The following customization options are available for the report:

  • Detailed Volume Analysis

  • Criss-Cross segment analysis (e.g. Product X Application)

  • Competitive Product Benchmarking

  • Geographic Analysis

  • Additional countries in any of the regions

  • Customized Data Representation

  • Detailed analysis and profiling of additional market players


  •            5000 (33% Discount)


  •            8950 (40% Discount)


  •            3050 (23% Discount)

Start a Conversation

Hi! Click one of our member below to chat on Phone