Get more information on Data Center Rack Market - Request Free Sample Report
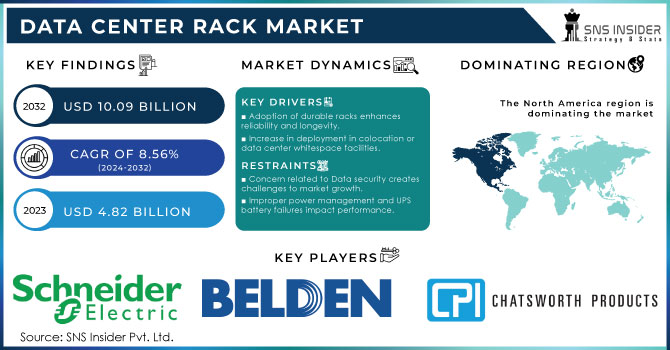
The Data Center Rack Market Size was valued at USD 4.46 Billion in 2023 and is expected to reach USD 9.17 Billion by 2032 and grow at a CAGR of 8.34% over the forecast period 2024-2032.
With the rapid growth of digital technologies and solutions, the requirement for efficient IT infrastructure is also on the rise, which is largely driving the data center rack market. The growth of Cloud Computing, Big Data, & IoT has resulted in several users opting for cloud computing and big data analytics is driving the global data center chassis market, as cloud computing, big data analytics, and IoT need scalable & high-performance data centers. Whether it is table staking or servicing a gaming machine digital transformation has stepped into organizations across industries and businesses of all scales which demands digital infrastructures with advanced data center facilities and reliable racks that assemble servers, routing equipment, and IT components. Additionally, the rising proliferation of edge computing to reduce latency and enhance real-time data processing is a key element propelling the product investment trend towards compact, modular racks, especially for edge data centers. The North America data center supply under construction increased 70% quarterly with a total of 3.9 gigawatts. In North America, vacancy rates for data centers plunged to an unprecedented 2.8%, and the rents soared by 15-20%. Edge data center demand grew 30% fueled by edge computing and 40-50% of new racks were intended for higher density servers to improve space and power efficiency.
Additional growth factors include the increase in 5G network deployment and the increasing expansion of hyperscale data centers by technology and cloud service giants. With more businesses turning to AI, ML, and HPC, high-density racks that support advanced hardware are in demand. Moreover, the increased emphasis on energy efficiency and sustainability within data centers has resulted in new rack designs that utilize power and cooling more efficiently. Together with the rising IT spending and the growing demand for colocation services, these trends are fuelling the data center rack market. As of mid-2024, there were 316 commercial 5G networks in service worldwide, and in North America, the number of 5G networks is approaching that of 4G LTE at this current point in technology cycles. AI-ready data center capacity demand is expected to increase 33% per annum between 2023 and 2030, with 70% of data center capacity supporting complex AI workloads by 2030.
KEY DRIVERS:
Rising Data Localization Regulations and Cybersecurity Threats Fuel Demand for Advanced Scalable Data Center Racks
The global rise in data localization regulations is one of the most crucial aspects driving the data center rack market. To guarantee businesses keep information close to home, stricter laws are being passed in nations around the globe. This trend has forced organizations to create or scale local data centers that in turn are further creating the requirement for data center racks. These regulations are especially impacted by certain industries that handle sensitive data such as BFSI, healthcare, and government. Businesses are investing in racks to scale up and have scalable IT infrastructure rack that meets data privacy requirements and improves data security. Moreover, the rising data localization mandates are paired with the rising trend of cyber-attacks due to which organizations are adopting advanced racks which can be integrated with monitoring systems and access control and are expected to propel the market growth over the forecast period. In 2024, 75% of the population of the world will be reached by privacy laws and new 100 data localization laws in 40 countries. Average attacks per organization were up 75% in Q3, 2024 (1,876 attacks per organization). These regulations heavily impact industries such as BFSI, healthcare, and government, thereby fuelling the need for advanced and scalable data center racks to meet data privacy and security mandates.
Modular and Prefabricated Data Centers Drive Rapid Deployment Scalability and Efficiency for SMEs and Industries
One of the most pivotal trends is the expanding popularity of modular and prefabricated data centers, which has fundamentally changed the IT infrastructure deployment game. Such modular solutions are inexpensive, scalable, and quicker to deploy than traditional data centers and are therefore very appealing to small and mid-sized enterprises (SMEs). Many prefabricated data centers include racks that are already optimized for space and cooling. This also highlights the growth of demand for these solutions across industries, such as retail, energy, and utilities, where businesses require a quick set-up to adapt to the changing data requirements. Moreover, with enterprises beefing up on initiatives for lowering operational costs, modular racks that support hot-swappable components along with flexible configurations are also witnessing a sale. The rising demand for edge computing is also compounding this trend, as a new, smaller generation of modular data centers and racks is necessary to fulfill local processing requirements. These aforementioned factors when combined help modular racks to be a key driver for the growth of the market. Modular data centers can be set up in 6 to 8 weeks, much quicker compared to traditional data centers deployed in more than a few months in 2024. Due to their ability to scale and be deployed quickly, SMEs now represent 45% of the demand for these solutions. 60% of prefabricated modular data centers come equipped with rack optimization, by ensuring racks are suitable for energy-efficient usage with support for space and cooling. The increasing demand for adaptive IT infrastructure is reflected in the 40% growth over the last year in the adoption of its services in sectors including retail, energy and utilities.
RESTRAIN:
Overcoming Challenges of Thermal Efficiency Scalability and Customization in the Evolving Data Center Rack Market
In the data center rack market, a major challenge is the increasing complexity of thermal & energy efficiency. Fitting more into a space is a developmental aim of data centers but with this high density, controlling heat dissipation is difficult. This is because poor cooling may cause equipment failures, shorten their lifespan, and lead to excessive powering down. As a result, organizations have been forced to procure high-end cooling technologies that do not always perfectly blend in with the existing racks resulting in operational hardships. The most important challenge is the requirement for effortless scalability and personalization. As IT infrastructure and technology are evolving at a fast pace, organizations are looking for racks that provide for future requirements like support of higher densities or hardware types such as GPUs to support AI-related applications. However, the need to balance scalability and legacy system compatibility can be a challenging technical exercise. Additionally, rolling out racks is such a customized task that it can take a long time to roll out, which leaves a lot of bottlenecks when expanding hours, and is thus a hindrance to businesses.
BY RACK TYPE
In 2023, cabinets captured 57.5% of the market share, primarily due to their popular application in both small and large data centers for versatility and high security. In contrast, cabinets keep servers and networking equipment enclosed, safe from dust and physical damage, as well as restrict unauthorized access, making cabinets the choice provider in compliance-driven industries like BFSI, Healthcare, & Government. Cabinets also include integrated cable management and cooling solutions, which help make higher-density deployments more efficient in operation. Their compatibility with nearly all equipment settings makes them ideal for both traditional and hybrid data centers, which serves to further promote their popularity.
The open frame racks segment is projected to record the highest compound annual growth rate (CAGR) over the 2024 to 2032 timeframe due to their lower cost and efficient architecture for edge computing and modular data center deployments. Open frame racks allow easy access to equipment and are suited for environments where frequent maintenance or upgrades are necessary. They allow more airflow, which also minimizes the need for sophisticated cooling systems and makes for an easier operating experience. As applications such as IoT, 5G, and AI drive the need for low latency for processing, edge data centers are becoming mainstream where lightweight and compact open-frame racks can be a feasible option for consideration. In addition, the rise of greater sustainability and energy efficiency focus pairs with open frame racks which utilize less material and provide efficient cooling, rendering them a popular selection for upcoming data center innovation.
BY RACK HEIGHT
The 42U and below segment accounted for the largest market share of 58.7% in 2023 because of its extensive applications in small and medium-sized data centers, colocation facilities, and enterprises. These racks are the industry standard and provide a good combination of price, adaptability, and performance features Due to their small form factor, they are perfect for organizations that have space constraints or need to perform moderate data processing, for example, retail, BFSI, and healthcare verticals. Also, 42U racks are extremely versatile and compatible with servers, switches, storage units, etc. Because of having such traits that offer compatibility with existing infrastructure and ease of deployment, they are dominating the market as of now.
43U up to 52U segment is anticipated to witness the highest CAGR during 2024-2032, due to growing demand for high-density computing in large data centers. With reduced vertical space, these racks allow for more servers and other equipment to be installed in the same footprint of the data center, which is essential for optimizing the effectiveness of operations. Demand for higher-capacity racks is also driven by expansion in IT & telecom, cloud service providers that require high capacity of rack scale for efficient use of AI, IoT, and Big Data applications in industrial processes. In addition, the migration to hyperscale and modular data centers has led to a demand for larger racks with features designed to accommodate high-performance computing solutions and more sophisticated cooling technologies. With a business focus on scalability and ensuring future readiness of IT infrastructure, the 43U to 52U segment has become the hot tub choice of next-generation data centers.
BY RACK WIDTH
The 19-inch racks have the highest market share 67.5% in 2023, because this type of rack is standard in most data center environments and IT infrastructure, These racks are very common because most IT equipment like servers, switches, and routers are designed to fit the 19in width specification. They are suitable across industries such as BFSI, healthcare, retail, and government organizations where standardized and scalable solutions for data storage and processing are required. 19-inch racks are also economical, and widely supported for various cable management and cooling solutions allowing them to operate efficiently in high-density situations. The widespread adoption also ensured their dominance in the market.
The 23-inch racks are expected to have the highest CAGR during the forecast period (2024 — 2032). The extra horizontal space in the racks is great for running IT hardware like AI accelerators, High-performance computing systems, and custom-designed IT hardware. Evolving trends like 23-inch racks filtering down to common usage in several industries including IT & telecom, cloud computing, and energy are allowing for wider adoption due to increasing demand for performance-intensive applications and edge computing. This extra width also paves the way for more airflow and easier cable management, both of which are typically very important in high-density setups. Furthermore, with the growth of data centers and infrastructure upgrades required to support new technologies such as 5G and IoT (Internet of Things), the size and capability of 23-inch racks make them ideal for those looking to futureproof their infrastructure. The 23-inch rack, with its superior scalability, support for advanced functionalities like IP, and the promise of future system advancements all but guarantees the rapid acceptance of 23-inch racks.
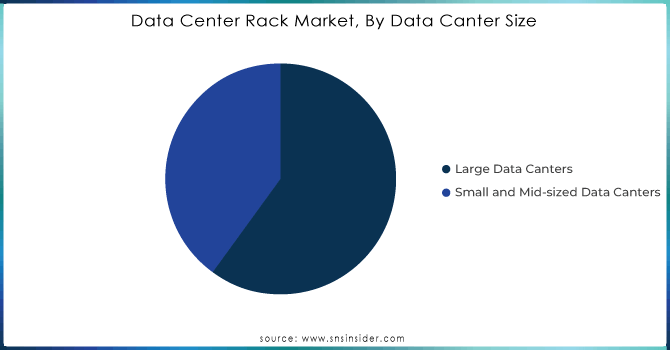
BY DATA CENTER SIZE
In 2023, large data centers captured a whopping 57.3% of the overall market share on account of the rising requirement for higher capacity plants that provide support for upcoming technologies such as cloud computing, artificial intelligence (AI), and big data analytics. Hyperscale providers and enterprises, particularly in IT & telecom, BFSI, and government, set up large data centers to manage a huge amount of data and keep their operations running smoothly. These centers often use very high-density racks to maximize space and power efficiency, accommodating thousands of servers and networking devices. Large data centers, powered with their features to centralize IT resources, enhance operational efficiency, and sustain global data traffic, constitute an essential part of modern IT infrastructure, hence taking market ownership.
Small and mid-sized data centers will register the fastest growth during the forecast period from 2024 to 2032 after the surge in edge computing and intense local data processing activities. As the demand for low-latency infrastructure increases with applications like IoT, self-driving cars, and 5G networks, organizations tend to bring online smaller, distributed data centers closer to end users. Such facilities offer cheaper alternatives to companies wanting to migrate some of their infrastructure without building large, high-cost facilities. Both of these aspects are also galvanizing this segment due to an increase in the adoption of modular and prefabricated data centers which usually serve primarily small and mid-sized data center environments. Various industries are propelling this growth most notably retail, retail, and manufacturing need scalable, on-demand IT solutions that are, for example, responsive to specific operational requirements. The rapid growth of small and mid-sized data centers as a cornerstone of the next-generation data center landscape is fueled by the trend towards distributed, scalable infrastructure.
BY INDUSTRIES
The retail sector accounted for the largest market share in 2023 with a market share of 25.7% of the global in terms of data center rack owing to the rapid expansion of e-commerce, digital payments, and customized customer experience. Data-driven approaches are being used more greatly by retailers, especially in inventory management, consumer behavior tracking, and supply chain process management. Hence, there is increasing demand for data centers to have reliable racks that play host to servers and storage systems. The growing need for omnichannel retail strategies to integrate online and offline sales channels will also drive an increase in investment into data center solutions for the sector, as a modern IT infrastructure is required for successful omnichannel deployment. Those new-age cabinets and related racks are important for housing the critical IT systems and other infrastructure over there as security & compliance are another top priority for retailers due to the nature of sensitive customer data processed over there.
IT & telecom sector to grow at the fastest CAGR during the period 2024-2032. The rapid growth of data traffic generated by connected devices, IoT applications, and real-time communication systems is driving telecom companies to invest heavily in upgrading their infrastructure. This sector is experiencing an increasing need for racks that can accommodate high-density equipment, including servers for AI and machine learning. In addition, IT companies are increasingly adopting hyperscale and colocation data centers to provide scalable and efficient cloud services, which in turn drives the demand for new rack solutions. The IT telecom sector is the fastest-growing segment in the data center rack market as it can host future-ready, high-capacity data centers.
In 2023, North America led the data center rack market with a 43.6% share of the overall market due to the technology infrastructure developments, a large number of hyperscale data centers, and the existence of innovative cloud and AI technologies Tech powerhouses, such as Amazon Web Services (AWS), Microsoft (Azure), Google Cloud, and Meta, are located here, with each rapidly expanding its data center footprints in response to surging data consumption. Furthermore, the presence of established IT markets in the USA and Canada and stringent regulations for data security in North America is increasing the adoption of dependable and secure rack solutions. As reflected by Meta continuing to expand its hyperscale data center footprint in Iowa and Google opening a data center in Nebraska, the region is a major hub for hyperscale data centers.
The Asia-Pacific region will exhibit the highest CAGR over the forecast period of 2024 to 2032, this can be attributed to the fast pace of digital transformation in emerging economies, rising smartphone penetration, and deployment of 5G networks. Nations including China, India, Japan, and Singapore are ramping up data middle creation to aid rising demand for cloud offerings, area computing, and digital ecosystems. China’s Alibaba Cloud, AdaniConneX’s planned data center projects in India, and Google’s new data center in the city of Tokyo, Japan are several current concrete instances. Major cloud providers and telecom companies to react to data sovereignty policies and lower latency requirements have invested strongly in creating local capacity across the Asia-Pacific region–this has also contributed positively to cloud availability in the region. Thus, these factors are making the Asia Pacific one of the key growth enablers for the global data center rack market.
Need any customization research on Data Center Rack Market - Enquiry Now
Some of the major players in the Data Center Rack Market are:
Schneider Electric (NexGen, EcoStruxure IT)
Huawei Technologies (FusionModule, NetEngine)
Rittal (TS IT Rack, LCP)
Vertiv (Liebert DSE, NetSure)
Eaton (Energy Saver, PDU)
Delta Electronics (Rack PDU, InRow AC)
Hewlett Packard Enterprise (ProLiant DL380, Aruba Networks)
IBM (IBM PureFlex, IBM Power Systems)
Intel (Intel Rack Optimized Servers, Intel Xeon Scalable Processors)
American Power Conversion (APC) (Smart-UPS, Rack Power Distribution Unit)
Apc by Schneider Electric (Smart-UPS, Rack PDU)
Legrand (Rackmount PDU, Server Racks)
Cisco Systems (Catalyst Switch, Unified Computing System)
Siemens (Siemens PDU, Sitop PSU)
Tripp Lite (SmartPro UPS, Rackmount Surge Protector)
NetApp (FAS Series, AFF Series)
Samsung Electronics (Smart DCI, SSD Rack Storage)
Zyxel Communications (XGS-PON ONU, Network Switches)
Panduit (NetShelter SX, Rack PDU)
Conteg (C-Rack, CoolCube)
ArcelorMittal
POSCO
ThyssenKrupp
Nippon Steel Corporation
AK Steel (Now part of Cleveland-Cliffs)
Baosteel
SSAB
Alcoa Corporation
Novelis Inc.
Rusal
In March 2024, Rittal launched its TS IT Colo rack initiative to meet the growing demand in the colocation market, offering pre-configured, in-stock solutions for quick delivery and flexible deployment.
In September 2024, Vertiv unveiled its AI-ready modular data center featuring advanced liquid cooling technology, designed to accelerate AI infrastructure deployment by up to 50%.
In March 2024, Eaton launched its SmartRack modular data center solution, designed for rapid deployment and scalable IT infrastructure with integrated cooling and power management.
Report Attributes | Details |
---|---|
Market Size in 2023 |
USD 4.46 Billion |
Market Size by 2032 |
USD 9.17 Billion |
CAGR |
CAGR of 8.34% From 2024 to 2032 |
Base Year |
2023 |
Forecast Period |
2024-2032 |
Historical Data |
2020-2022 |
Report Scope & Coverage |
Market Size, Segments Analysis, Competitive Landscape, Regional Analysis, DROC & SWOT Analysis, Forecast Outlook |
Key Segments |
• By Rack Type (Open Frame, Cabinets) |
Regional Analysis/Coverage |
North America (US, Canada, Mexico), Europe (Eastern Europe [Poland, Romania, Hungary, Turkey, Rest of Eastern Europe] Western Europe] Germany, France, UK, Italy, Spain, Netherlands, Switzerland, Austria, Rest of Western Europe]), Asia Pacific (China, India, Japan, South Korea, Vietnam, Singapore, Australia, Rest of Asia Pacific), Middle East & Africa (Middle East [UAE, Egypt, Saudi Arabia, Qatar, Rest of Middle East], Africa [Nigeria, South Africa, Rest of Africa], Latin America (Brazil, Argentina, Colombia, Rest of Latin America) |
Company Profiles |
Schneider Electric, Huawei Technologies, Rittal, Vertiv, Eaton, Delta Electronics, Hewlett Packard Enterprise, IBM, Intel, American Power Conversion, Apc by Schneider Electric, Legrand, Cisco Systems, Siemens, Tripp Lite, NetApp, Samsung Electronics, Zyxel Communications, Panduit, Conteg |
Key Drivers |
• Rising Data Localization Regulations and Cybersecurity Threats Fuel Demand for Advanced Scalable Data Center Racks |
RESTRAINTS |
• Overcoming Challenges of Thermal Efficiency Scalability and Customization in the Evolving Data Center Rack Market |
Ans: North America dominated the Data Center Rack Market in 2023.
Ans: The Large Data Centers segment dominated the Data Center Rack Market in 2023.
Ans: The major growth factor of the Data Center Rack Market is the increasing demand for scalable, high-density data center infrastructure driven by the rise of cloud computing, AI, and big data analytics.
Ans: The Data Center Rack Market size was USD 4.46 billion in 2023 and is expected to Reach USD 9.17 billion by 2032.
Ans: The Data Center Rack Market is expected to grow at a CAGR of 8.34% during 2024-2032.
1. Introduction
1.1 Market Definition
1.2 Scope (Inclusion and Exclusions)
1.3 Research Assumptions
2. Executive Summary
2.1 Market Overview
2.2 Regional Synopsis
2.3 Competitive Summary
3. Research Methodology
3.1 Top-Down Approach
3.2 Bottom-up Approach
3.3. Data Validation
3.4 Primary Interviews
4. Market Dynamics Impact Analysis
4.1 Market Driving Factors Analysis
4.1.1 Drivers
4.1.2 Restraints
4.2 PESTLE Analysis
4.3 Porter’s Five Forces Model
5. Statistical Insights and Trends Reporting
5.1 Data Center Rack Utilization Rate (2023)
5.2 Data Center Rack Type Distribution (2023)
5.3 Data Center Rack Adoption Rate of Advanced Features (kW/ton)
5.4 Data Center Rack Density (KW per Rack)
6. Competitive Landscape
6.1 List of Major Companies, By Region
6.2 Market Share Analysis, By Region
6.3 Product Benchmarking
6.3.1 Product specifications and features
6.3.2 Pricing
6.4 Strategic Initiatives
6.4.1 Marketing and promotional activities
6.4.2 Distribution and Supply Chain Strategies
6.4.3 Expansion plans and new product launches
6.4.4 Strategic partnerships and collaborations
6.5 Technological Advancements
6.6 Market Positioning and Branding
7. Data Center Rack Market Segmentation, By Rack Type
7.1 Chapter Overview
7.2 Open Frame
7.2.1 Open Frame Market Trends Analysis (2020-2032)
7.2.2 Open Frame Market Size Estimates and Forecasts to 2032 (USD Billion)
7.3 Cabinets
7.3.1 Cabinets Market Trends Analysis (2020-2032)
7.3.2 Cabinets Market Size Estimates and Forecasts to 2032 (USD Billion)
8. Data Center Rack Market Segmentation, By Rack Height
8.1 Chapter Overview
8.2 42U and Below
8.2.1 42U and Below Market Trends Analysis (2020-2032)
8.2.2 42U and Below Market Size Estimates and Forecasts To 2032 (USD Billion)
8.3 43U up to 52U
8.3.1 43U up to 52U Market Trends Analysis (2020-2032)
8.3.2 43U up to 52U Market Size Estimates and Forecasts To 2032 (USD Billion)
8.4 Above 52U
8.4.1 Above 52U Market Trends Analysis (2020-2032)
8.4.2 Above 52U Market Size Estimates and Forecasts To 2032 (USD Billion)
9. Data Center Rack Market Segmentation, By Rack Width
9.1 Chapter Overview
9.2 19 Inch
9.2.1 19 Inch Market Trends Analysis (2020-2032)
9.2.2 19 Inch Market Size Estimates and Forecasts To 2032 (USD Billion)
9.3 23 Inch
9.3.1 23 Inch Market Trends Analysis (2020-2032)
9.3.2 23 Inch Market Size Estimates and Forecasts To 2032 (USD Billion)
9.4 Others
9.4.1 Others Market Trends Analysis (2020-2032)
9.4.2 Others Market Size Estimates and Forecasts To 2032 (USD Billion)
10. Data Center Rack Market Segmentation, By Data Center Size
10.1 Chapter Overview
10.2 Small and Mid-sized Data Centers
10.2.1 Small and Mid-sized Data Centers Market Trends Analysis (2020-2032)
10.2.2 Small and Mid-sized Data Centers Market Size Estimates and Forecasts To 2032 (USD Billion)
10.3 Large Data Centers
10.3.1 Large Data Centers Market Trends Analysis (2020-2032)
10.3.2 Large Data Centers Market Size Estimates and Forecasts To 2032 (USD Billion)
11. Data Center Rack Market Segmentation, By Industries
11.1 Chapter Overview
11.2 BFSI
11.2.1 BFSI Market Trends Analysis (2020-2032)
11.2.2 BFSI Market Size Estimates and Forecasts To 2032 (USD Billion)
11.3 IT & Telecom
11.3.1 IT & Telecom Market Trends Analysis (2020-2032)
11.3.2 IT & Telecom Market Size Estimates and Forecasts To 2032 (USD Billion)
11.4 Government & Defense
11.4.1 Government & Defense Market Trends Analysis (2020-2032)
11.4.2 Government & Defense Market Size Estimates and Forecasts To 2032 (USD Billion)
11.5 Retail
11.5.1 Retail Market Trends Analysis (2020-2032)
11.5.2 Retail Market Size Estimates and Forecasts To 2032 (USD Billion)
11.6 Manufacturing
11.6.1 Manufacturing Market Trends Analysis (2020-2032)
11.6.2 Manufacturing Market Size Estimates and Forecasts To 2032 (USD Billion)
11.7 Healthcare
11.7.1 Healthcare Market Trends Analysis (2020-2032)
11.7.2 Healthcare Market Size Estimates and Forecasts To 2032 (USD Billion)
11.8 Energy and Utilities
11.8.1 Energy and Utilities Market Trends Analysis (2020-2032)
11.8.2 Energy and Utilities Market Size Estimates and Forecasts To 2032 (USD Billion)
11.9 Others
11.9.1 Others Market Trends Analysis (2020-2032)
11.9.2 Others Market Size Estimates and Forecasts To 2032 (USD Billion)
12. Regional Analysis
12.1 Chapter Overview
12.2 North America
12.2.1 Trends Analysis
12.2.2 North America Data Center Rack Market Estimates and Forecasts, By Country (2020-2032) (USD Billion)
12.2.3 North America Data Center Rack Market Estimates and Forecasts, By Rack Type (2020-2032) (USD Billion)
12.2.4 North America Data Center Rack Market Estimates and Forecasts, By Rack Height (2020-2032) (USD Billion)
12.2.5 North America Data Center Rack Market Estimates and Forecasts, By Rack Width (2020-2032) (USD Billion)
12.2.6 North America Data Center Rack Market Estimates and Forecasts, By Data Center Size (2020-2032) (USD Billion)
12.2.7 North America Data Center Rack Market Estimates and Forecasts, By Industries (2020-2032) (USD Billion)
12.2.8 USA
12.2.8.1 USA Data Center Rack Market Estimates and Forecasts, By Rack Type (2020-2032) (USD Billion)
12.2.8.2 USA Data Center Rack Market Estimates and Forecasts, By Rack Height (2020-2032) (USD Billion)
12.2.8.3 USA Data Center Rack Market Estimates and Forecasts, By Rack Width (2020-2032) (USD Billion)
12.2.8.4 USA Data Center Rack Market Estimates and Forecasts, By Data Center Size (2020-2032) (USD Billion)
12.2.8.5 USA Data Center Rack Market Estimates and Forecasts, By Industries (2020-2032) (USD Billion)
12.2.9 Canada
12.2.9.1 Canada Data Center Rack Market Estimates and Forecasts, By Rack Type (2020-2032) (USD Billion)
12.2.9.2 Canada Data Center Rack Market Estimates and Forecasts, By Rack Height (2020-2032) (USD Billion)
12.2.9.3 Canada Data Center Rack Market Estimates and Forecasts, By Rack Width (2020-2032) (USD Billion)
12.2.9.4 Canada Data Center Rack Market Estimates and Forecasts, By Data Center Size (2020-2032) (USD Billion)
12.2.9.5 Canada Data Center Rack Market Estimates and Forecasts, By Industries (2020-2032) (USD Billion)
12.2.10 Mexico
12.2.10.1 Mexico Data Center Rack Market Estimates and Forecasts, By Rack Type (2020-2032) (USD Billion)
12.2.10.2 Mexico Data Center Rack Market Estimates and Forecasts, By Rack Height (2020-2032) (USD Billion)
12.2.10.3 Mexico Data Center Rack Market Estimates and Forecasts, By Rack Width (2020-2032) (USD Billion)
12.2.10.4 Mexico Data Center Rack Market Estimates and Forecasts, By Data Center Size (2020-2032) (USD Billion)
12.2.10.5 Mexico Data Center Rack Market Estimates and Forecasts, By Industries (2020-2032) (USD Billion)
12.3 Europe
12.3.1 Eastern Europe
12.3.1.1 Trends Analysis
12.3.1.2 Eastern Europe Data Center Rack Market Estimates and Forecasts, By Country (2020-2032) (USD Billion)
12.3.1.3 Eastern Europe Data Center Rack Market Estimates and Forecasts, By Rack Type (2020-2032) (USD Billion)
12.3.1.4 Eastern Europe Data Center Rack Market Estimates and Forecasts, By Rack Height (2020-2032) (USD Billion)
12.3.1.5 Eastern Europe Data Center Rack Market Estimates and Forecasts, By Rack Width (2020-2032) (USD Billion)
12.3.1.6 Eastern Europe Data Center Rack Market Estimates and Forecasts, By Data Center Size (2020-2032) (USD Billion)
12.3.1.7 Eastern Europe Data Center Rack Market Estimates and Forecasts, By Industries (2020-2032) (USD Billion)
12.3.1.8 Poland
12.3.1.8.1 Poland Data Center Rack Market Estimates and Forecasts, By Rack Type (2020-2032) (USD Billion)
12.3.1.8.2 Poland Data Center Rack Market Estimates and Forecasts, By Rack Height (2020-2032) (USD Billion)
12.3.1.8.3 Poland Data Center Rack Market Estimates and Forecasts, By Rack Width (2020-2032) (USD Billion)
12.3.1.8.4 Poland Data Center Rack Market Estimates and Forecasts, By Data Center Size (2020-2032) (USD Billion)
12.3.1.8.5 Poland Data Center Rack Market Estimates and Forecasts, By Industries (2020-2032) (USD Billion)
12.3.1.9 Romania
12.3.1.9.1 Romania Data Center Rack Market Estimates and Forecasts, By Rack Type (2020-2032) (USD Billion)
12.3.1.9.2 Romania Data Center Rack Market Estimates and Forecasts, By Rack Height (2020-2032) (USD Billion)
12.3.1.9.3 Romania Data Center Rack Market Estimates and Forecasts, By Rack Width (2020-2032) (USD Billion)
12.3.1.9.4 Romania Data Center Rack Market Estimates And Forecasts, By Data Center Size (2020-2032) (USD Billion)
12.3.1.9.5 Romania Data Center Rack Market Estimates And Forecasts, By Industries (2020-2032) (USD Billion)
12.3.1.10 Hungary
12.3.1.10.1 Hungary Data Center Rack Market Estimates And Forecasts, By Rack Type (2020-2032) (USD Billion)
12.3.1.10.2 Hungary Data Center Rack Market Estimates And Forecasts, By Rack Height (2020-2032) (USD Billion)
12.3.1.10.3 Hungary Data Center Rack Market Estimates And Forecasts, By Rack Width (2020-2032) (USD Billion)
12.3.1.10.4 Hungary Data Center Rack Market Estimates And Forecasts, By Data Center Size (2020-2032) (USD Billion)
12.3.1.10.5 Hungary Data Center Rack Market Estimates And Forecasts, By Industries (2020-2032) (USD Billion)
12.3.1.11 Turkey
12.3.1.11.1 Turkey Data Center Rack Market Estimates And Forecasts, By Rack Type (2020-2032) (USD Billion)
12.3.1.11.2 Turkey Data Center Rack Market Estimates And Forecasts, By Rack Height (2020-2032) (USD Billion)
12.3.1.11.3 Turkey Data Center Rack Market Estimates And Forecasts, By Rack Width (2020-2032) (USD Billion)
12.3.1.11.4 Turkey Data Center Rack Market Estimates And Forecasts, By Data Center Size (2020-2032) (USD Billion)
12.3.1.11.5 Turkey Data Center Rack Market Estimates And Forecasts, By Industries (2020-2032) (USD Billion)
12.3.1.12 Rest Of Eastern Europe
12.3.1.12.1 Rest Of Eastern Europe Data Center Rack Market Estimates And Forecasts, By Rack Type (2020-2032) (USD Billion)
12.3.1.12.2 Rest Of Eastern Europe Data Center Rack Market Estimates And Forecasts, By Rack Height (2020-2032) (USD Billion)
12.3.1.12.3 Rest Of Eastern Europe Data Center Rack Market Estimates And Forecasts, By Rack Width (2020-2032) (USD Billion)
12.3.1.12.4 Rest Of Eastern Europe Data Center Rack Market Estimates And Forecasts, By Data Center Size (2020-2032) (USD Billion)
12.3.1.12.5 Rest Of Eastern Europe Data Center Rack Market Estimates And Forecasts, By Industries (2020-2032) (USD Billion)
12.3.2 Western Europe
12.3.2.1 Trends Analysis
12.3.2.2 Western Europe Data Center Rack Market Estimates And Forecasts, By Country (2020-2032) (USD Billion)
12.3.2.3 Western Europe Data Center Rack Market Estimates And Forecasts, By Rack Type (2020-2032) (USD Billion)
12.3.2.4 Western Europe Data Center Rack Market Estimates And Forecasts, By Rack Height (2020-2032) (USD Billion)
12.3.2.5 Western Europe Data Center Rack Market Estimates And Forecasts, By Rack Width (2020-2032) (USD Billion)
12.3.2.6 Western Europe Data Center Rack Market Estimates And Forecasts, By Data Center Size (2020-2032) (USD Billion)
12.3.2.7 Western Europe Data Center Rack Market Estimates And Forecasts, By Industries (2020-2032) (USD Billion)
12.3.2.8 Germany
12.3.2.8.1 Germany Data Center Rack Market Estimates And Forecasts, By Rack Type (2020-2032) (USD Billion)
12.3.2.8.2 Germany Data Center Rack Market Estimates And Forecasts, By Rack Height (2020-2032) (USD Billion)
12.3.2.8.3 Germany Data Center Rack Market Estimates And Forecasts, By Material Vehicle Type (2020-2032) (USD Billion)
12.3.2.8.4 Germany Data Center Rack Market Estimates And Forecasts, By Data Center Size (2020-2032) (USD Billion)
12.3.2.8.5 Germany Data Center Rack Market Estimates And Forecasts, By Industries (2020-2032) (USD Billion)
12.3.2.9 France
12.3.2.9.1 France Data Center Rack Market Estimates And Forecasts, By Rack Type (2020-2032) (USD Billion)
12.3.2.9.2 France Data Center Rack Market Estimates And Forecasts, By Rack Height (2020-2032) (USD Billion)
12.3.2.9.3 France Data Center Rack Market Estimates And Forecasts, By Rack Width (2020-2032) (USD Billion)
12.3.2.9.4 France Data Center Rack Market Estimates And Forecasts, By Data Center Size (2020-2032) (USD Billion)
12.3.2.9.5 France Data Center Rack Market Estimates And Forecasts, By Industries (2020-2032) (USD Billion)
12.3.2.10 UK
12.3.2.10.1 UK Data Center Rack Market Estimates And Forecasts, By Rack Type (2020-2032) (USD Billion)
12.3.2.10.2 UK Data Center Rack Market Estimates And Forecasts, By Rack Height (2020-2032) (USD Billion)
12.3.2.10.3 UK Data Center Rack Market Estimates And Forecasts, By Rack Width (2020-2032) (USD Billion)
12.3.2.10.4 UK Data Center Rack Market Estimates And Forecasts, By Data Center Size (2020-2032) (USD Billion)
12.3.2.10.5 UK Data Center Rack Market Estimates And Forecasts, By Industries (2020-2032) (USD Billion)
12.3.2.11 Italy
12.3.2.11.1 Italy Data Center Rack Market Estimates And Forecasts, By Rack Type (2020-2032) (USD Billion)
12.3.2.11.2 Italy Data Center Rack Market Estimates And Forecasts, By Rack Height (2020-2032) (USD Billion)
12.3.2.11.3 Italy Data Center Rack Market Estimates And Forecasts, By Rack Width (2020-2032) (USD Billion)
12.3.2.11.4 Italy Data Center Rack Market Estimates And Forecasts, By Data Center Size (2020-2032) (USD Billion)
12.3.2.11.5 Italy Data Center Rack Market Estimates And Forecasts, By Industries (2020-2032) (USD Billion)
12.3.2.12 Spain
12.3.2.12.1 Spain Data Center Rack Market Estimates And Forecasts, By Rack Type (2020-2032) (USD Billion)
12.3.2.12.2 Spain Data Center Rack Market Estimates And Forecasts, By Rack Height (2020-2032) (USD Billion)
12.3.2.12.3 Spain Data Center Rack Market Estimates And Forecasts, By Rack Width (2020-2032) (USD Billion)
12.3.2.12.4 Spain Data Center Rack Market Estimates And Forecasts, By Data Center Size (2020-2032) (USD Billion)
12.3.2.12.5 Spain Data Center Rack Market Estimates And Forecasts, By Industries (2020-2032) (USD Billion)
12.3.2.13 Netherlands
12.3.2.13.1 Netherlands Data Center Rack Market Estimates And Forecasts, By Rack Type (2020-2032) (USD Billion)
12.3.2.13.2 Netherlands Data Center Rack Market Estimates And Forecasts, By Rack Height (2020-2032) (USD Billion)
12.3.2.13.3 Netherlands Data Center Rack Market Estimates And Forecasts, By Rack Width (2020-2032) (USD Billion)
12.3.2.13.4 Netherlands Data Center Rack Market Estimates And Forecasts, By Data Center Size (2020-2032) (USD Billion)
12.3.2.13.5 Netherlands Data Center Rack Market Estimates And Forecasts, By Industries (2020-2032) (USD Billion)
12.3.2.14 Switzerland
12.3.2.14.1 Switzerland Data Center Rack Market Estimates And Forecasts, By Rack Type (2020-2032) (USD Billion)
12.3.2.14.2 Switzerland Data Center Rack Market Estimates And Forecasts, By Rack Height (2020-2032) (USD Billion)
12.3.2.14.3 Switzerland Data Center Rack Market Estimates And Forecasts, By Rack Width (2020-2032) (USD Billion)
12.3.2.14.4 Switzerland Data Center Rack Market Estimates And Forecasts, By Data Center Size (2020-2032) (USD Billion)
12.3.2.12.5 Switzerland Data Center Rack Market Estimates And Forecasts, By Industries (2020-2032) (USD Billion)
12.3.2.15 Austria
12.3.2.15.1 Austria Data Center Rack Market Estimates And Forecasts, By Rack Type (2020-2032) (USD Billion)
12.3.2.15.2 Austria Data Center Rack Market Estimates And Forecasts, By Rack Height (2020-2032) (USD Billion)
12.3.2.15.3 Austria Data Center Rack Market Estimates And Forecasts, By Rack Width (2020-2032) (USD Billion)
12.3.2.15.4 Austria Data Center Rack Market Estimates And Forecasts, By Data Center Size (2020-2032) (USD Billion)
12.3.2.15.5 Austria Data Center Rack Market Estimates And Forecasts, By Industries (2020-2032) (USD Billion)
12.3.2.16 Rest Of Western Europe
12.3.2.16.1 Rest Of Western Europe Data Center Rack Market Estimates And Forecasts, By Rack Type (2020-2032) (USD Billion)
12.3.2.16.2 Rest Of Western Europe Data Center Rack Market Estimates And Forecasts, By Rack Height (2020-2032) (USD Billion)
12.3.2.16.3 Rest Of Western Europe Data Center Rack Market Estimates And Forecasts, By Rack Width (2020-2032) (USD Billion)
12.3.2.16.4 Rest Of Western Europe Data Center Rack Market Estimates And Forecasts, By Data Center Size (2020-2032) (USD Billion)
12.3.2.16.5 Rest Of Western Europe Data Center Rack Market Estimates And Forecasts, By Industries (2020-2032) (USD Billion)
12.4 Asia Pacific
12.4.1 Trends Analysis
12.4.2 Asia Pacific Data Center Rack Market Estimates And Forecasts, By Country (2020-2032) (USD Billion)
12.4.3 Asia Pacific Data Center Rack Market Estimates And Forecasts, By Rack Type (2020-2032) (USD Billion)
12.4.4 Asia Pacific Data Center Rack Market Estimates And Forecasts, By Rack Height (2020-2032) (USD Billion)
12.4.5 Asia Pacific Data Center Rack Market Estimates And Forecasts, By Rack Width (2020-2032) (USD Billion)
12.4.6 Asia Pacific Data Center Rack Market Estimates And Forecasts, By Data Center Size (2020-2032) (USD Billion)
12.4.7 Asia Pacific Data Center Rack Market Estimates And Forecasts, By Industries (2020-2032) (USD Billion)
12.4.8 China
12.4.8.1 China Data Center Rack Market Estimates And Forecasts, By Rack Type (2020-2032) (USD Billion)
12.4.8.2 China Data Center Rack Market Estimates And Forecasts, By Rack Height (2020-2032) (USD Billion)
12.4.8.3 China Data Center Rack Market Estimates And Forecasts, By Rack Width (2020-2032) (USD Billion)
12.4.8.4 China Data Center Rack Market Estimates And Forecasts, By Data Center Size (2020-2032) (USD Billion)
12.4.8.5 China Data Center Rack Market Estimates And Forecasts, By Industries (2020-2032) (USD Billion)
12.4.9 India
12.4.9.1 India Data Center Rack Market Estimates And Forecasts, By Rack Type (2020-2032) (USD Billion)
12.4.9.2 India Data Center Rack Market Estimates And Forecasts, By Rack Height (2020-2032) (USD Billion)
12.4.9.3 India Data Center Rack Market Estimates And Forecasts, By Rack Width (2020-2032) (USD Billion)
12.4.9.4 India Data Center Rack Market Estimates And Forecasts, By Data Center Size (2020-2032) (USD Billion)
12.4.9.5 India Data Center Rack Market Estimates And Forecasts, By Industries (2020-2032) (USD Billion)
12.4.10 Japan
12.4.10.1 Japan Data Center Rack Market Estimates And Forecasts, By Rack Type (2020-2032) (USD Billion)
12.4.10.2 Japan Data Center Rack Market Estimates And Forecasts, By Rack Height (2020-2032) (USD Billion)
12.4.10.3 Japan Data Center Rack Market Estimates And Forecasts, By Rack Width (2020-2032) (USD Billion)
12.4.10.4 Japan Data Center Rack Market Estimates And Forecasts, By Data Center Size (2020-2032) (USD Billion)
12.4.10.5 Japan Data Center Rack Market Estimates And Forecasts, By Industries (2020-2032) (USD Billion)
12.4.11 South Korea
12.4.11.1 South Korea Data Center Rack Market Estimates And Forecasts, By Rack Type (2020-2032) (USD Billion)
12.4.11.2 South Korea Data Center Rack Market Estimates And Forecasts, By Rack Height (2020-2032) (USD Billion)
12.4.11.3 South Korea Data Center Rack Market Estimates And Forecasts, By Rack Width (2020-2032) (USD Billion)
12.4.11.4 South Korea Data Center Rack Market Estimates And Forecasts, By Data Center Size (2020-2032) (USD Billion)
12.4.11.5 South Korea Data Center Rack Market Estimates And Forecasts, By Industries (2020-2032) (USD Billion)
12.4.12 Vietnam
12.4.12.1 Vietnam Data Center Rack Market Estimates And Forecasts, By Rack Type (2020-2032) (USD Billion)
12.4.12.2 Vietnam Data Center Rack Market Estimates And Forecasts, By Rack Height (2020-2032) (USD Billion)
12.4.12.3 Vietnam Data Center Rack Market Estimates And Forecasts, By Rack Width (2020-2032) (USD Billion)
12.4.12.4 Vietnam Data Center Rack Market Estimates And Forecasts, By Data Center Size (2020-2032) (USD Billion)
12.4.12.5 Vietnam Data Center Rack Market Estimates And Forecasts, By Industries (2020-2032) (USD Billion)
12.4.13 Singapore
12.4.13.1 Singapore Data Center Rack Market Estimates And Forecasts, By Rack Type (2020-2032) (USD Billion)
12.4.13.2 Singapore Data Center Rack Market Estimates And Forecasts, By Rack Height (2020-2032) (USD Billion)
12.4.13.3 Singapore Data Center Rack Market Estimates And Forecasts, By Rack Width (2020-2032) (USD Billion)
12.4.13.4 Singapore Data Center Rack Market Estimates And Forecasts, By Data Center Size (2020-2032) (USD Billion)
12.4.13.5 Singapore Data Center Rack Market Estimates And Forecasts, By Industries (2020-2032) (USD Billion)
12.4.14 Australia
12.4.14.1 Australia Data Center Rack Market Estimates And Forecasts, By Rack Type (2020-2032) (USD Billion)
12.4.14.2 Australia Data Center Rack Market Estimates And Forecasts, By Rack Height (2020-2032) (USD Billion)
12.4.14.3 Australia Data Center Rack Market Estimates And Forecasts, By Rack Width (2020-2032) (USD Billion)
12.4.14.4 Australia Data Center Rack Market Estimates And Forecasts, By Data Center Size (2020-2032) (USD Billion)
12.4.14.5 Australia Data Center Rack Market Estimates And Forecasts, By Industries (2020-2032) (USD Billion)
12.4.15 Rest Of Asia Pacific
12.4.15.1 Rest Of Asia Pacific Data Center Rack Market Estimates And Forecasts, By Rack Type (2020-2032) (USD Billion)
12.4.15.2 Rest Of Asia Pacific Data Center Rack Market Estimates And Forecasts, By Rack Height (2020-2032) (USD Billion)
12.4.15.3 Rest Of Asia Pacific Data Center Rack Market Estimates And Forecasts, By Rack Width (2020-2032) (USD Billion)
12.4.15.4 Rest Of Asia Pacific Data Center Rack Market Estimates And Forecasts, By Data Center Size (2020-2032) (USD Billion)
12.4.15.5 Rest Of Asia Pacific Data Center Rack Market Estimates And Forecasts, By Industries (2020-2032) (USD Billion)
12.5 Middle East And Africa
12.5.1 Middle East
12.5.1.1 Trends Analysis
12.5.1.2 Middle East Data Center Rack Market Estimates And Forecasts, By Country (2020-2032) (USD Billion)
12.5.1.3 Middle East Data Center Rack Market Estimates And Forecasts, By Rack Type (2020-2032) (USD Billion)
12.5.1.4 Middle East Data Center Rack Market Estimates And Forecasts, By Rack Height (2020-2032) (USD Billion)
12.5.1.5 Middle East Data Center Rack Market Estimates And Forecasts, By Rack Width (2020-2032) (USD Billion)
12.5.1.6 Middle East Data Center Rack Market Estimates And Forecasts, By Data Center Size (2020-2032) (USD Billion)
12.5.1.7 Middle East Data Center Rack Market Estimates And Forecasts, By Industries (2020-2032) (USD Billion)
12.5.1.8 UAE
12.5.1.8.1 UAE Data Center Rack Market Estimates And Forecasts, By Rack Type (2020-2032) (USD Billion)
12.5.1.8.2 UAE Data Center Rack Market Estimates And Forecasts, By Data Center Size (2020-2032) (USD Billion)
12.5.1.8.3 UAE Data Center Rack Market Estimates And Forecasts, By Rack Width (2020-2032) (USD Billion)
12.5.1.8.4 UAE Data Center Rack Market Estimates And Forecasts, By Data Center Size (2020-2032) (USD Billion)
12.5.1.8.5 UAE Data Center Rack Market Estimates And Forecasts, By Industries (2020-2032) (USD Billion)
12.5.1.9 Egypt
12.5.1.9.1 Egypt Data Center Rack Market Estimates And Forecasts, By Rack Type (2020-2032) (USD Billion)
12.5.1.9.2 Egypt Data Center Rack Market Estimates And Forecasts, By Rack Height (2020-2032) (USD Billion)
12.5.1.9.3 Egypt Data Center Rack Market Estimates And Forecasts, By Rack Width (2020-2032) (USD Billion)
12.5.1.9.4 Egypt Data Center Rack Market Estimates And Forecasts, By Data Center Size (2020-2032) (USD Billion)
12.5.1.9.5 Egypt Data Center Rack Market Estimates And Forecasts, By Industries (2020-2032) (USD Billion)
12.5.1.10 Saudi Arabia
12.5.1.10.1 Saudi Arabia Data Center Rack Market Estimates And Forecasts, By Rack Type (2020-2032) (USD Billion)
12.5.1.10.2 Saudi Arabia Data Center Rack Market Estimates And Forecasts, By Rack Height (2020-2032) (USD Billion)
12.5.1.10.3 Saudi Arabia Data Center Rack Market Estimates And Forecasts, By Rack Width (2020-2032) (USD Billion)
12.5.1.10.4 Saudi Arabia Data Center Rack Market Estimates And Forecasts, By Data Center Size (2020-2032) (USD Billion)
12.5.1.10.5 Saudi Arabia Data Center Rack Market Estimates And Forecasts, By Industries (2020-2032) (USD Billion)
12.5.1.11 Qatar
12.5.1.11.1 Qatar Data Center Rack Market Estimates And Forecasts, By Rack Type (2020-2032) (USD Billion)
12.5.1.11.2 Qatar Data Center Rack Market Estimates And Forecasts, By Rack Height (2020-2032) (USD Billion)
12.5.1.11.3 Qatar Data Center Rack Market Estimates And Forecasts, By Rack Width (2020-2032) (USD Billion)
12.5.1.11.4 Qatar Data Center Rack Market Estimates And Forecasts, By Data Center Size (2020-2032) (USD Billion)
12.5.1.11.5 Qatar Data Center Rack Market Estimates And Forecasts, By Industries (2020-2032) (USD Billion)
12.5.1.12 Rest Of Middle East
12.5.1.12.1 Rest Of Middle East Data Center Rack Market Estimates And Forecasts, By Rack Type (2020-2032) (USD Billion)
12.5.1.12.2 Rest Of Middle East Data Center Rack Market Estimates And Forecasts, By Rack Height (2020-2032) (USD Billion)
12.5.1.12.3 Rest Of Middle East Data Center Rack Market Estimates And Forecasts, By Rack Width (2020-2032) (USD Billion)
12.5.1.12.4 Rest Of Middle East Data Center Rack Market Estimates And Forecasts, By Data Center Size (2020-2032) (USD Billion)
12.5.1.12.5 Rest Of Middle East Data Center Rack Market Estimates And Forecasts, By Industries (2020-2032) (USD Billion)
12.5.2 Africa
12.5.2.1 Trends Analysis
12.5.2.2 Africa Data Center Rack Market Estimates And Forecasts, By Country (2020-2032) (USD Billion)
12.5.2.3 Africa Data Center Rack Market Estimates And Forecasts, By Rack Type (2020-2032) (USD Billion)
12.5.2.4 Africa Data Center Rack Market Estimates And Forecasts, By Rack Height (2020-2032) (USD Billion)
12.5.2.5 Africa Data Center Rack Market Estimates And Forecasts, By Rack Width (2020-2032) (USD Billion)
12.5.2.6 Africa Data Center Rack Market Estimates And Forecasts, By Data Center Size (2020-2032) (USD Billion)
12.5.2.7 Africa Data Center Rack Market Estimates And Forecasts, By Industries (2020-2032) (USD Billion)
12.5.2.8 South Africa
12.5.2.8.1 South Africa Data Center Rack Market Estimates And Forecasts, By Rack Type (2020-2032) (USD Billion)
12.5.2.8.2 South Africa Data Center Rack Market Estimates And Forecasts, By Rack Height (2020-2032) (USD Billion)
12.5.2.8.3 South Africa Data Center Rack Market Estimates And Forecasts, By Rack Width (2020-2032) (USD Billion)
12.5.2.8.4 South Africa Data Center Rack Market Estimates And Forecasts, By Data Center Size (2020-2032) (USD Billion)
12.5.2.8.5 South Africa Data Center Rack Market Estimates And Forecasts, By Industries (2020-2032) (USD Billion)
12.5.2.9 Nigeria
12.5.2.9.1 Nigeria Data Center Rack Market Estimates And Forecasts, By Rack Type (2020-2032) (USD Billion)
12.5.2.9.2 Nigeria Data Center Rack Market Estimates And Forecasts, By Rack Height (2020-2032) (USD Billion)
12.5.2.9.3 Nigeria Data Center Rack Market Estimates And Forecasts, By Rack Width (2020-2032) (USD Billion)
12.5.2.9.4 Nigeria Data Center Rack Market Estimates And Forecasts, By Data Center Size (2020-2032) (USD Billion)
12.5.2.9.5 Nigeria Data Center Rack Market Estimates And Forecasts, By Industries (2020-2032) (USD Billion)
12.5.2.10 Rest Of Africa
12.5.2.10.1 Rest Of Africa Data Center Rack Market Estimates And Forecasts, By Rack Type (2020-2032) (USD Billion)
12.5.2.10.2 Rest Of Africa Data Center Rack Market Estimates And Forecasts, By Rack Height (2020-2032) (USD Billion)
12.5.2.10.3 Rest Of Africa Data Center Rack Market Estimates And Forecasts, By Rack Width (2020-2032) (USD Billion)
12.5.2.10.4 Rest Of Africa Data Center Rack Market Estimates And Forecasts, By Data Center Size (2020-2032) (USD Billion)
12.5.2.10.5 Rest Of Africa Data Center Rack Market Estimates And Forecasts, By Industries (2020-2032) (USD Billion)
12.6 Latin America
12.6.1 Trends Analysis
12.6.2 Latin America Data Center Rack Market Estimates And Forecasts, By Country (2020-2032) (USD Billion)
12.6.3 Latin America Data Center Rack Market Estimates And Forecasts, By Rack Type (2020-2032) (USD Billion)
12.6.4 Latin America Data Center Rack Market Estimates And Forecasts, By Rack Height (2020-2032) (USD Billion)
12.6.5 Latin America Data Center Rack Market Estimates And Forecasts, By Rack Width (2020-2032) (USD Billion)
12.6.6 Latin America Data Center Rack Market Estimates And Forecasts, By Data Center Size (2020-2032) (USD Billion)
12.6.7 Latin America Data Center Rack Market Estimates And Forecasts, By Industries (2020-2032) (USD Billion)
12.6.8 Brazil
12.6.8.1 Brazil Data Center Rack Market Estimates And Forecasts, By Rack Type (2020-2032) (USD Billion)
12.6.8.2 Brazil Data Center Rack Market Estimates And Forecasts, By Rack Height (2020-2032) (USD Billion)
12.6.8.3 Brazil Data Center Rack Market Estimates And Forecasts, By Rack Width (2020-2032) (USD Billion)
12.6.8.4 Brazil Data Center Rack Market Estimates And Forecasts, By Data Center Size (2020-2032) (USD Billion)
12.6.8.5 Brazil Data Center Rack Market Estimates And Forecasts, By Industries (2020-2032) (USD Billion)
12.6.9 Argentina
12.6.9.1 Argentina Data Center Rack Market Estimates And Forecasts, By Rack Type (2020-2032) (USD Billion)
12.6.9.2 Argentina Data Center Rack Market Estimates And Forecasts, By Rack Height (2020-2032) (USD Billion)
12.6.9.3 Argentina Data Center Rack Market Estimates And Forecasts, By Rack Width (2020-2032) (USD Billion)
12.6.9.4 Argentina Data Center Rack Market Estimates And Forecasts, By Data Center Size (2020-2032) (USD Billion)
12.6.9.5 Argentina Data Center Rack Market Estimates And Forecasts, By Industries (2020-2032) (USD Billion)
12.6.10 Colombia
12.6.10.1 Colombia Data Center Rack Market Estimates And Forecasts, By Rack Type (2020-2032) (USD Billion)
12.6.10.2 Colombia Data Center Rack Market Estimates And Forecasts, By Rack Height (2020-2032) (USD Billion)
12.6.10.3 Colombia Data Center Rack Market Estimates And Forecasts, By Rack Width (2020-2032) (USD Billion)
12.6.10.4 Colombia Data Center Rack Market Estimates And Forecasts, By Data Center Size (2020-2032) (USD Billion)
12.6.10.5 Colombia Data Center Rack Market Estimates And Forecasts, By Industries (2020-2032) (USD Billion)
12.6.11 Rest Of Latin America
12.6.11.1 Rest Of Latin America Data Center Rack Market Estimates And Forecasts, By Rack Type (2020-2032) (USD Billion)
12.6.11.2 Rest Of Latin America Data Center Rack Market Estimates And Forecasts, By Rack Height (2020-2032) (USD Billion)
12.6.11.3 Rest Of Latin America Data Center Rack Market Estimates And Forecasts, By Rack Width (2020-2032) (USD Billion)
12.6.11.4 Rest Of Latin America Data Center Rack Market Estimates And Forecasts, By Data Center Size (2020-2032) (USD Billion)
12.6.11.5 Rest Of Latin America Data Center Rack Market Estimates And Forecasts, By Industries (2020-2032) (USD Billion)
13. Company Profiles
13.1 Schneider Electric.
13.1.1 Company Overview
13.1.2 Financial
13.1.3 Products/ Services Offered
13.1.4 SWOT Analysis
13.2 Huawei Technologies
13.2.1 Company Overview
13.2.2 Financial
13.2.3 Products/ Services Offered
13.2.4 SWOT Analysis
13.3 Rittal
13.3.1 Company Overview
13.3.2 Financial
13.3.3 Products/ Services Offered
13.3.4 SWOT Analysis
13.4 Vertiv
13.4.1 Company Overview
13.4.2 Financial
13.4.3 Products/ Services Offered
13.4.4 SWOT Analysis
13.5 Eaton
13.5.1 Company Overview
13.5.2 Financial
13.5.3 Products/ Services Offered
13.5.4 SWOT Analysis
13.6 Delta Electronics.
13.6.1 Company Overview
13.6.2 Financial
13.6.3 Products/ Services Offered
13.6.4 SWOT Analysis
13.7 Hewlett Packard Enterprise
13.7.1 Company Overview
13.7.2 Financial
13.7.3 Products/ Services Offered
13.7.4 SWOT Analysis
13.8 IBM.
13.8.1 Company Overview
13.8.2 Financial
13.8.3 Products/ Services Offered
13.8.4 SWOT Analysis
13.9 Intel
13.9.1 Company Overview
13.9.2 Financial
13.9.3 Products/ Services Offered
13.9.4 SWOT Analysis
13.10 American Power Conversion (APC)
13.12.1 Company Overview
13.12.2 Financial
13.12.3 Products/ Services Offered
13.12.4 SWOT Analysis
14. Use Cases and Best Practices
15. Conclusion
An accurate research report requires proper strategizing as well as implementation. There are multiple factors involved in the completion of good and accurate research report and selecting the best methodology to compete the research is the toughest part. Since the research reports we provide play a crucial role in any company’s decision-making process, therefore we at SNS Insider always believe that we should choose the best method which gives us results closer to reality. This allows us to reach at a stage wherein we can provide our clients best and accurate investment to output ratio.
Each report that we prepare takes a timeframe of 350-400 business hours for production. Starting from the selection of titles through a couple of in-depth brain storming session to the final QC process before uploading our titles on our website we dedicate around 350 working hours. The titles are selected based on their current market cap and the foreseen CAGR and growth.
The 5 steps process:
Step 1: Secondary Research:
Secondary Research or Desk Research is as the name suggests is a research process wherein, we collect data through the readily available information. In this process we use various paid and unpaid databases which our team has access to and gather data through the same. This includes examining of listed companies’ annual reports, Journals, SEC filling etc. Apart from this our team has access to various associations across the globe across different industries. Lastly, we have exchange relationships with various university as well as individual libraries.
Step 2: Primary Research
When we talk about primary research, it is a type of study in which the researchers collect relevant data samples directly, rather than relying on previously collected data. This type of research is focused on gaining content specific facts that can be sued to solve specific problems. Since the collected data is fresh and first hand therefore it makes the study more accurate and genuine.
We at SNS Insider have divided Primary Research into 2 parts.
Part 1 wherein we interview the KOLs of major players as well as the upcoming ones across various geographic regions. This allows us to have their view over the market scenario and acts as an important tool to come closer to the accurate market numbers. As many as 45 paid and unpaid primary interviews are taken from both the demand and supply side of the industry to make sure we land at an accurate judgement and analysis of the market.
This step involves the triangulation of data wherein our team analyses the interview transcripts, online survey responses and observation of on filed participants. The below mentioned chart should give a better understanding of the part 1 of the primary interview.
Part 2: In this part of primary research the data collected via secondary research and the part 1 of the primary research is validated with the interviews from individual consultants and subject matter experts.
Consultants are those set of people who have at least 12 years of experience and expertise within the industry whereas Subject Matter Experts are those with at least 15 years of experience behind their back within the same space. The data with the help of two main processes i.e., FGDs (Focused Group Discussions) and IDs (Individual Discussions). This gives us a 3rd party nonbiased primary view of the market scenario making it a more dependable one while collation of the data pointers.
Step 3: Data Bank Validation
Once all the information is collected via primary and secondary sources, we run that information for data validation. At our intelligence centre our research heads track a lot of information related to the market which includes the quarterly reports, the daily stock prices, and other relevant information. Our data bank server gets updated every fortnight and that is how the information which we collected using our primary and secondary information is revalidated in real time.
Step 4: QA/QC Process
After all the data collection and validation our team does a final level of quality check and quality assurance to get rid of any unwanted or undesired mistakes. This might include but not limited to getting rid of the any typos, duplication of numbers or missing of any important information. The people involved in this process include technical content writers, research heads and graphics people. Once this process is completed the title gets uploader on our platform for our clients to read it.
Step 5: Final QC/QA Process:
This is the last process and comes when the client has ordered the study. In this process a final QA/QC is done before the study is emailed to the client. Since we believe in giving our clients a good experience of our research studies, therefore, to make sure that we do not lack at our end in any way humanly possible we do a final round of quality check and then dispatch the study to the client.
By Rack Type
Open Frame
Cabinets
By Rack Height
42U and Below
43U up to 52U
Above 52U
By Rack Width
19 Inch
23 Inch
Others
By Data Center Size
Small and Mid-sized Data Centers
Large Data Centers
By Industry Vertical
BFSI
IT & Telecom
Government & Defense
Retail
Manufacturing
Healthcare
Energy and Utilities
Others
Request for Segment Customization as per your Business Requirement: Segment Customization Request
REGIONAL COVERAGE:
North America
US
Canada
Mexico
Europe
Eastern Europe
Poland
Romania
Hungary
Turkey
Rest of Eastern Europe
Western Europe
Germany
France
UK
Italy
Spain
Netherlands
Switzerland
Austria
Rest of Western Europe
Asia Pacific
China
India
Japan
South Korea
Vietnam
Singapore
Australia
Rest of Asia Pacific
Middle East & Africa
Middle East
UAE
Egypt
Saudi Arabia
Qatar
Rest of the Middle East
Africa
Nigeria
South Africa
Rest of Africa
Latin America
Brazil
Argentina
Colombia
Rest of Latin America
Request for Country Level Research Report: Country Level Customization Request
Available Customization
With the given market data, SNS Insider offers customization as per the company’s specific needs. The following customization options are available for the report:
Product Analysis
Criss-Cross segment analysis (e.g. Product X Application)
Product Matrix which gives a detailed comparison of the product portfolio of each company
Geographic Analysis
Additional countries in any of the regions
Company Information
Detailed analysis and profiling of additional market players (Up to five)
The Smart Warehousing Market Size was USD 22.7 billion in 2023 and is expected to reach USD 75.7 billion by 2032 and grow at a CAGR of 14.3% by 2024-2032.
The Direct Carrier Billing Market size was valued at USD 40.02 Bn in 2023 and is expected to reach USD 102.7 Bn by 2032 and grow at a CAGR of 11.04% over the forecast period 2024-2032.
Artificial Intelligence in Supply Chain Market was valued at USD 4.71 bn in 2023 and will reach USD 89.46 bn by 2032, growing at a CAGR of 38.73% by 2032.
Variable Rate Technology Market was valued at USD 4.29 billion in 2023 and is expected to reach USD 11.72 billion by 2032, growing at a CAGR of 11.92% from 2024-2032.
Conversational AI Market Size was valued at USD 10.1 Billion in 2023 and is expected to reach USD 64.5 Billion by 2032 and grow at a CAGR of 22.89 % over the forecast period 2024-2032.
The Hyperscale Data Center Market, valued at USD 124.30 billion in 2023, is projected to reach USD 957.23 billion by 2032, growing at a robust CAGR of 25.48% of 2024-2032.
Hi! Click one of our member below to chat on Phone