Data Center GPU Market Report Scope & Overview:
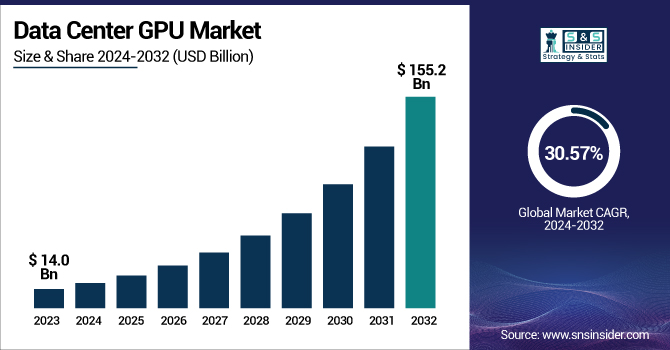
The Data Center GPU Market was valued at USD 23.87 billion in 2024 and is expected to reach USD 201.64 billion by 2032, growing at a CAGR of 30.57% from 2025-2032.
To Get more information on Data Center GPU Market - Request Free Sample Report
The Data Center GPU Market is witnessing a surge in AI and machine learning workload adoption, with enterprises and hyperscale cloud providers integrating advanced GPU solutions to support deep learning, predictive analytics, and generative AI applications. North America remains the leader in deploying GPU-accelerated cloud instances, while the Asia-Pacific region is emerging as the fastest-growing market as local cloud providers invest heavily in AI-ready infrastructure. The rise of GPU-powered AI workloads has also driven up data center power consumption, prompting operators to adopt energy-efficient GPUs and liquid-cooling solutions to enhance operational sustainability. Additionally, growing demand for AI model training, real-time analytics, and scientific simulations has fueled significant investments in high-performance computing (HPC) infrastructure globally. The report further highlights new trends in AI-powered edge data centers, modular GPU cluster deployments, and benchmarks of next-gen GPU chipsets for AI inference and training applications through 2025.
Market Size and Forecast
-
Market Size in 2024: USD 23.87 Billion
-
Market Size by 2032: USD 201.64 Billion
-
CAGR: 30.57% from 2025 to 2032
-
Base Year: 2024
-
Forecast Period: 2025–2032
-
Historical Data: 2021–2023
Data Center GPU Market Trends
-
Rising demand for high-performance computing, AI, and deep learning is driving the data center GPU market.
-
Expansion of cloud computing, HPC, and virtualization services is boosting GPU adoption.
-
Growing use in data analytics, autonomous systems, and scientific research is accelerating market growth.
-
Integration with AI frameworks and GPU-accelerated software is enhancing processing speed and efficiency.
-
Increasing deployment of hyperscale and colocation data centers is fueling GPU requirements.
-
Advancements in multi-GPU architectures and energy-efficient designs are shaping market trends.
-
Collaborations between GPU manufacturers, cloud providers, and enterprise IT firms are accelerating innovation and adoption.
U.S. Data Center GPU Market was valued at USD 5.21 billion in 2024 and is expected to reach USD 43.16 billion by 2032, growing at a CAGR of 30.25% from 2025-2032.
Data Center GPU Market Growth Drivers:
-
Rising demand for AI, ML, and HPC workloads is fueling the deployment of high-performance GPUs in data centers.
One of the key drivers of the data center GPU market is the increasing adoption of AI, ML and generative AI applications. As a result, parallel processing capabilities of GPUs make them essential in training and inference operations — GPUs can outshine CPUS on large datasets. Applications like recommendation engines, language models, autonomous vehicles, and financial modeling are increasingly dependent on AI-driven services, which in turn are broadening the scope of GPU deployments. Finally, the adoption of AI in enterprise processes and cloud services has pushed the hyperscale data centers to focus on GPU infrastructure. As AI applications become more complex, this demand will only go up as we need more powerful processing and efficiency improvements.
Data Center GPU Market Restraints:
-
High capital and operational costs of GPU infrastructure limit adoption among smaller data centers and enterprises.
However, GPUs provide high processing performance for AI and HPC workloads , and they have a high initial procurement and operational cost, which is a major restraining factor. GPU servers must be accompanied by substantial investments in cooling systems, power management, and dedicated infrastructure that can run high-performance components, but they are no more than data center bulk at the end of the day, and they can add rows of dollars to the hype. Continuously maintaining and extracting energy for GPU-rich systems can promptly lead to high operating expenditures. This cost factor restricts adoption by all but the largest data centers and organizations with limited IT budgets. Cloud-based GPU instances could be an option, but the cost of ownership and data privacy concerns may still prevent adoption.
Data Center GPU Market Opportunities:
-
Growth in cloud-based GPU services and edge data centers opens new avenues for scalable, AI-driven applications.
The cloud-based GPU services are in higher demand compared to the on-premise services, which creates a good opportunity for the data center GPU market. Major cloud providers, namely AWS, Google Cloud, and Microsoft Azure, are also dramatically increasing their GPU-powered infrastructure to support AI, ML, and video analytics workloads on demand. Additionally, the rise of edge data centers places GPUs closer to end-users for latency-sensitive use cases such as smart cities, autonomous vehicles, and AR/VR environments. This decentralized architecture allows lower latency data transmission and enables faster real-time processing. The growth of cloud and edge GPU deployments will see rapid adoption on a global scale due to AI and content streaming applications.
Data Center GPU Market Challenge:
-
Managing high power consumption and cooling demands of GPU-intensive data centers remains a significant operational challenge.
Power consumption and heat generation of GPU clusters are one of the core challenges that form the overhead of data center GPU infrastructure. AI model training or processing large datasets for simulations is very power hungry, often consuming an order of magnitude more power than CPUs. This results in more cooling demand and greater environmental impact. Normal air cooling cannot handle workloads that rely heavily on the GPU, forcing operators to seek liquid cooling and other advanced thermal management solutions. Such upgrades require capital investment, and the costs of maintaining thermal stability are ongoing and still present obstacles for wider, scalable GPU adoption in data centers.
Data Center GPU Market Segment Analysis
By Deployment, On-premises leads market; cloud deployment grows rapidly with AI and cloud-native adoption.
In 2024, on on-premises segment dominated the market and accounted for the largest revenue share of 53% of the overall market. The growing need for high-performance computing among industries such as defense, finance, and healthcare is likely to be a crucial factor in driving demand for on-premise deployments in the course of the forecast period. Organizations in these domains typically opt for on-premise deployment to ensure that their data is in-house and to minimize the associated security risk, especially when it comes to sensitive or proprietary data.
The cloud segment to witness a robust CAGR throughout the forecast period. GPU Adoption Driven by Cloud Cloud-native applications and AI-as-a-service (AIaaS) continue tailoring the landscape for accelerated computing by enabling AI growth opportunities, driving GPU adoption in the cloud segment. In response to high demand for AI and machine learning services offered in the cloud, cloud providers such as AWS, Microsoft Azure, and Google Cloud are investing heavily in GPU infrastructure.
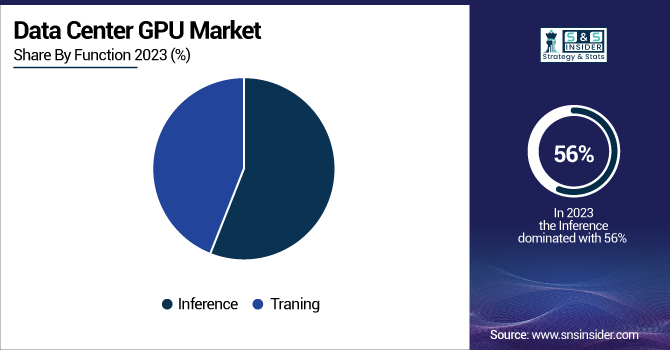
By Function, Inference dominates the market, training segment grows fastest due to deep learning demand.
In 2024, the inference segment dominated the market and accounted for 56% of the revenue share of the market. The inference part is heating up as businesses demand real-time decision-making from their AI models. After training, AI models need efficient inference engines to serve results fast in production applications like chatbots, recommendation engines, and autonomous systems. Able to run these inference workloads, GPUs are better equipped to power these inference workloads due to their parallel processing capabilities and as edge computing and IoT devices are increasingly being deployed across verticals.
The training segment is expected to be the fastest CAGR over the forecast period. The global market for training segment is witnessing traction with the rising need for deep learning models and complex AI training processes. AI models need lots of computational power to be trained and GPUs are specially tailored for this purpose with their ability to efficiently handle parallel computation.
By End Use, Cloud service providers lead GPU the market, government segment shows highest CAGR growth.
In 2024, the cloud service segment dominated the market and accounted for the highest market share. One of the major trends that is expected to boost market growth in the cloud service providers segment is the growing need for artificial intelligence and machine learning based workloads. With the evolution of cloud services, the major CSPs such as Amazon Web Services, Microsoft Azure, and Google Cloud are now providing GPU-accelerated services to accommodate the computational requirements of AI-powered workloads and applications. These GPUs support large-scale processing and deep learning tasks and therefore play an important role across many industries, including healthcare and finance.
The government segment is expected to grow at the fastest CAGR throughout the forecast period. Within the Government segment, the primary force behind GPU adoption is real-time data analytics and high-performance computing to enable numerous public sector initiatives.
Data Center GPU Market Regional Analysis
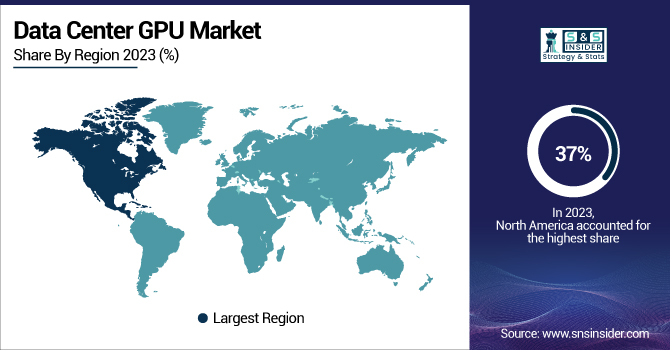
North America Data Center GPU Market Insights
In 2024, North America led the data center GPU market with a share of 37%. The most prominent trend affecting this market in North America is the quick penetration of AI and deep learning technologies in industries like healthcare, finance, and autonomous cars. GPU-related innovation also thrives in the region which is hosting some of the leading technology companies and cloud service providers such as NVIDIA, Amazon and Google.
Asia Pacific Data Center GPU Market Insights
Asia Pacific is projected to be the fastest-growing regional market with a staggering CAGR of 31.93% for the data center GPU market during the forecast period of 2025 to 2032. Smart cities and 5G deployments across Asia Pacific — notably China, Japan, and South Korea are key drivers for demand for GPU-enabled data centers. In this region, nations are moving quickly in the use of AI in retail, manufacturing, and public infrastructure.
Europe Data Center GPU Market Insights
Europe in the Data Center GPU Market is experiencing steady growth driven by rising demand for AI, cloud computing, and high-performance computing applications. Key players such as NVIDIA, AMD, and Intel, along with regional cloud providers, are expanding GPU infrastructure across hyperscale and enterprise data centers. Government initiatives supporting AI research, technological innovation, and digital transformation further strengthen Europe’s position as a significant hub for data center GPU adoption.
Middle East & Africa and Latin America Data Center GPU Market Insights
Middle East & Africa and Latin America in the Data Center GPU Market are witnessing gradual adoption, fueled by growing cloud services, AI applications, and digital transformation initiatives. Increasing investments in data center infrastructure, partnerships with global GPU providers, and demand for high-performance computing in finance, healthcare, and telecommunications are driving market growth. Despite smaller market size compared to North America and Europe, regional opportunities for GPU deployment are expanding steadily.
Get Customized Report as per Your Business Requirement - Enquiry Now
Data Center GPU Market Competitive Landscape:
AMD
Advanced Micro Devices (AMD), founded in 1969, is a global semiconductor leader specializing in high-performance computing, graphics, and adaptive processing solutions. The company develops CPUs, GPUs, and accelerators for gaming, data centers, and AI workloads, focusing on high efficiency, scalability, and innovation. AMD continues to expand its portfolio to meet growing demands for AI, machine learning, and high-performance computing, enabling enterprises and researchers to achieve breakthrough computational performance.
-
June 2024: At Computex 2024, AMD unveiled its expanded AMD Instinct accelerator roadmap, introducing the MI325X accelerator with 288GB of HBM3E memory, slated for availability in Q4 2024.
-
October 2024: AMD announced the MI350 series, based on the CDNA 4 architecture, expected to launch in the second half of 2025, offering up to a 35x improvement in AI inference performance over the previous generation.
Intel
Intel Corporation, founded in 1968, is a global technology leader in semiconductor innovation, producing CPUs, GPUs, memory solutions, and data center technologies. Intel focuses on delivering high-performance, energy-efficient, and AI-optimized hardware for enterprise, cloud, and HPC environments. By continually enhancing its data center and accelerator offerings, Intel empowers organizations to accelerate AI, analytics, and scientific computing workloads, maintaining a strong competitive presence in next-generation computing markets worldwide.
-
April 2025: Intel introduced enhancements to its Data Center GPU Max Series, focusing on improved performance for AI and high-performance computing workloads, aiming to compete more effectively in the data center GPU market.
Key Players
The major key players, along with their products, are
-
Samsung Electronics Co., Ltd.
-
Micron Technology, Inc.
-
Advantech Co., Ltd.
-
Alphabet Inc. (Google)
-
Huawei Technologies Co., Ltd.
-
Advanced Micro Devices, Inc. (AMD)
-
Intel Corporation
-
Qualcomm Technologies, Inc.
-
Google LLC
-
Amazon Web Services (AWS)
-
IBM Corporation
-
Alibaba Cloud
-
Graphcore Ltd.
-
ASUS
-
Dell Technologies
-
Gigabyte Technology
-
Hewlett-Packard Enterprise (HPE)
-
Super Micro Computer, Inc.
|
Report Attributes |
Details |
|
Market Size in 2024 |
USD 23.87 Billion |
|
Market Size by 2032 |
USD 201.64 Billion |
|
CAGR |
CAGR of 30.57% From 2025 to 2032 |
|
Base Year |
2024 |
|
Forecast Period |
2025-2032 |
|
Historical Data |
2021-2023 |
|
Report Scope & Coverage |
Market Size, Segments Analysis, Competitive Landscape, Regional Analysis, DROC & SWOT Analysis, Forecast Outlook |
|
Key Segments |
• By Deployment (On-premises, Cloud) |
|
Regional Analysis/Coverage |
North America (US, Canada, Mexico), Europe (Eastern Europe [Poland, Romania, Hungary, Turkey, Rest of Eastern Europe] Western Europe] Germany, France, UK, Italy, Spain, Netherlands, Switzerland, Austria, Rest of Western Europe]), Asia Pacific (China, India, Japan, South Korea, Vietnam, Singapore, Australia, Rest of Asia Pacific), Middle East & Africa (Middle East [UAE, Egypt, Saudi Arabia, Qatar, Rest of Middle East], Africa [Nigeria, South Africa, Rest of Africa], Latin America (Brazil, Argentina, Colombia, Rest of Latin America) |
|
Company Profiles |
Samsung Electronics Co., Ltd., Micron Technology, Inc., Advantech Co., Ltd., Alphabet Inc. (Google), Huawei Technologies Co., Ltd., NVIDIA Corporation, Advanced Micro Devices, Inc. (AMD), Intel Corporation, Qualcomm Technologies, Inc., Google LLC, Amazon Web Services (AWS), Microsoft Azure, IBM Corporation, Alibaba Cloud, Graphcore Ltd., ASUS, Dell Technologies, Gigabyte Technology, Hewlett-Packard Enterprise (HPE), Super Micro Computer, Inc. |
