image

Data Center Blade Server Market Report Scope & Overview:

Data Center Blade Server Market was valued at USD 17.12 billion in 2023 and is expected to reach USD 37.35 billion by 2032, growing at a CAGR of 9.12% from 2024-2032 

This report highlights key factors driving market growth, such as power consumption and efficiency improvements, with blade servers offering enhanced energy use and cost reductions. It also discusses CAPEX and OPEX trends, showcasing the balance between investment in infrastructure and long-term operational costs. Data center expansion, fueled by increased demand for data processing and storage, is another crucial factor. Additionally, the impact of virtualization in optimizing resources and enhancing server utilization is explored. The report also touches on the average server lifetime, indicating the trend toward longer-lasting and more durable server solutions to support evolving business needs.

U.S. Data Center Blade Server Market was valued at USD 5.00 billion in 2023 and is expected to reach USD 11.04 billion by 2032, growing at a CAGR of 9.19% from 2024-2032

The growth of the Data Center Blade Server Market is driven by the increasing demand for efficient and scalable data storage solutions, as businesses expand their digital infrastructure. Blade servers offer superior power efficiency, reducing operational costs and improving energy use. Additionally, the rise of data center expansions, virtualization technologies, and the need for high-performance computing to support cloud services, big data, and AI applications are further boosting market growth. These factors contribute to the projected market growth at a CAGR of 9.12%.

Market Dynamics

Drivers

  • Rising Demand for High-Performance Servers to Manage Increasing Business Data Drives Growth in Data Center Blade Server Market

The rapid growth in the data produced by companies from various industries has generated a critical need for sophisticated infrastructure that can efficiently handle and store huge pools of information. As organizations increasingly depend on digitalization, firms need high-capacity and strong servers to process the increasing data volume. Data centers are constantly being challenged to deliver faster data processing and secure storage solutions to accommodate new technologies such as AI, machine learning, and big data analytics. Consequently, the need for high-performance, scalable, and energy-efficient server systems, including blade servers, has increased. Blade servers provide maximum performance and can process heavy workloads, enabling companies to address the changing needs of data processing, storage, and accessibility.

Restraints

  • High Energy Consumption and Operational Costs of Blade Servers Pose Challenges for Large-Scale Data Center Deployments

While more energy-efficient than their traditional server counterparts, blade servers also need a significant amount of power, especially when utilized at large-scale data centers. As more servers are installed to satisfy increasing data requirements, overall power consumption increases exponentially. This can result in higher operational expenses, particularly for companies that are dependent on heavy data processing needs. For highly dense data centers with a lot of servers, the power demands not only contribute to electricity charges but also necessitate strong cooling systems, further increasing expenses. Moreover, with sustainability emerging as a key issue for most organizations, the green impact of high energy usage might become an issue in the future. These issues underscore the persistent issue of operational efficiency for massive blade server deployments in data centers.

Opportunities

  • Increasing Demand for Blade Servers Driven by the Rise of AI, Machine Learning, and Big Data Analytics

The increasing use of artificial intelligence (AI), machine learning, and big data analytics is driving the demand for high-performance computing infrastructure substantially. These technologies demand high-performance servers that can support complex data processing operations and execute advanced algorithms in real-time. With companies from different industries making investments in AI-based innovations and data analytics for insights and enhanced decision-making, the need for blade servers to support these high-intensity workloads is growing. Blade servers, being scalable, energy-efficient, and having the capacity to handle large volumes of data, are particularly suited to address these challenges. This trend offers an attractive opportunity for the data center blade server market to support the growing computational needs of AI, machine learning, and big data applications.

Challenges

  • Compatibility Issues Between Blade Servers and Legacy Systems Complicate Integration in Modern Data Center Upgrades

The integration of new blade server technology with existing infrastructure can be a complex and time-consuming process for many organizations. As data centers continue to modernize, compatibility issues commonly occur when trying to integrate advanced blade servers with existing legacy systems. These compatibility issues can hinder deployment and incur further costs to businesses as they need to adapt or replace their legacy infrastructure. In addition, facilitating smooth communication between new and old components involves meticulous planning, technical expertise, and resources. Organizations can experience delays in achieving the full potential of their blade server investments, as they struggle to harmonize old and new technologies. This integration issue can be a major obstacle for companies seeking to upgrade their data centers while ensuring business continuity.

Segment Analysis

By Application

The Virtualization and Cloud Computing segment dominated the Data Center Blade Server Market with a revenue share of over 33% in 2023, courtesy of increased usage of cloud solutions and higher adoption of virtualized environments. The efficiency, scalability, and performance of blade servers make them particularly suitable to enable cloud infrastructure as well as virtualized workloads. As companies keep migrating to cloud environments, the demand for robust, stable blade servers in these spaces keeps increasing.

The AI and Machine Learning Workloads segment is anticipated to grow at the fastest CAGR of approximately 11.82% during 2024-2032 due to the fact that these technologies demand high computational capacity and data processing capabilities. Blade servers are well-suited to meet the needs of AI and machine learning applications, providing the necessary performance for running complex algorithms and large-scale data sets. As AI adoption increases across industries, the demand for blade servers to support these workloads is expected to grow rapidly.

By Form Factor

The Half-height Blade Server segment led the Data Center Blade Server Market with the largest revenue share of nearly 50% in 2023 because of its perfect blend of performance, space utilization, and affordability. These servers offer a compact form factor, which enables greater density and improved use of scarce data center space, making them extremely appealing to companies that must maximize their infrastructure without sacrificing computing power. Their scalability and flexibility further propel their usage in contemporary data centers.

The Full-height Blade Server market is anticipated to expand at the fastest CAGR of approximately 10.34% during 2024-2032 because it can process more powerful tasks and support higher-performance workloads. These servers offer more expansion possibilities, with higher capacity for high-end applications like AI, big data analytics, and virtualization. With growing demand for more sophisticated computational capabilities, full-height blade servers are emerging as a popular option for data centers with high growth needs.

By Channel

Direct segment led the Data Center Blade Server Market with the largest revenue share of approximately 51% in 2023 owing to its model of direct procurement, which provides companies the flexibility to design their server infrastructure based on certain requirements. Companies that need customized solutions, effective configurations, and strong post-sales support tend to prefer buying directly from the manufacturers. This strategy is more in control of product selection, pricing, and service, contributing to the domination of the direct segment in the market.

The Reseller segment is projected to grow at the fastest CAGR of nearly 11% between 2024 and 2032 due to growing demand for third-party distribution networks and sales channels. Resellers are instrumental in providing data center solutions to small and medium-sized enterprises that do not have direct dealings with manufacturers. With growing needs for cost-efficient solutions and access to professional guidance, resellers are likely to witness high growth, keeping pace with the growing requirement for blade server deployment.

By End-use

The BFSI segment led the Data Center Blade Server Market with the largest revenue share of approximately 32% in 2023 because of the urgent requirement for high-performance servers to handle massive amounts of financial transactions, data storage, and security needs. Financial institutions need secure, reliable, and scalable server solutions to facilitate their operations, maintain data integrity, and meet regulatory requirements. Blade servers provide the performance, reliability, and security required to fulfill these requirements, leading BFSI's market dominance.

The IT & Telecom sector is expected to expand at the fastest CAGR of around 10.72% from 2024-2032 because of the extensive growth in network infrastructure and growing demand for data processing and storage. With 5G, IoT, and digital transformation taking over, the telecom and IT industries require blade servers with high performance to deliver large-scale and high-speed data transmission and services. With increasing growth in these technologies, demand for scalable, efficient server solutions in the IT & Telecom market is expected to grow at a rapid pace.

Regional Analysis

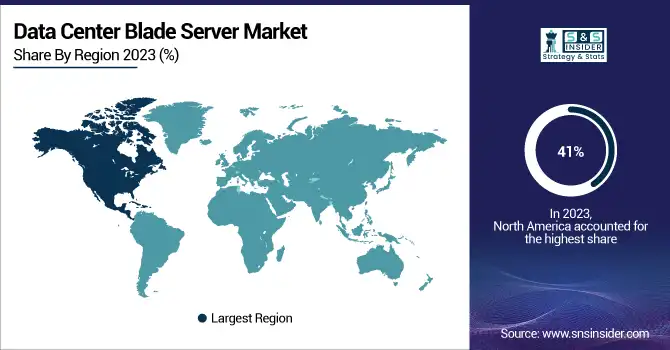
North America dominated the Data Center Blade Server Market with the highest revenue share of about 41% in 2023 due to its advanced technological infrastructure, widespread adoption of cloud computing, and high demand for data processing power across various industries. The region is home to major data center operators, tech giants, and financial institutions, all of which rely heavily on blade servers to support their critical operations. The focus on innovation and digital transformation also fuels North America's market dominance.

Asia Pacific is expected to grow at the fastest CAGR of about 9.47% from 2024-2032 due to rapid technological advancements, increased investment in IT infrastructure, and growing data center demand driven by the region’s booming digital economy. The expansion of cloud services, e-commerce, and industries such as AI, IoT, and telecommunications in countries like China, India, and Japan is driving the demand for high-performance blade servers, contributing to the region’s rapid market growth.

Key Players

  • Cisco Systems, Inc. (Cisco UCS B-Series Blade Servers, Cisco Nexus 9000 Series)

  • Dell Inc. (PowerEdge M-Series Blade Servers, Dell VRTX)

  • FUJITSU (PRIMERGY BX900 Blade Servers, Fujitsu Integrated System PRIMEFLEX)

  • Hewlett Packard Enterprise Development LP (HPE BladeSystem c-Class, HPE Synergy)

  • Huawei (FusionServer Pro 2288H V5 Blade Servers, Huawei CloudEngine Blade Switches)

  • IBM (IBM BladeCenter HS23, IBM Power Systems Servers)

  • INSPUR Co., Ltd. (Inspur NF5280M5 Blade Servers, Inspur AS9000 Blade Servers)

  • Lenovo (Lenovo ThinkSystem SN550 Blade Server, Lenovo Flex System x240 Blade Server)

  • Oracle (Oracle Server X8-2, Oracle Sun Blade 6000)

  • Super Micro Computer, Inc. (SuperBlade 8019, Supermicro TwinPro Blade Servers)

  • H3C (H3C UniBlade Series, H3C S12500X Blade Switch)

  • Mellanox Technologies (Mellanox Spectrum Ethernet Switch, Mellanox InfiniBand ConnectX Adapter)

  • Broadcom (Broadcom Ethernet Adapters, Broadcom NetXtreme II 10GbE Blade)

  • Sugon (Sugon 7200 Blade Server, Sugon 5100 Blade Server)

  • Wiwynn (Wiwynn M-series Blade Servers, Wiwynn T-series Servers)

  • Quanta Computer (Quanta Blade Servers, QuantaGrid D52B-1U Servers)

  • Netronome (Netronome Agilio CX, Agilio SmartNICs)

Recent Developments:

  • In February 2025, Cisco introduced its N9300 Series Smart Switches, integrating AMD Pensando data processing units (DPUs) to redefine data center architecture, enhancing AI design capabilities with advanced networking and security services.

  • In March 2025, Dell unveiled the PowerEdge XE8712 server at NVIDIA GTC, designed for AI and high-performance computing workloads. It integrates NVIDIA’s GB200 Grace Blackwell Superchip, setting new benchmarks in AI-powered server performance.

Data Center Blade Server Market Report Scope:

Report Attributes Details
Market Size in 2023 USD 17.12 Billion
Market Size by 2032 USD 37.35 Billion
CAGR CAGR of 9.12% From 2024 to 2032
Base Year 2023
Forecast Period 2024-2032
Historical Data 2020-2022
Report Scope & Coverage Market Size, Segments Analysis, Competitive  Landscape, Regional Analysis, DROC & SWOT Analysis, Forecast Outlook
Key Segments • By Form Factor (Half-height Blade Server, Full-height Blade Server, Quarter-height Blade Server)
• By Channel (Direct, Reseller, Systems Integrator, Others)
• By Application (Virtualization and Cloud Computing, High-performance Computing (HPC), Storage and Backup, Web Hosting, Database Management, AI and Machine Learning Workloads)
• By End-use (BFSI, Healthcare, Energy, IT & Telecom, Government & Defense, Others)
Regional Analysis/Coverage North America (US, Canada, Mexico), Europe (Eastern Europe [Poland, Romania, Hungary, Turkey, Rest of Eastern Europe] Western Europe] Germany, France, UK, Italy, Spain, Netherlands, Switzerland, Austria, Rest of Western Europe]), Asia Pacific (China, India, Japan, South Korea, Vietnam, Singapore, Australia, Rest of Asia Pacific), Middle East & Africa (Middle East [UAE, Egypt, Saudi Arabia, Qatar, Rest of Middle East], Africa [Nigeria, South Africa, Rest of Africa], Latin America (Brazil, Argentina, Colombia, Rest of Latin America)
Company Profiles Cisco Systems, Inc., Dell Inc., FUJITSU, Hewlett Packard Enterprise Development LP, Huawei, IBM, INSPUR Co., Ltd., Lenovo, Oracle, Super Micro Computer, Inc., H3C, Mellanox Technologies, Broadcom, Sugon, Wiwynn, Quanta Computer, Netronome

Frequently Asked Questions

ANS: Data Center Blade Server Market was valued at USD 17.12 billion in 2023 and is expected to reach USD 37.35 billion by 2032, growing at a CAGR of 9.12% from 2024-2032 

ANS: The Virtualization and Cloud Computing segment dominated with a 33% market share in 2023.

ANS: North America held the largest market share of about 41% in 2023.

ANS: The AI and Machine Learning Workloads segment is expected to grow at a CAGR of 11.82% from 2024-2032.

ANS: The Full-height Blade Server segment is expected to grow at a CAGR of 10.34% from 2024-2032.

Table of Contents

1. Introduction

1.1 Market Definition

1.2 Scope (Inclusion and Exclusions)

1.3 Research Assumptions

2. Executive Summary

2.1 Market Overview

2.2 Regional Synopsis

2.3 Competitive Summary

3. Research Methodology

3.1 Top-Down Approach

3.2 Bottom-up Approach

3.3. Data Validation

3.4 Primary Interviews

4. Market Dynamics Impact Analysis

4.1 Market Driving Factors Analysis

4.1.1 Drivers

4.1.2 Restraints

4.1.3 Opportunities

4.1.4 Challenges

4.2 PESTLE Analysis

4.3 Porter’s Five Forces Model

5. Statistical Insights and Trends Reporting

5.1 Power Consumption and Efficiency

5.2 Capex and Opex Trends

5.3 Data Center Expansion

5.4 Virtualization Impact

5.5 Average Server Lifetime

6. Competitive Landscape

6.1 List of Major Companies, By Region

6.2 Market Share Analysis, By Region

6.3 Product Benchmarking

6.3.1 Product specifications and features

6.3.2 Pricing

6.4 Strategic Initiatives

6.4.1 Marketing and promotional activities

6.4.2 Distribution and supply chain strategies

6.4.3 Expansion plans and new product launches

6.4.4 Strategic partnerships and collaborations

6.5 Technological Advancements

6.6 Market Positioning and Branding

7. Data Center Blade Server Market Segmentation, By Form Factor

7.1 Chapter Overview

7.2 Half-height Blade Server

7.2.1 Half-height Blade Server Market Trends Analysis (2020-2032)

7.2.2 Half-height Blade Server Market Size Estimates and Forecasts to 2032 (USD Billion)

7.3 Full-height Blade Server

7.3.1 Full-height Blade Server Market Trends Analysis (2020-2032)

7.3.2 Full-height Blade Server Market Size Estimates and Forecasts to 2032 (USD Billion)

7.4 Quarter-height Blade Server

7.4.1 Quarter-height Blade Server Market Trends Analysis (2020-2032)

7.4.2 Quarter-height Blade Server Market Size Estimates and Forecasts to 2032 (USD Billion)

8. Data Center Blade Server Market Segmentation, By Application

8.1 Chapter Overview

8.2 Virtualization and Cloud Computing

8.2.1 Virtualization and Cloud Computing Market Trends Analysis (2020-2032)

8.2.2 Virtualization and Cloud Computing Market Size Estimates and Forecasts to 2032 (USD Billion)

8.3 High-performance Computing (HPC)

8.3.1 High-performance Computing (HPC) Market Trends Analysis (2020-2032)

8.3.2 High-performance Computing (HPC) Market Size Estimates and Forecasts to 2032 (USD Billion)

8.4 Storage and Backup

8.4.1 Storage and Backup Market Trends Analysis (2020-2032)

8.4.2 Storage and Backup Market Size Estimates and Forecasts to 2032 (USD Billion)

8.5 Web Hosting

8.5.1 Web Hosting Market Trends Analysis (2020-2032)

8.5.2 Web Hosting Market Size Estimates and Forecasts to 2032 (USD Billion)

8.6 Database Management

8.6.1 Database Management Market Trends Analysis (2020-2032)

8.6.2 Database Management Market Size Estimates and Forecasts to 2032 (USD Billion)

8.7 AI and Machine Learning Workloads

8.7.1 AI and Machine Learning Workloads Market Trends Analysis (2020-2032)

8.7.2 AI and Machine Learning Workloads Market Size Estimates and Forecasts to 2032 (USD Billion)

9. Data Center Blade Server Market Segmentation, By End-use

9.1 Chapter Overview

9.2 BFSI

9.2.1 BFSI Market Trends Analysis (2020-2032)

9.2.2 BFSI Market Size Estimates and Forecasts to 2032 (USD Billion)

9.3 Healthcare

9.3.1 Healthcare Market Trends Analysis (2020-2032)

9.3.2 Healthcare Market Size Estimates and Forecasts to 2032 (USD Billion)

9.4 Energy

               9.4.1 Energy Market Trends Analysis (2020-2032)

9.4.2 Energy Market Size Estimates and Forecasts to 2032 (USD Billion)

9.5 IT & Telecom

9.5.1 IT & Telecom Market Trends Analysis (2020-2032)

9.5.2 IT & Telecom Market Size Estimates and Forecasts to 2032 (USD Billion)

9.6 Government & Defense

9.6.1 Government & Defense Market Trends Analysis (2020-2032)

9.6.2 Government & Defense Market Size Estimates and Forecasts to 2032 (USD Billion)

9.7 Others

9.7.1 Others Market Trends Analysis (2020-2032)

9.7.2 Others Market Size Estimates and Forecasts to 2032 (USD Billion)

10. Data Center Blade Server Market Segmentation, By Channel

10.1 Chapter Overview

10.2 Direct

10.2.1 Direct Market Trends Analysis (2020-2032)

10.2.2 Direct Market Size Estimates and Forecasts to 2032 (USD Billion)

10.3 Reseller

10.3.1 Reseller Market Trends Analysis (2020-2032)

10.3.2 Reseller Market Size Estimates and Forecasts to 2032 (USD Billion)

10.4 Systems Integrator

               10.4.1 Systems Integrator Market Trends Analysis (2020-2032)

10.4.2 Systems Integrator Market Size Estimates and Forecasts to 2032 (USD Billion)

10.5 Others

10.5.1 Others Market Trends Analysis (2020-2032)

10.5.2 Others Market Size Estimates and Forecasts to 2032 (USD Billion)

11. Regional Analysis

11.1 Chapter Overview

11.2 North America

11.2.1 Trends Analysis

11.2.2 North America Data Center Blade Server Market Estimates and Forecasts, by Country (2020-2032) (USD Billion)

11.2.3 North America Data Center Blade Server Market Estimates and Forecasts, By Form Factor (2020-2032) (USD Billion) 

11.2.4 North America Data Center Blade Server Market Estimates and Forecasts, By Application (2020-2032) (USD Billion)

11.2.5 North America Data Center Blade Server Market Estimates and Forecasts, By End-use (2020-2032) (USD Billion)

11.2.6 North America Data Center Blade Server Market Estimates and Forecasts, By Channel (2020-2032) (USD Billion)

11.2.7 USA

11.2.7.1 USA Data Center Blade Server Market Estimates and Forecasts, By Form Factor (2020-2032) (USD Billion)

11.2.7.2 USA Data Center Blade Server Market Estimates and Forecasts, By Application (2020-2032) (USD Billion)

11.2.7.3 USA Data Center Blade Server Market Estimates and Forecasts, By End-use (2020-2032) (USD Billion)

11.2.7.4 USA Data Center Blade Server Market Estimates and Forecasts, By Channel (2020-2032) (USD Billion)

11.2.8 Canada

11.2.8.1 Canada Data Center Blade Server Market Estimates and Forecasts, By Form Factor (2020-2032) (USD Billion)

11.2.8.2 Canada Data Center Blade Server Market Estimates and Forecasts, By Application (2020-2032) (USD Billion)

11.2.8.3 Canada Data Center Blade Server Market Estimates and Forecasts, By End-use (2020-2032) (USD Billion)

11.2.8.4 Canada Data Center Blade Server Market Estimates and Forecasts, By Channel (2020-2032) (USD Billion)

11.2.9 Mexico

11.2.9.1 Mexico Data Center Blade Server Market Estimates and Forecasts, By Form Factor (2020-2032) (USD Billion)

11.2.9.2 Mexico Data Center Blade Server Market Estimates and Forecasts, By Application (2020-2032) (USD Billion)

11.2.9.3 Mexico Data Center Blade Server Market Estimates and Forecasts, By End-use (2020-2032) (USD Billion)

11.2.9.4 Mexico Data Center Blade Server Market Estimates and Forecasts, By Channel (2020-2032) (USD Billion)

11.3 Europe

11.3.1 Eastern Europe

11.3.1.1 Trends Analysis

11.3.1.2 Eastern Europe Data Center Blade Server Market Estimates and Forecasts, by Country (2020-2032) (USD Billion)

11.3.1.3 Eastern Europe Data Center Blade Server Market Estimates and Forecasts, By Form Factor (2020-2032) (USD Billion) 

11.3.1.4 Eastern Europe Data Center Blade Server Market Estimates and Forecasts, By Application (2020-2032) (USD Billion)

11.3.1.5 Eastern Europe Data Center Blade Server Market Estimates and Forecasts, By End-use (2020-2032) (USD Billion)

11.3.1.6 Eastern Europe Data Center Blade Server Market Estimates and Forecasts, By Channel (2020-2032) (USD Billion)

11.3.1.7 Poland

11.3.1.7.1 Poland Data Center Blade Server Market Estimates and Forecasts, By Form Factor (2020-2032) (USD Billion)

11.3.1.7.2 Poland Data Center Blade Server Market Estimates and Forecasts, By Application (2020-2032) (USD Billion)

11.3.1.7.3 Poland Data Center Blade Server Market Estimates and Forecasts, By End-use (2020-2032) (USD Billion)

11.3.1.7.4 Poland Data Center Blade Server Market Estimates and Forecasts, By Channel (2020-2032) (USD Billion)

11.3.1.8 Romania

11.3.1.8.1 Romania Data Center Blade Server Market Estimates and Forecasts, By Form Factor (2020-2032) (USD Billion)

11.3.1.8.2 Romania Data Center Blade Server Market Estimates and Forecasts, By Application (2020-2032) (USD Billion)

11.3.1.8.3 Romania Data Center Blade Server Market Estimates and Forecasts, By End-use (2020-2032) (USD Billion)

11.3.1.8.4 Romania Data Center Blade Server Market Estimates and Forecasts, By Channel (2020-2032) (USD Billion)

11.3.1.9 Hungary

11.3.1.9.1 Hungary Data Center Blade Server Market Estimates and Forecasts, By Form Factor (2020-2032) (USD Billion)

11.3.1.9.2 Hungary Data Center Blade Server Market Estimates and Forecasts, By Application (2020-2032) (USD Billion)

11.3.1.9.3 Hungary Data Center Blade Server Market Estimates and Forecasts, By End-use (2020-2032) (USD Billion)

11.3.1.9.4 Hungary Data Center Blade Server Market Estimates and Forecasts, By Channel (2020-2032) (USD Billion)

11.3.1.10 Turkey

11.3.1.10.1 Turkey Data Center Blade Server Market Estimates and Forecasts, By Form Factor (2020-2032) (USD Billion)

11.3.1.10.2 Turkey Data Center Blade Server Market Estimates and Forecasts, By Application (2020-2032) (USD Billion)

11.3.1.10.3 Turkey Data Center Blade Server Market Estimates and Forecasts, By End-use (2020-2032) (USD Billion)

11.3.1.10.4 Turkey Data Center Blade Server Market Estimates and Forecasts, By Channel (2020-2032) (USD Billion)

11.3.1.11 Rest of Eastern Europe

11.3.1.11.1 Rest of Eastern Europe Data Center Blade Server Market Estimates and Forecasts, By Form Factor (2020-2032) (USD Billion)

11.3.1.11.2 Rest of Eastern Europe Data Center Blade Server Market Estimates and Forecasts, By Application (2020-2032) (USD Billion)

11.3.1.11.3 Rest of Eastern Europe Data Center Blade Server Market Estimates and Forecasts, By End-use (2020-2032) (USD Billion)

11.3.1.11.4 Rest of Eastern Europe Data Center Blade Server Market Estimates and Forecasts, By Channel (2020-2032) (USD Billion)

11.3.2 Western Europe

11.3.2.1 Trends Analysis

11.3.2.2 Western Europe Data Center Blade Server Market Estimates and Forecasts, by Country (2020-2032) (USD Billion)

11.3.2.3 Western Europe Data Center Blade Server Market Estimates and Forecasts, By Form Factor (2020-2032) (USD Billion) 

11.3.2.4 Western Europe Data Center Blade Server Market Estimates and Forecasts, By Application (2020-2032) (USD Billion)

11.3.2.5 Western Europe Data Center Blade Server Market Estimates and Forecasts, By End-use (2020-2032) (USD Billion)

11.3.2.6 Western Europe Data Center Blade Server Market Estimates and Forecasts, By Channel (2020-2032) (USD Billion)

11.3.2.7 Germany

11.3.2.7.1 Germany Data Center Blade Server Market Estimates and Forecasts, By Form Factor (2020-2032) (USD Billion)

11.3.2.7.2 Germany Data Center Blade Server Market Estimates and Forecasts, By Application (2020-2032) (USD Billion)

11.3.2.7.3 Germany Data Center Blade Server Market Estimates and Forecasts, By End-use (2020-2032) (USD Billion)

11.3.2.7.4 Germany Data Center Blade Server Market Estimates and Forecasts, By Channel (2020-2032) (USD Billion)

11.3.2.8 France

11.3.2.8.1 France Data Center Blade Server Market Estimates and Forecasts, By Form Factor (2020-2032) (USD Billion)

11.3.2.8.2 France Data Center Blade Server Market Estimates and Forecasts, By Application (2020-2032) (USD Billion)

11.3.2.8.3 France Data Center Blade Server Market Estimates and Forecasts, By End-use (2020-2032) (USD Billion)

11.3.2.8.4 France Data Center Blade Server Market Estimates and Forecasts, By Channel (2020-2032) (USD Billion)

11.3.2.9 UK

11.3.2.9.1 UK Data Center Blade Server Market Estimates and Forecasts, By Form Factor (2020-2032) (USD Billion)

11.3.2.9.2 UK Data Center Blade Server Market Estimates and Forecasts, By Application (2020-2032) (USD Billion)

11.3.2.9.3 UK Data Center Blade Server Market Estimates and Forecasts, By End-use (2020-2032) (USD Billion)

11.3.2.9.4 UK Data Center Blade Server Market Estimates and Forecasts, By Channel (2020-2032) (USD Billion)

11.3.2.10 Italy

11.3.2.10.1 Italy Data Center Blade Server Market Estimates and Forecasts, By Form Factor (2020-2032) (USD Billion)

11.3.2.10.2 Italy Data Center Blade Server Market Estimates and Forecasts, By Application (2020-2032) (USD Billion)

11.3.2.10.3 Italy Data Center Blade Server Market Estimates and Forecasts, By End-use (2020-2032) (USD Billion)

11.3.2.10.4 Italy Data Center Blade Server Market Estimates and Forecasts, By Channel (2020-2032) (USD Billion)

11.3.2.11 Spain

11.3.2.11.1 Spain Data Center Blade Server Market Estimates and Forecasts, By Form Factor (2020-2032) (USD Billion)

11.3.2.11.2 Spain Data Center Blade Server Market Estimates and Forecasts, By Application (2020-2032) (USD Billion)

11.3.2.11.3 Spain Data Center Blade Server Market Estimates and Forecasts, By End-use (2020-2032) (USD Billion)

11.3.2.11.4 Spain Data Center Blade Server Market Estimates and Forecasts, By Channel (2020-2032) (USD Billion)

11.3.2.12 Netherlands

11.3.2.12.1 Netherlands Data Center Blade Server Market Estimates and Forecasts, By Form Factor (2020-2032) (USD Billion)

11.3.2.12.2 Netherlands Data Center Blade Server Market Estimates and Forecasts, By Application (2020-2032) (USD Billion)

11.3.2.12.3 Netherlands Data Center Blade Server Market Estimates and Forecasts, By End-use (2020-2032) (USD Billion)

11.3.2.12.4 Netherlands Data Center Blade Server Market Estimates and Forecasts, By Channel (2020-2032) (USD Billion)

11.3.2.13 Switzerland

11.3.2.13.1 Switzerland Data Center Blade Server Market Estimates and Forecasts, By Form Factor (2020-2032) (USD Billion)

11.3.2.13.2 Switzerland Data Center Blade Server Market Estimates and Forecasts, By Application (2020-2032) (USD Billion)

11.3.2.13.3 Switzerland Data Center Blade Server Market Estimates and Forecasts, By End-use (2020-2032) (USD Billion)

11.3.2.13.4 Switzerland Data Center Blade Server Market Estimates and Forecasts, By Channel (2020-2032) (USD Billion)

11.3.2.14 Austria

11.3.2.14.1 Austria Data Center Blade Server Market Estimates and Forecasts, By Form Factor (2020-2032) (USD Billion)

11.3.2.14.2 Austria Data Center Blade Server Market Estimates and Forecasts, By Application (2020-2032) (USD Billion)

11.3.2.14.3 Austria Data Center Blade Server Market Estimates and Forecasts, By End-use (2020-2032) (USD Billion)

11.3.2.14.4 Austria Data Center Blade Server Market Estimates and Forecasts, By Channel (2020-2032) (USD Billion)

11.3.2.15 Rest of Western Europe

11.3.2.15.1 Rest of Western Europe Data Center Blade Server Market Estimates and Forecasts, By Form Factor (2020-2032) (USD Billion)

11.3.2.15.2 Rest of Western Europe Data Center Blade Server Market Estimates and Forecasts, By Application (2020-2032) (USD Billion)

11.3.2.15.3 Rest of Western Europe Data Center Blade Server Market Estimates and Forecasts, By End-use (2020-2032) (USD Billion)

11.3.2.15.4 Rest of Western Europe Data Center Blade Server Market Estimates and Forecasts, By Channel (2020-2032) (USD Billion)

11.4 Asia Pacific

11.4.1 Trends Analysis

11.4.2 Asia Pacific Data Center Blade Server Market Estimates and Forecasts, by Country (2020-2032) (USD Billion)

11.4.3 Asia Pacific Data Center Blade Server Market Estimates and Forecasts, By Form Factor (2020-2032) (USD Billion) 

11.4.4 Asia Pacific Data Center Blade Server Market Estimates and Forecasts, By Application (2020-2032) (USD Billion)

11.4.5 Asia Pacific Data Center Blade Server Market Estimates and Forecasts, By End-use (2020-2032) (USD Billion)

11.4.6 Asia Pacific Data Center Blade Server Market Estimates and Forecasts, By Channel (2020-2032) (USD Billion)

11.4.7 China

11.4.7.1 China Data Center Blade Server Market Estimates and Forecasts, By Form Factor (2020-2032) (USD Billion)

11.4.7.2 China Data Center Blade Server Market Estimates and Forecasts, By Application (2020-2032) (USD Billion)

11.4.7.3 China Data Center Blade Server Market Estimates and Forecasts, By End-use (2020-2032) (USD Billion)

11.4.7.4 China Data Center Blade Server Market Estimates and Forecasts, By Channel (2020-2032) (USD Billion)

11.4.8 India

11.4.8.1 India Data Center Blade Server Market Estimates and Forecasts, By Form Factor (2020-2032) (USD Billion)

11.4.8.2 India Data Center Blade Server Market Estimates and Forecasts, By Application (2020-2032) (USD Billion)

11.4.8.3 India Data Center Blade Server Market Estimates and Forecasts, By End-use (2020-2032) (USD Billion)

11.4.8.4 India Data Center Blade Server Market Estimates and Forecasts, By Channel (2020-2032) (USD Billion)

11.4.9 Japan

11.4.9.1 Japan Data Center Blade Server Market Estimates and Forecasts, By Form Factor (2020-2032) (USD Billion)

11.4.9.2 Japan Data Center Blade Server Market Estimates and Forecasts, By Application (2020-2032) (USD Billion)

11.4.9.3 Japan Data Center Blade Server Market Estimates and Forecasts, By End-use (2020-2032) (USD Billion)

11.4.9.4 Japan Data Center Blade Server Market Estimates and Forecasts, By Channel (2020-2032) (USD Billion)

11.4.10 South Korea

11.4.10.1 South Korea Data Center Blade Server Market Estimates and Forecasts, By Form Factor (2020-2032) (USD Billion)

11.4.10.2 South Korea Data Center Blade Server Market Estimates and Forecasts, By Application (2020-2032) (USD Billion)

11.4.10.3 South Korea Data Center Blade Server Market Estimates and Forecasts, By End-use (2020-2032) (USD Billion)

11.4.10.4 South Korea Data Center Blade Server Market Estimates and Forecasts, By Channel (2020-2032) (USD Billion)

11.4.11 Vietnam

11.4.11.1 Vietnam Data Center Blade Server Market Estimates and Forecasts, By Form Factor (2020-2032) (USD Billion)

11.4.11.2 Vietnam Data Center Blade Server Market Estimates and Forecasts, By Application (2020-2032) (USD Billion)

11.4.11.3 Vietnam Data Center Blade Server Market Estimates and Forecasts, By End-use (2020-2032) (USD Billion)

11.4.11.4 Vietnam Data Center Blade Server Market Estimates and Forecasts, By Channel (2020-2032) (USD Billion)

11.4.12 Singapore

11.4.12.1 Singapore Data Center Blade Server Market Estimates and Forecasts, By Form Factor (2020-2032) (USD Billion)

11.4.12.2 Singapore Data Center Blade Server Market Estimates and Forecasts, By Application (2020-2032) (USD Billion)

11.4.12.3 Singapore Data Center Blade Server Market Estimates and Forecasts, By End-use (2020-2032) (USD Billion)

11.4.12.4 Singapore Data Center Blade Server Market Estimates and Forecasts, By Channel (2020-2032) (USD Billion)

11.4.13 Australia

11.4.13.1 Australia Data Center Blade Server Market Estimates and Forecasts, By Form Factor (2020-2032) (USD Billion)

11.4.13.2 Australia Data Center Blade Server Market Estimates and Forecasts, By Application (2020-2032) (USD Billion)

11.4.13.3 Australia Data Center Blade Server Market Estimates and Forecasts, By End-use (2020-2032) (USD Billion)

11.4.13.4 Australia Data Center Blade Server Market Estimates and Forecasts, By Channel (2020-2032) (USD Billion)

11.4.14 Rest of Asia Pacific

11.4.14.1 Rest of Asia Pacific Data Center Blade Server Market Estimates and Forecasts, By Form Factor (2020-2032) (USD Billion)

11.4.14.2 Rest of Asia Pacific Data Center Blade Server Market Estimates and Forecasts, By Application (2020-2032) (USD Billion)

11.4.14.3 Rest of Asia Pacific Data Center Blade Server Market Estimates and Forecasts, By End-use (2020-2032) (USD Billion)

11.4.14.4 Rest of Asia Pacific Data Center Blade Server Market Estimates and Forecasts, By Channel (2020-2032) (USD Billion)

11.5 Middle East and Africa

11.5.1 Middle East

11.5.1.1 Trends Analysis

11.5.1.2 Middle East Data Center Blade Server Market Estimates and Forecasts, by Country (2020-2032) (USD Billion)

11.5.1.3 Middle East Data Center Blade Server Market Estimates and Forecasts, By Form Factor (2020-2032) (USD Billion) 

11.5.1.4 Middle East Data Center Blade Server Market Estimates and Forecasts, By Application (2020-2032) (USD Billion)

11.5.1.5 Middle East Data Center Blade Server Market Estimates and Forecasts, By End-use (2020-2032) (USD Billion)

11.5.1.6 Middle East Data Center Blade Server Market Estimates and Forecasts, By Channel (2020-2032) (USD Billion)

11.5.1.7 UAE

11.5.1.7.1 UAE Data Center Blade Server Market Estimates and Forecasts, By Form Factor (2020-2032) (USD Billion)

11.5.1.7.2 UAE Data Center Blade Server Market Estimates and Forecasts, By Application (2020-2032) (USD Billion)

11.5.1.7.3 UAE Data Center Blade Server Market Estimates and Forecasts, By End-use (2020-2032) (USD Billion)

11.5.1.7.4 UAE Data Center Blade Server Market Estimates and Forecasts, By Channel  (2020-2032) (USD Billion)

11.5.1.8 Egypt

11.5.1.8.1 Egypt Data Center Blade Server Market Estimates and Forecasts, By Form Factor (2020-2032) (USD Billion)

11.5.1.8.2 Egypt Data Center Blade Server Market Estimates and Forecasts, By Application (2020-2032) (USD Billion)

11.5.1.8.3 Egypt Data Center Blade Server Market Estimates and Forecasts, By End-use (2020-2032) (USD Billion)

11.5.1.8.4 Egypt Data Center Blade Server Market Estimates and Forecasts, By Channel (2020-2032) (USD Billion)

11.5.1.9 Saudi Arabia

11.5.1.9.1 Saudi Arabia Data Center Blade Server Market Estimates and Forecasts, By Form Factor (2020-2032) (USD Billion)

11.5.1.9.2 Saudi Arabia Data Center Blade Server Market Estimates and Forecasts, By Application (2020-2032) (USD Billion)

11.5.1.9.3 Saudi Arabia Data Center Blade Server Market Estimates and Forecasts, By End-use (2020-2032) (USD Billion)

11.5.1.9.4 Saudi Arabia Data Center Blade Server Market Estimates and Forecasts, By Channel (2020-2032) (USD Billion)

11.5.1.10 Qatar

11.5.1.10.1 Qatar Data Center Blade Server Market Estimates and Forecasts, By Form Factor (2020-2032) (USD Billion)

11.5.1.10.2 Qatar Data Center Blade Server Market Estimates and Forecasts, By Application (2020-2032) (USD Billion)

11.5.1.10.3 Qatar Data Center Blade Server Market Estimates and Forecasts, By End-use (2020-2032) (USD Billion)

11.5.1.10.4 Qatar Data Center Blade Server Market Estimates and Forecasts, By Channel (2020-2032) (USD Billion)

11.5.1.11 Rest of Middle East

11.5.1.11.1 Rest of Middle East Data Center Blade Server Market Estimates and Forecasts, By Form Factor (2020-2032) (USD Billion)

11.5.1.11.2 Rest of Middle East Data Center Blade Server Market Estimates and Forecasts, By Application (2020-2032) (USD Billion)

11.5.1.11.3 Rest of Middle East Data Center Blade Server Market Estimates and Forecasts, By End-use (2020-2032) (USD Billion)

11.5.1.11.4 Rest of Middle East Data Center Blade Server Market Estimates and Forecasts, By Channel (2020-2032) (USD Billion)

11.5.2 Africa

11.5.2.1 Trends Analysis

11.5.2.2 Africa Data Center Blade Server Market Estimates and Forecasts, by Country (2020-2032) (USD Billion)

11.5.2.3 Africa Data Center Blade Server Market Estimates and Forecasts, By Form Factor (2020-2032) (USD Billion) 

11.5.2.4 Africa Data Center Blade Server Market Estimates and Forecasts, By Application (2020-2032) (USD Billion)

11.5.2.5 Africa Data Center Blade Server Market Estimates and Forecasts, By End-use (2020-2032) (USD Billion)

11.5.2.6 Africa Data Center Blade Server Market Estimates and Forecasts, By Channel (2020-2032) (USD Billion)

11.5.2.7 South Africa

11.5.2.7.1 South Africa Data Center Blade Server Market Estimates and Forecasts, By Form Factor (2020-2032) (USD Billion)

11.5.2.7.2 South Africa Data Center Blade Server Market Estimates and Forecasts, By Application (2020-2032) (USD Billion)

11.5.2.7.3 South Africa Data Center Blade Server Market Estimates and Forecasts, By End-use (2020-2032) (USD Billion)

11.5.2.7.4 South Africa Data Center Blade Server Market Estimates and Forecasts, By Channel (2020-2032) (USD Billion)

11.5.2.8 Nigeria

11.5.2.8.1 Nigeria Data Center Blade Server Market Estimates and Forecasts, By Form Factor (2020-2032) (USD Billion)

11.5.2.8.2 Nigeria Data Center Blade Server Market Estimates and Forecasts, By Application (2020-2032) (USD Billion)

11.5.2.8.3 Nigeria Data Center Blade Server Market Estimates and Forecasts, By End-use (2020-2032) (USD Billion)

11.5.2.8.4 Nigeria Data Center Blade Server Market Estimates and Forecasts, By Channel (2020-2032) (USD Billion)

11.5.2.9 Rest of Africa

11.5.2.9.1 Rest of Africa Data Center Blade Server Market Estimates and Forecasts, By Form Factor (2020-2032) (USD Billion)

11.5.2.9.2 Rest of Africa Data Center Blade Server Market Estimates and Forecasts, By Application (2020-2032) (USD Billion)

11.5.2.9.3 Rest of Africa Data Center Blade Server Market Estimates and Forecasts, By End-use (2020-2032) (USD Billion)

11.5.2.9.4 Rest of Africa Data Center Blade Server Market Estimates and Forecasts, By Channel (2020-2032) (USD Billion)

11.6 Latin America

11.6.1 Trends Analysis

11.6.2 Latin America Data Center Blade Server Market Estimates and Forecasts, by Country (2020-2032) (USD Billion)

11.6.3 Latin America Data Center Blade Server Market Estimates and Forecasts, By Form Factor (2020-2032) (USD Billion) 

11.6.4 Latin America Data Center Blade Server Market Estimates and Forecasts, By Application (2020-2032) (USD Billion)

11.6.5 Latin America Data Center Blade Server Market Estimates and Forecasts, By End-use (2020-2032) (USD Billion)

11.6.6 Latin America Data Center Blade Server Market Estimates and Forecasts, By Channel (2020-2032) (USD Billion)

11.6.7 Brazil

11.6.7.1 Brazil Data Center Blade Server Market Estimates and Forecasts, By Form Factor (2020-2032) (USD Billion)

11.6.7.2 Brazil Data Center Blade Server Market Estimates and Forecasts, By Application (2020-2032) (USD Billion)

11.6.7.3 Brazil Data Center Blade Server Market Estimates and Forecasts, By End-use (2020-2032) (USD Billion)

11.6.7.4 Brazil Data Center Blade Server Market Estimates and Forecasts, By Channel (2020-2032) (USD Billion)

11.6.8 Argentina

11.6.8.1 Argentina Data Center Blade Server Market Estimates and Forecasts, By Form Factor (2020-2032) (USD Billion)

11.6.8.2 Argentina Data Center Blade Server Market Estimates and Forecasts, By Application (2020-2032) (USD Billion)

11.6.8.3 Argentina Data Center Blade Server Market Estimates and Forecasts, By End-use (2020-2032) (USD Billion)

11.6.8.4 Argentina Data Center Blade Server Market Estimates and Forecasts, By Channel (2020-2032) (USD Billion)

11.6.9 Colombia

11.6.9.1 Colombia Data Center Blade Server Market Estimates and Forecasts, By Form Factor (2020-2032) (USD Billion)

11.6.9.2 Colombia Data Center Blade Server Market Estimates and Forecasts, By Application (2020-2032) (USD Billion)

11.6.9.3 Colombia Data Center Blade Server Market Estimates and Forecasts, By End-use (2020-2032) (USD Billion)

11.6.9.4 Colombia Data Center Blade Server Market Estimates and Forecasts, By Channel (2020-2032) (USD Billion)

11.6.10 Rest of Latin America

11.6.10.1 Rest of Latin America Data Center Blade Server Market Estimates and Forecasts, By Form Factor (2020-2032) (USD Billion)

11.6.10.2 Rest of Latin America Data Center Blade Server Market Estimates and Forecasts, By Application (2020-2032) (USD Billion)

11.6.10.3 Rest of Latin America Data Center Blade Server Market Estimates and Forecasts, By End-use (2020-2032) (USD Billion)

11.6.10.4 Rest of Latin America Data Center Blade Server Market Estimates and Forecasts, By Channel (2020-2032) (USD Billion)

12. Company Profiles

12.1 Cisco Systems, Inc.

12.1.1 Company Overview

12.1.2 Financial

12.1.3 Products/ Services Offered

12.1.4 SWOT Analysis

12.2 Dell Inc.

12.2.1 Company Overview

12.2.2 Financial

12.2.3 Products/ Services Offered

12.2.4 SWOT Analysis

12.3 FUJITSU

12.3.1 Company Overview

12.3.2 Financial

12.3.3 Products/ Services Offered

12.3.4 SWOT Analysis

12.4 Hewlett Packard Enterprise Development LP

12.4.1 Company Overview

12.4.2 Financial

12.4.3 Products/ Services Offered

12.4.4 SWOT Analysis

12.5 Huawei

12.5.1 Company Overview

12.5.2 Financial

12.5.3 Products/ Services Offered

12.5.4 SWOT Analysis

12.6 IBM

12.6.1 Company Overview

12.6.2 Financial

12.6.3 Products/ Services Offered

12.6.4 SWOT Analysis

12.7 INSPUR Co., Ltd.

12.7.1 Company Overview

12.7.2 Financial

12.7.3 Products/ Services Offered

12.7.4 SWOT Analysis

12.8 Lenovo

12.8.1 Company Overview

12.8.2 Financial

12.8.3 Products/ Services Offered

12.8.4 SWOT Analysis

12.9 Oracle

12.9.1 Company Overview

12.9.2 Financial

12.9.3 Products/ Services Offered

12.9.4 SWOT Analysis

12.10 Super Micro Computer, Inc.

12.10.1 Company Overview

12.10.2 Financial

12.10.3 Products/ Services Offered

12.10.4 SWOT Analysis

13. Use Cases and Best Practices

14. Conclusion

An accurate research report requires proper strategizing as well as implementation. There are multiple factors involved in the completion of good and accurate research report and selecting the best methodology to compete the research is the toughest part. Since the research reports we provide play a crucial role in any company’s decision-making process, therefore we at SNS Insider always believe that we should choose the best method which gives us results closer to reality. This allows us to reach at a stage wherein we can provide our clients best and accurate investment to output ratio.

Each report that we prepare takes a timeframe of 350-400 business hours for production. Starting from the selection of titles through a couple of in-depth brain storming session to the final QC process before uploading our titles on our website we dedicate around 350 working hours. The titles are selected based on their current market cap and the foreseen CAGR and growth.


The 5 steps process:

Step 1: Secondary Research:

Secondary Research or Desk Research is as the name suggests is a research process wherein, we collect data through the readily available information. In this process we use various paid and unpaid databases which our team has access to and gather data through the same. This includes examining of listed companies’ annual reports, Journals, SEC filling etc. Apart from this our team has access to various associations across the globe across different industries. Lastly, we have exchange relationships with various university as well as individual libraries.

Secondary Research

Step 2: Primary Research

When we talk about primary research, it is a type of study in which the researchers collect relevant data samples directly, rather than relying on previously collected data.  This type of research is focused on gaining content specific facts that can be sued to solve specific problems. Since the collected data is fresh and first hand therefore it makes the study more accurate and genuine.

We at SNS Insider have divided Primary Research into 2 parts.

Part 1 wherein we interview the KOLs of major players as well as the upcoming ones across various geographic regions. This allows us to have their view over the market scenario and acts as an important tool to come closer to the accurate market numbers. As many as 45 paid and unpaid primary interviews are taken from both the demand and supply side of the industry to make sure we land at an accurate judgement and analysis of the market.

This step involves the triangulation of data wherein our team analyses the interview transcripts, online survey responses and observation of on filed participants. The below mentioned chart should give a better understanding of the part 1 of the primary interview.

Primary Research

Part 2: In this part of primary research the data collected via secondary research and the part 1 of the primary research is validated with the interviews from individual consultants and subject matter experts.

Consultants are those set of people who have at least 12 years of experience and expertise within the industry whereas Subject Matter Experts are those with at least 15 years of experience behind their back within the same space. The data with the help of two main processes i.e., FGDs (Focused Group Discussions) and IDs (Individual Discussions). This gives us a 3rd party nonbiased primary view of the market scenario making it a more dependable one while collation of the data pointers.

Step 3: Data Bank Validation

Once all the information is collected via primary and secondary sources, we run that information for data validation. At our intelligence centre our research heads track a lot of information related to the market which includes the quarterly reports, the daily stock prices, and other relevant information. Our data bank server gets updated every fortnight and that is how the information which we collected using our primary and secondary information is revalidated in real time.

Data Bank Validation

Step 4: QA/QC Process

After all the data collection and validation our team does a final level of quality check and quality assurance to get rid of any unwanted or undesired mistakes. This might include but not limited to getting rid of the any typos, duplication of numbers or missing of any important information. The people involved in this process include technical content writers, research heads and graphics people. Once this process is completed the title gets uploader on our platform for our clients to read it.

Step 5: Final QC/QA Process:

This is the last process and comes when the client has ordered the study. In this process a final QA/QC is done before the study is emailed to the client. Since we believe in giving our clients a good experience of our research studies, therefore, to make sure that we do not lack at our end in any way humanly possible we do a final round of quality check and then dispatch the study to the client.

Key Segments:

By Form Factor

  • Half-height Blade Server

  • Full-height Blade Server

  • Quarter-height Blade Server

By Channel

  • Direct

  • Reseller

  • Systems Integrator

  • Others

By Application

  • Virtualization and Cloud Computing

  • High-performance Computing (HPC)

  • Storage and Backup

  • Web Hosting

  • Database Management

  • AI and Machine Learning Workloads

By End-use

  • BFSI

  • Healthcare

  • Energy

  • IT & Telecom

  • Government & Defense

  • Others

Request for Segment Customization as per your Business Requirement: Segment Customization Request

Regional Coverage:

North America

  • US

  • Canada

  • Mexico

Europe

  • Eastern Europe

    • Poland

    • Romania

    • Hungary

    • Turkey

    • Rest of Eastern Europe

  • Western Europe

    • Germany

    • France

    • UK

    • Italy

    • Spain

    • Netherlands

    • Switzerland

    • Austria

    • Rest of Western Europe

Asia Pacific

  • China

  • India

  • Japan

  • South Korea

  • Vietnam

  • Singapore

  • Australia

  • Rest of Asia Pacific

Middle East & Africa

  • Middle East

    • UAE

    • Egypt

    • Saudi Arabia

    • Qatar

    • Rest of Middle East

  • Africa

    • Nigeria

    • South Africa

    • Rest of Africa

Latin America

  • Brazil

  • Argentina

  • Colombia

  • Rest of Latin America

Request for Country Level Research Report: Country Level Customization Request

Available Customization

With the given market data, SNS Insider offers customization as per the company’s specific needs. The following customization options are available for the report:

  • Detailed Volume Analysis

  • Criss-Cross segment analysis (e.g. Product X Application)

  • Competitive Product Benchmarking

  • Geographic Analysis

  • Additional countries in any of the regions

  • Customized Data Representation

  • Detailed analysis and profiling of additional market players


  •            5000 (33% Discount)


  •            8950 (40% Discount)


  •            3050 (23% Discount)

Start a Conversation

Hi! Click one of our member below to chat on Phone