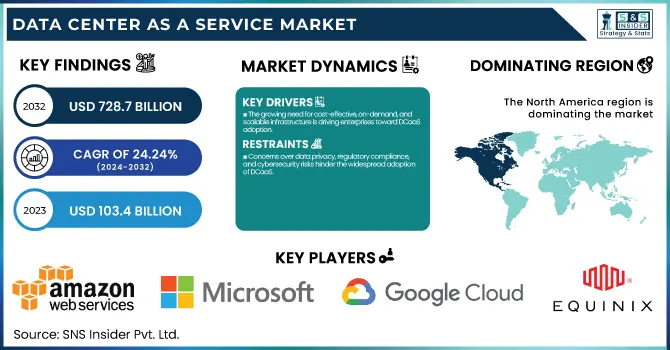
The Data Center As A Service Market was valued at USD 103.4 Billion in 2023 and is expected to reach USD 728.7 Billion by 2032, growing at a CAGR of 24.24% from 2024-2032.
To Get more information on Data Center As A Service Market - Request Free Sample Report
This report consists of insights into the Data Center as a Service Market, covering key trends and developments. The adoption rates of DCaaS solutions by industry highlight the increasing demand across sectors like BFSI, healthcare, and IT, driven by scalability and cost efficiency. Data center capacity expansion by region showcases significant investments in North America and Asia-Pacific to meet growing cloud and enterprise demands. DCaaS cost savings and efficiency improvements emphasize reduced capital expenditure and optimized resource utilization. Lastly, enterprise workload migration to DCaaS reflects the shift from traditional on-premise infrastructure to cloud-based solutions, enhancing agility and business continuity.
Driver
The growing need for cost-effective, on-demand, and scalable infrastructure is driving enterprises toward DCaaS adoption.
Gain insights on the high demand for on-demand and scalable data center infrastructure which has been one of the important drivers of the Data Center as a Service Market. Organizations are migrating away from traditional on-premise data centers to cloud-based DCaaS solutions, enabling greater operational flexibility, reduced Capital Expenditure, and better disaster recovery capabilities. DCaaS is seeing rapid adoption due to factors such as the digital transformation surge, the adoption of applications based on AI, and the continued growth of cloud workloads. Further, small and medium enterprises are also adopting DCaaS as the model provides enterprise-grade IT infrastructure without large capital investment, thus promoting market expansion. Thanks to its essence of rapid scaling resources based on business requirements, DCaaS is the future for modern enterprises.
Restraint
Concerns over data privacy, regulatory compliance, and cybersecurity risks hinder the widespread adoption of DCaaS.
Although it provides benefits, security, and compliance continue to be the primary reason DCaaS is in such an early stage of adoption. Corporates dealing with sensitive data like BFSI, healthcare, and government are concerned about data breaches unauthorized access, and compliances. Security frameworks to ensure data sovereignty as well as meeting industry standards for compliance such as the General Data Protection Regulation and Health Insurance Portability and Accountability Act have all become paramount, along with the threats posed by hacking and cybercrime. The dependence on third-party data center providers is also a concern in the way of data privacy and control. Those considerations hinder organizations from completely switching to DCaaS so hybrid models have emerged, keeping important workloads on-premise while using the cloud mainland.
Opportunity
The rise of edge computing and AI-powered optimization is creating new growth opportunities for DCaaS providers.
The DCaaS market has a massive opportunity in the expansion of edge data centers and the integrations of AI-driven infrastructure. As industries such as IoT, 5G, and AVs drive the need for low-latency computing, edge DCaaS solutions also facilitate the faster processing of data closer to end-users. Companies have improved overall efficiency with AI-driven infrastructure which increases resource optimization, predictive maintenance, and automated scaling. Furthermore, hyperscale cloud providers and colocation service providers are also targeting edge computing to support high-performance workloads. The combination of industry-specific Artificial Intelligence with DCaaS solutions is likely to innovation and faster adoption for the market in different domains.
Challenge
Migrating legacy systems to DCaaS presents challenges in compatibility, downtime risks, and integration with existing IT infrastructure.
Moving to a DCaaS model has its challenges in terms of the complexity of migration and integration with current IT systems. Those enterprises with aging infrastructure often find it impossible to migrate workloads into cloud-based data centers smoothly without disrupting operations. They must overcome the compatibility issues, network latency, and downtime threats that typically accompany migration by designing comprehensive migration tactics. Moreover, hybrid or multi-cloud adoption and integration with DCaaS also require considerable know-how in the area of orchestration, protection, and compliance management. Since a significant amount of organizations require customized solutions and support services to facilitate a successful move, DCaaS vendor selection and underlying technical know-how are some of the most critical aspects to ensure the successful adoption of DCaaS.
By Infrastructure
In 2023, the servers segment dominated the market and held the largest revenue share of 58%. However, at the same time, new, transforming solutions based on cutting-edge digital technologies like artificial intelligence, the Internet of things, and machine learning are being adopted at a feverish pace across academic institutions, defense agencies, and government agencies, everyone driving demand for advanced, hyper-converged IT infrastructure including high-performance computing servers to run computer-intensive, software-defined solutions and processing huge amounts of data.
Natural gas storage is expected to register the fastest CAGR during the forecast period. At the same time, worldwide growth in the volumes of computing data is fueling the need to embed storage systems that guarantee rapid data access, which, too, adds to the market for MAMR technology. Thus, many nations are moving to construct virtual data storage to decrease their dependence on foreign institutions and to increase the certainty of data security.
By Enterprise Size
In 2023, the large enterprises segment dominated the market and accounted for 59% of revenue share. Government regulatory favor due to the growing need to establish data centers and huge investments by the giant company to host private data centers are likely to provide a major opportunity for the segment's growth in the data ceneter-as-a-service market.
The SME segment is anticipated to register the fastest CAGR during the forecast period. Segment growth is driven by the increasing adoption of digital tools and cloud-based applications among SMEs. With the increasing adoption of Software-as-a-Service platforms, e-commerce solutions, and customer relationship management systems by businesses, the data processing and storage requirements are on the rise.
By Vertical
In 2023, the retail segment dominated the market and accounted for a significant revenue share. With a variety of data processing and latency requirements, the IT & telecommunications industry is being rapidly transformed according to what the latest technologies, including IoT, 5G, virtual reality, and augmented reality, can do. Telcos, in particular, are meeting their infrastructure requirements by building private cloud data centers for core as well as non-core networking operations on their own.
This is a major factor propelling segment growth due to the innovative digitalization of healthcare operations and the demand for risk & security management solutions to outspread solid IT infrastructure. As the volume of electronic health records, imaging data, and other patient information grows, healthcare providers and organizations from hospitals, clinics, and research institutions are quickly adopting DCaaS solutions.
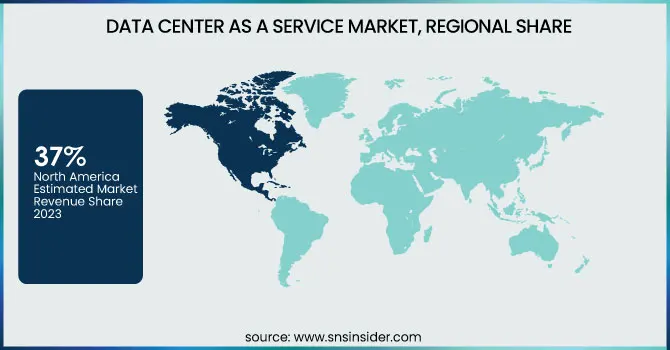
In 2024, North America dominated the market and accounted for 37% of revenue share. The North American DCaaS market is growing due to the increasing demand for edge computing. As the number of Internet of Things devices increases dramatically and real-time data processing becomes essential in many scenarios, edge computing is emerging as an integral IT strategy investment. More and more, the providers of data center-as-a-service are building edge capabilities into their platforms so that businesses can minimize latency by processing data closer to the source.
The Asia Pacific data center as-a-service market is anticipated to register the fastest CAGR over the forecast period. Based on the large amount of data produced by huge telecom networks, a large customer base for electronic commerce, and many solution providers with high flows of traffic through servers, the demand for data center development and infrastructure is increasing in Asia Pacific.
Get Customized Report as per Your Business Requirement - Enquiry Now
The major key players along with their products are
Amazon Web Services (AWS) – AWS Outposts
Microsoft – Azure Stack
Google Cloud – Google Anthos
IBM – IBM Cloud Satellite
Equinix – Equinix Metal
Digital Realty – PlatformDIGITAL
Alibaba Cloud – Alibaba Cloud Elastic Compute Service
Oracle – Oracle Cloud@Customer
Hewlett Packard Enterprise (HPE) – HPE GreenLake
Dell Technologies – Dell APEX Data Storage Services
VMware – VMware Cloud on AWS
Cyxtera – Cyxtera Digital Exchange
Tencent Cloud – Tencent Cloud TStack
Fujitsu – Fujitsu Hybrid IT
NTT Communications – NTT Global Data Centers
January 2024: Flexential launched Flexential Fabric, a next-generation system integrated with FlexAnywhere, designed to provide advanced, software-defined interconnection services.
March 2024: YTL Power announced the formation of YTL AI Cloud, collaborating with NVIDIA to build Malaysia's fastest supercomputers using NVIDIA AI chips, marking a significant investment in AI infrastructure.
May 2024: CoreWeave raised $1.1 billion in funding led by Coatue Management, valuing the company at $19 billion, to expand its cloud-based GPU infrastructure for AI developers.
October 2024: CoreWeave secured a $650 million credit facility from top Wall Street banks, including Goldman Sachs, JPMorgan Chase, and Morgan Stanley, to further its AI cloud-computing expansion.
| Report Attributes | Details |
|---|---|
| Market Size in 2023 | US$ 103.4 Billion |
| Market Size by 2032 | US$ 728.7 Billion |
| CAGR | CAGR of 24.24 % From 2024 to 2032 |
| Base Year | 2023 |
| Forecast Period | 2024-2032 |
| Historical Data | 2020-2022 |
| Report Scope & Coverage | Market Size, Segments Analysis, Competitive Landscape, Regional Analysis, DROC & SWOT Analysis, Forecast Outlook |
| Key Segments | • By Infrastructure (Servers, Storage, Networking) • By Enterprise Size (Large Enterprises, SMEs) • By Verticals (Retail, BFSI, IT & Telecom, Healthcare, Manufacturing, Others) |
| Regional Analysis/Coverage | North America (US, Canada, Mexico), Europe (Eastern Europe [Poland, Romania, Hungary, Turkey, Rest of Eastern Europe] Western Europe] Germany, France, UK, Italy, Spain, Netherlands, Switzerland, Austria, Rest of Western Europe]), Asia Pacific (China, India, Japan, South Korea, Vietnam, Singapore, Australia, Rest of Asia Pacific), Middle East & Africa (Middle East [UAE, Egypt, Saudi Arabia, Qatar, Rest of Middle East], Africa [Nigeria, South Africa, Rest of Africa], Latin America (Brazil, Argentina, Colombia, Rest of Latin America) |
| Company Profiles | Amazon Web Services (AWS), Microsoft, Google Cloud, IBM, Equinix, Digital Realty, Alibaba Cloud, Oracle, Hewlett Packard Enterprise (HPE), Dell Technologies, VMware, Cyxtera, Tencent Cloud, Fujitsu, NTT Communications |
Ans - The Data Center As A Service Market was valued at USD 103.4 Billion in 2023 and is expected to reach USD 728.7 Billion by 2032.
Ans- The CAGR of the Data Center As A Service Market during the forecast period is 24.24% from 2024-2032.
Ans- Asia-Pacific is expected to register the fastest CAGR during the forecast period.
Ans: The growing need for cost-effective, on-demand, and scalable infrastructure is driving enterprises toward DCaaS adoption.
Ans- Migrating legacy systems to DCaaS presents challenges in compatibility, downtime risks, and integration with existing IT infrastructure.
Table of Contents
1. Introduction
1.1 Market Definition
1.2 Scope (Inclusion and Exclusions)
1.3 Research Assumptions
2. Executive Summary
2.1 Market Overview
2.2 Regional Synopsis
2.3 Competitive Summary
3. Research Methodology
3.1 Top-Down Approach
3.2 Bottom-up Approach
3.3. Data Validation
3.4 Primary Interviews
4. Market Dynamics Impact Analysis
4.1 Market Driving Factors Analysis
4.1.1 Drivers
4.1.2 Restraints
4.1.3 Opportunities
4.1.4 Challenges
4.2 PESTLE Analysis
4.3 Porter’s Five Forces Model
5. Statistical Insights and Trends Reporting
5.1 Adoption Rates of DCaaS Solutions, by Industry
5.2 Data Center Capacity Expansion, by Region
5.3 DCaaS Cost Savings & Efficiency Improvements
5.4 Enterprise Workload Migration to DCaaS
6. Competitive Landscape
6.1 List of Major Companies, By Region
6.2 Market Share Analysis, By Region
6.3 Product Benchmarking
6.3.1 Product specifications and features
6.3.2 Pricing
6.4 Strategic Initiatives
6.4.1 Marketing and promotional activities
6.4.2 Distribution and supply chain strategies
6.4.3 Expansion plans and new product launches
6.4.4 Strategic partnerships and collaborations
6.5 Technological Advancements
6.6 Market Positioning and Branding
7. Data Center As A Service Market Segmentation, By Infrastructure
7.1 Chapter Overview
7.2 Servers
7.2.1 Servers Market Trends Analysis (2020-2032)
7.2.2 Servers Market Size Estimates and Forecasts to 2032 (USD Billion)
7.3 Storage
7.3.1 Storage Market Trends Analysis (2020-2032)
7.3.2 Storage Market Size Estimates and Forecasts to 2032 (USD Billion)
7.4 Networking
7.4.1 Networking Market Trends Analysis (2020-2032)
7.4.2 Networking Market Size Estimates and Forecasts to 2032 (USD Billion)
8. Data Center As A Service Market Segmentation, by Enterprise Size
8.1 Chapter Overview
8.2 Large Enterprises
8.2.1 Large Enterprises Market Trends Analysis (2020-2032)
8.2.2 Large Enterprises Market Size Estimates And Forecasts To 2032 (Usd Billion)
8.3 SMEs
8.3.1 SMEs Market Trends Analysis (2020-2032)
8.3.2 SMEs Market Size Estimates and Forecasts to 2032 (USD Billion)
9. Data Center As A Service Market Segmentation, by Verticals
9.1 Chapter Overview
9.2 Retail
9.2.1 Retail Market Trends Analysis (2020-2032)
9.2.2 Retail Market Size Estimates and Forecasts to 2032 (USD Billion)
9.3 BFSI
9.3.1 BFSI Market Trends Analysis (2020-2032)
9.3.2 BFSI Market Size Estimates and Forecasts to 2032 (USD Billion)
9.4 IT & Telecom
9.4.1IT & Telecom Market Trends Analysis (2020-2032)
9.4.2IT & Telecom Market Size Estimates and Forecasts to 2032 (USD Billion)
9.5 Healthcare
9.5.1Healthcare Market Trends Analysis (2020-2032)
9.5.2Healthcare Market Size Estimates and Forecasts to 2032 (USD Billion)
9.6 Manufacturing
9.6.1Manufacturing Market Trends Analysis (2020-2032)
9.6.2Manufacturing Market Size Estimates and Forecasts to 2032 (USD Billion)
9.7 Others
9.7.1Others Market Trends Analysis (2020-2032)
9.4.2Others Market Size Estimates and Forecasts to 2032 (USD Billion)
10. Regional Analysis
10.1 Chapter Overview
10.2 North America
10.2.1 Trends Analysis
10.2.2 North America Data Center As A Service Market Estimates and Forecasts, by Country (2020-2032) (USD Billion)
10.2.3 North America Data Center As A Service Market Estimates and Forecasts, By Infrastructure (2020-2032) (USD Billion)
10.2.4 North America Data Center As A Service Market Estimates and Forecasts, by Enterprise Size (2020-2032) (USD Billion)
10.2.5 North America Data Center As A Service Market Estimates and Forecasts, by Service (2020-2032) (USD Billion)
10.2.6 USA
10.2.6.1 USA Data Center As A Service Market Estimates and Forecasts, By Infrastructure (2020-2032) (USD Billion)
10.2.6.2 USA Data Center As A Service Market Estimates and Forecasts, by Enterprise Size (2020-2032) (USD Billion)
10.2.6.3 USA Data Center As A Service Market Estimates and Forecasts, by Verticals (2020-2032) (USD Billion)
10.2.7 Canada
10.2.7.1 Canada Data Center As A Service Market Estimates and Forecasts, By Infrastructure (2020-2032) (USD Billion)
10.2.7.2 Canada Data Center As A Service Market Estimates and Forecasts, by Enterprise Size (2020-2032) (USD Billion)
10.2.7.3 Canada Data Center As A Service Market Estimates and Forecasts, by Verticals (2020-2032) (USD Billion)
10.2.8 Mexico
10.2.8.1 Mexico Data Center As A Service Market Estimates and Forecasts, By Infrastructure (2020-2032) (USD Billion)
10.2.8.2 Mexico Data Center As A Service Market Estimates and Forecasts, by Enterprise Size (2020-2032) (USD Billion)
10.2.8.3 Mexico Data Center As A Service Market Estimates and Forecasts, by Verticals (2020-2032) (USD Billion)
10.3 Europe
10.3.1 Eastern Europe
10.3.1.1 Trends Analysis
10.3.1.2 Eastern Europe Data Center As A Service Market Estimates and Forecasts, by Country (2020-2032) (USD Billion)
10.3.1.3 Eastern Europe Data Center As A Service Market Estimates and Forecasts, By Infrastructure (2020-2032) (USD Billion)
10.3.1.4 Eastern Europe Data Center As A Service Market Estimates and Forecasts, by Enterprise Size (2020-2032) (USD Billion)
10.3.1.5 Eastern Europe Data Center As A Service Market Estimates and Forecasts, by Verticals (2020-2032) (USD Billion)
10.3.1.6 Poland
10.3.1.6.1 Poland Data Center As A Service Market Estimates and Forecasts, By Infrastructure (2020-2032) (USD Billion)
10.3.1.6.2 Poland Data Center As A Service Market Estimates and Forecasts, by Enterprise Size (2020-2032) (USD Billion)
10.3.1.6.3 Poland Data Center As A Service Market Estimates and Forecasts, by Verticals (2020-2032) (USD Billion)
10.3.1.7 Romania
10.3.1.7.1 Romania Data Center As A Service Market Estimates and Forecasts, By Infrastructure (2020-2032) (USD Billion)
10.3.1.7.2 Romania Data Center As A Service Market Estimates and Forecasts, by Enterprise Size (2020-2032) (USD Billion)
10.3.1.7.3 Romania Data Center As A Service Market Estimates and Forecasts, by Verticals (2020-2032) (USD Billion)
10.3.1.8 Hungary
10.3.1.8.1 Hungary Data Center As A Service Market Estimates and Forecasts, By Infrastructure (2020-2032) (USD Billion)
10.3.1.8.2 Hungary Data Center As A Service Market Estimates and Forecasts, by Enterprise Size (2020-2032) (USD Billion)
10.3.1.8.3 Hungary Data Center As A Service Market Estimates and Forecasts, by Verticals (2020-2032) (USD Billion)
10.3.1.9 Turkey
10.3.1.9.1 Turkey Data Center As A Service Market Estimates and Forecasts, By Infrastructure (2020-2032) (USD Billion)
10.3.1.9.2 Turkey Data Center As A Service Market Estimates and Forecasts, by Enterprise Size (2020-2032) (USD Billion)
10.3.1.9.3 Turkey Data Center As A Service Market Estimates and Forecasts, by Verticals (2020-2032) (USD Billion)
10.3.1.10 Rest of Eastern Europe
10.3.1.10.1 Rest of Eastern Europe Data Center As A Service Market Estimates and Forecasts, By Infrastructure (2020-2032) (USD Billion)
10.3.1.10.2 Rest of Eastern Europe Data Center As A Service Market Estimates and Forecasts, by Enterprise Size (2020-2032) (USD Billion)
10.3.1.10.3 Rest of Eastern Europe Data Center As A Service Market Estimates and Forecasts, by Verticals (2020-2032) (USD Billion)
10.3.2 Western Europe
10.3.2.1 Trends Analysis
10.3.2.2 Western Europe Data Center As A Service Market Estimates and Forecasts, by Country (2020-2032) (USD Billion)
10.3.2.3 Western Europe Data Center As A Service Market Estimates and Forecasts, By Infrastructure (2020-2032) (USD Billion)
10.3.2.4 Western Europe Data Center As A Service Market Estimates and Forecasts, by Enterprise Size (2020-2032) (USD Billion)
10.3.2.5 Western Europe Data Center As A Service Market Estimates and Forecasts, by Verticals (2020-2032) (USD Billion)
10.3.2.6 Germany
10.3.2.6.1 Germany Data Center As A Service Market Estimates and Forecasts, By Infrastructure (2020-2032) (USD Billion)
10.3.2.6.2 Germany Data Center As A Service Market Estimates and Forecasts, by Enterprise Size (2020-2032) (USD Billion)
10.3.2.6.3 Germany Data Center As A Service Market Estimates and Forecasts, by Verticals (2020-2032) (USD Billion)
10.3.2.7 France
10.3.2.7.1 France Data Center As A Service Market Estimates and Forecasts, By Infrastructure (2020-2032) (USD Billion)
10.3.2.7.2 France Data Center As A Service Market Estimates and Forecasts, by Enterprise Size (2020-2032) (USD Billion)
10.3.2.7.3 France Data Center As A Service Market Estimates and Forecasts, by Verticals (2020-2032) (USD Billion)
10.3.2.8 UK
10.3.2.8.1 UK Data Center As A Service Market Estimates and Forecasts, By Infrastructure (2020-2032) (USD Billion)
10.3.2.8.2 UK Data Center As A Service Market Estimates and Forecasts, by Enterprise Size (2020-2032) (USD Billion)
10.3.2.8.3 UK Data Center As A Service Market Estimates and Forecasts, by Verticals (2020-2032) (USD Billion)
10.3.2.9 Italy
10.3.2.9.1 Italy Data Center As A Service Market Estimates and Forecasts, By Infrastructure (2020-2032) (USD Billion)
10.3.2.9.2 Italy Data Center As A Service Market Estimates and Forecasts, by Enterprise Size (2020-2032) (USD Billion)
10.3.2.9.3 Italy Data Center As A Service Market Estimates and Forecasts, by Verticals (2020-2032) (USD Billion)
10.3.2.10 Spain
10.3.2.10.1 Spain Data Center As A Service Market Estimates and Forecasts, By Infrastructure (2020-2032) (USD Billion)
10.3.2.10.2 Spain Data Center As A Service Market Estimates and Forecasts, by Enterprise Size (2020-2032) (USD Billion)
10.3.2.10.3 Spain Data Center As A Service Market Estimates and Forecasts, by Verticals (2020-2032) (USD Billion)
10.3.2.11 Netherlands
10.3.2.11.1 Netherlands Data Center As A Service Market Estimates and Forecasts, By Infrastructure (2020-2032) (USD Billion)
10.3.2.11.2 Netherlands Data Center As A Service Market Estimates and Forecasts, by Enterprise Size (2020-2032) (USD Billion)
10.3.2.11.3 Netherlands Data Center As A Service Market Estimates and Forecasts, by Verticals (2020-2032) (USD Billion)
10.3.2.12 Switzerland
10.3.2.12.1 Switzerland Data Center As A Service Market Estimates and Forecasts, By Infrastructure (2020-2032) (USD Billion)
10.3.2.12.2 Switzerland Data Center As A Service Market Estimates and Forecasts, by Enterprise Size (2020-2032) (USD Billion)
10.3.2.12.3 Switzerland Data Center As A Service Market Estimates and Forecasts, by Verticals (2020-2032) (USD Billion)
10.3.2.13 Austria
10.3.2.13.1 Austria Data Center As A Service Market Estimates and Forecasts, By Infrastructure (2020-2032) (USD Billion)
10.3.2.13.2 Austria Data Center As A Service Market Estimates and Forecasts, by Enterprise Size (2020-2032) (USD Billion)
10.3.2.13.3 Austria Data Center As A Service Market Estimates and Forecasts, by Verticals (2020-2032) (USD Billion)
10.3.2.14 Rest of Western Europe
10.3.2.14.1 Rest of Western Europe Data Center As A Service Market Estimates and Forecasts, By Infrastructure (2020-2032) (USD Billion)
10.3.2.14.2 Rest of Western Europe Data Center As A Service Market Estimates and Forecasts, by Enterprise Size (2020-2032) (USD Billion)
10.3.2.14.3 Rest of Western Europe Data Center As A Service Market Estimates and Forecasts, by Verticals (2020-2032) (USD Billion)
10.4 Asia Pacific
10.4.1 Trends Analysis
10.4.2 Asia Pacific Data Center As A Service Market Estimates and Forecasts, by Country (2020-2032) (USD Billion)
10.4.3 Asia Pacific Data Center As A Service Market Estimates and Forecasts, By Infrastructure (2020-2032) (USD Billion)
10.4.4 Asia Pacific Data Center As A Service Market Estimates and Forecasts, by Enterprise Size (2020-2032) (USD Billion)
10.4.5 Asia Pacific Data Center As A Service Market Estimates and Forecasts, by Verticals (2020-2032) (USD Billion)
10.4.6 China
10.4.6.1 China Data Center As A Service Market Estimates and Forecasts, By Infrastructure (2020-2032) (USD Billion)
10.4.6.2 China Data Center As A Service Market Estimates and Forecasts, by Display (2020-2032) (USD Billion)
10.4.6.3 China Data Center As A Service Market Estimates and Forecasts, by Verticals (2020-2032) (USD Billion)
10.4.7 India
10.4.7.1 India Data Center As A Service Market Estimates and Forecasts, By Infrastructure (2020-2032) (USD Billion)
10.4.7.2 India Data Center As A Service Market Estimates and Forecasts, by Enterprise Size (2020-2032) (USD Billion)
10.4.7.3 India Data Center As A Service Market Estimates and Forecasts, by Verticals (2020-2032) (USD Billion)
10.4.8 Japan
10.4.8.1 Japan Data Center As A Service Market Estimates and Forecasts, By Infrastructure (2020-2032) (USD Billion)
10.4.8.2 Japan Data Center As A Service Market Estimates and Forecasts, by Enterprise Size (2020-2032) (USD Billion)
10.4.8.3 Japan Data Center As A Service Market Estimates and Forecasts, by Verticals (2020-2032) (USD Billion)
10.4.9 South Korea
10.4.9.1 South Korea Data Center As A Service Market Estimates and Forecasts, By Infrastructure (2020-2032) (USD Billion)
10.4.9.2 South Korea Data Center As A Service Market Estimates and Forecasts, by Enterprise Size (2020-2032) (USD Billion)
10.4.9.3 South Korea Data Center As A Service Market Estimates and Forecasts, by Verticals (2020-2032) (USD Billion)
10.4.10 Vietnam
10.4.10.1 Vietnam Data Center As A Service Market Estimates and Forecasts, By Infrastructure (2020-2032) (USD Billion)
10.4.10.2 Vietnam Data Center As A Service Market Estimates and Forecasts, by Enterprise Size (2020-2032) (USD Billion)
10.4.10.3 Vietnam Data Center As A Service Market Estimates and Forecasts, by Verticals (2020-2032) (USD Billion)
10.4.11 Singapore
10.4.11.1 Singapore Data Center As A Service Market Estimates and Forecasts, By Infrastructure (2020-2032) (USD Billion)
10.4.11.2 Singapore Data Center As A Service Market Estimates and Forecasts, by Enterprise Size (2020-2032) (USD Billion)
10.4.11.3 Singapore Data Center As A Service Market Estimates and Forecasts, by Verticals (2020-2032) (USD Billion)
10.4.12 Australia
10.4.12.1 Australia Data Center As A Service Market Estimates and Forecasts, By Infrastructure (2020-2032) (USD Billion)
10.4.12.2 Australia Data Center As A Service Market Estimates and Forecasts, by Enterprise Size (2020-2032) (USD Billion)
10.4.12.3 Australia Data Center As A Service Market Estimates and Forecasts, by Verticals (2020-2032) (USD Billion)
10.4.13 Rest of Asia Pacific
10.4.13.1 Rest of Asia Pacific Data Center As A Service Market Estimates and Forecasts, By Infrastructure (2020-2032) (USD Billion)
10.4.13.2 Rest of Asia Pacific Data Center As A Service Market Estimates and Forecasts, by Enterprise Size (2020-2032) (USD Billion)
10.4.13.3 Rest of Asia Pacific Data Center As A Service Market Estimates and Forecasts, by Verticals (2020-2032) (USD Billion)
10.5 Middle East and Africa
10.5.1 Middle East
10.5.1.1 Trends Analysis
10.5.1.2 Middle East Data Center As A Service Market Estimates and Forecasts, by Country (2020-2032) (USD Billion)
10.5.1.3 Middle East Data Center As A Service Market Estimates and Forecasts, By Infrastructure (2020-2032) (USD Billion)
10.5.1.4 Middle East Data Center As A Service Market Estimates and Forecasts, by Enterprise Size (2020-2032) (USD Billion)
10.5.1.5 Middle East Data Center As A Service Market Estimates and Forecasts, by Verticals (2020-2032) (USD Billion)
10.5.1.6 UAE
10.5.1.6.1 UAE Data Center As A Service Market Estimates and Forecasts, By Infrastructure (2020-2032) (USD Billion)
10.5.1.6.2 UAE Data Center As A Service Market Estimates and Forecasts, by Enterprise Size (2020-2032) (USD Billion)
10.5.1.6.3 UAE Data Center As A Service Market Estimates and Forecasts, by Verticals (2020-2032) (USD Billion)
10.5.1.7 Egypt
10.5.1.7.1 Egypt Data Center As A Service Market Estimates and Forecasts, By Infrastructure (2020-2032) (USD Billion)
10.5.1.7.2 Egypt Data Center As A Service Market Estimates and Forecasts, by Enterprise Size (2020-2032) (USD Billion)
10.5.1.7.3 Egypt Data Center As A Service Market Estimates and Forecasts, by Verticals (2020-2032) (USD Billion)
10.5.1.8 Saudi Arabia
10.5.1.8.1 Saudi Arabia Data Center As A Service Market Estimates and Forecasts, By Infrastructure (2020-2032) (USD Billion)
10.5.1.8.2 Saudi Arabia Data Center As A Service Market Estimates and Forecasts, by Enterprise Size (2020-2032) (USD Billion)
10.5.1.8.3 Saudi Arabia Data Center As A Service Market Estimates and Forecasts, by Verticals (2020-2032) (USD Billion)
10.5.1.9 Qatar
10.5.1.9.1 Qatar Data Center As A Service Market Estimates and Forecasts, By Infrastructure (2020-2032) (USD Billion)
10.5.1.9.2 Qatar Data Center As A Service Market Estimates and Forecasts, by Enterprise Size (2020-2032) (USD Billion)
10.5.1.9.3 Qatar Data Center As A Service Market Estimates and Forecasts, by Verticals (2020-2032) (USD Billion)
10.5.1.10 Rest of Middle East
10.5.1.10.1 Rest of Middle East Data Center As A Service Market Estimates and Forecasts, By Infrastructure (2020-2032) (USD Billion)
10.5.1.10.2 Rest of Middle East Data Center As A Service Market Estimates and Forecasts, by Enterprise Size (2020-2032) (USD Billion)
10.5.1.10.3 Rest of Middle East Data Center As A Service Market Estimates and Forecasts, by Verticals (2020-2032) (USD Billion)
10.5.2 Africa
10.5.2.1 Trends Analysis
10.5.2.2 Africa Data Center As A Service Market Estimates and Forecasts, by Country (2020-2032) (USD Billion)
10.5.2.3 Africa Data Center As A Service Market Estimates and Forecasts, By Infrastructure (2020-2032) (USD Billion)
10.5.2.4 Africa Data Center As A Service Market Estimates and Forecasts, by Enterprise Size (2020-2032) (USD Billion)
10.5.2.5 Africa Data Center As A Service Market Estimates and Forecasts, by Verticals (2020-2032) (USD Billion)
10.5.2.6 South Africa
10.5.2.6.1 South Africa Data Center As A Service Market Estimates and Forecasts, By Infrastructure (2020-2032) (USD Billion)
10.5.2.6.2 South Africa Data Center As A Service Market Estimates and Forecasts, by Enterprise Size (2020-2032) (USD Billion)
10.5.2.6.3 South Africa Data Center As A Service Market Estimates and Forecasts, by Verticals (2020-2032) (USD Billion)
10.5.2.7 Nigeria
10.5.2.7.1 Nigeria Data Center As A Service Market Estimates and Forecasts, By Infrastructure (2020-2032) (USD Billion)
10.5.2.7.2 Nigeria Data Center As A Service Market Estimates and Forecasts, by Enterprise Size (2020-2032) (USD Billion)
10.5.2.7.3 Nigeria Data Center As A Service Market Estimates and Forecasts, by Verticals (2020-2032) (USD Billion)
10.5.2.8 Rest of Africa
10.5.2.8.1 Rest of Africa Data Center As A Service Market Estimates and Forecasts, By Infrastructure (2020-2032) (USD Billion)
10.5.2.8.2 Rest of Africa Data Center As A Service Market Estimates and Forecasts, by Enterprise Size (2020-2032) (USD Billion)
10.5.2.8.3 Rest of Africa Data Center As A Service Market Estimates and Forecasts, by Verticals (2020-2032) (USD Billion)
10.6 Latin America
10.6.1 Trends Analysis
10.6.2 Latin America Data Center As A Service Market Estimates and Forecasts, by Country (2020-2032) (USD Billion)
10.6.3 Latin America Data Center As A Service Market Estimates and Forecasts, By Infrastructure (2020-2032) (USD Billion)
10.6.4 Latin America Data Center As A Service Market Estimates and Forecasts, by Enterprise Size (2020-2032) (USD Billion)
10.6.5 Latin America Data Center As A Service Market Estimates and Forecasts, by Verticals (2020-2032) (USD Billion)
10.6.6 Brazil
10.6.6.1 Brazil Data Center As A Service Market Estimates and Forecasts, By Infrastructure (2020-2032) (USD Billion)
10.6.6.2 Brazil Data Center As A Service Market Estimates and Forecasts, by Enterprise Size (2020-2032) (USD Billion)
10.6.6.3 Brazil Data Center As A Service Market Estimates and Forecasts, by Verticals (2020-2032) (USD Billion)
10.6.7 Argentina
10.6.7.1 Argentina Data Center As A Service Market Estimates and Forecasts, By Infrastructure (2020-2032) (USD Billion)
10.6.7.2 Argentina Data Center As A Service Market Estimates and Forecasts, by Enterprise Size (2020-2032) (USD Billion)
10.6.7.3 Argentina Data Center As A Service Market Estimates and Forecasts, by Verticals (2020-2032) (USD Billion)
10.6.8 Colombia
10.6.8.1 Colombia Data Center As A Service Market Estimates and Forecasts, By Infrastructure (2020-2032) (USD Billion)
10.6.8.2 Colombia Data Center As A Service Market Estimates and Forecasts, by Enterprise Size (2020-2032) (USD Billion)
10.6.8.3 Colombia Data Center As A Service Market Estimates and Forecasts, by Verticals (2020-2032) (USD Billion)
10.6.9 Rest of Latin America
10.6.9.1 Rest of Latin America Data Center As A Service Market Estimates and Forecasts, By Infrastructure (2020-2032) (USD Billion)
10.6.9.2 Rest of Latin America Data Center As A Service Market Estimates and Forecasts, by Enterprise Size (2020-2032) (USD Billion)
10.6.9.3 Rest of Latin America Data Center As A Service Market Estimates and Forecasts, by Verticals (2020-2032) (USD Billion)
11. Company Profiles
11.1 Amazon Web Services (AWS)
11.1.1 Company Overview
11.1.2 Financial
11.1.3 Products/ Services Offered
11.1.4 SWOT Analysis
11.2 Microsoft
11.2.1 Company Overview
11.2.2 Financial
11.2.3 Products/ Services Offered
11.2.4 SWOT Analysis
11.3 Google Cloud
11.3.1 Company Overview
11.3.2 Financial
11.3.3 Products/ Services Offered
11.3.4 SWOT Analysis
11.4 IBM .
11.4.1 Company Overview
11.4.2 Financial
11.4.3 Products/ Services Offered
11.4.4 SWOT Analysis
11.5 Equinix
11.5.1 Company Overview
11.5.2 Financial
11.5.3 Products/ Services Offered
11.5.4 SWOT Analysis
11.6 Digital Realty
11.6.1 Company Overview
11.6.2 Financial
11.6.3 Products/ Services Offered
11.6.4 SWOT Analysis
11.7 Alibaba Cloud
11.7.1 Company Overview
11.7.2 Financial
11.7.3 Products/ Services Offered
11.7.4 SWOT Analysis
11.8 Kemp Technologies (Progress)
11.8.1 Company Overview
11.8.2 Financial
11.8.3 Products/ Services Offered
11.8.4 SWOT Analysis
11.9 Oracle
11.9.1 Company Overview
11.9.2 Financial
11.9.3 Products/ Services Offered
11.9.4 SWOT Analysis
11.10 Hewlett Packard Enterprise (HPE)
11.10.1 Company Overview
11.10.2 Financial
11.10.3 Products/ Services Offered
11.10.4 SWOT Analysis
12. Use Cases and Best Practices
13. Conclusion
An accurate research report requires proper strategizing as well as implementation. There are multiple factors involved in the completion of good and accurate research report and selecting the best methodology to compete the research is the toughest part. Since the research reports we provide play a crucial role in any company’s decision-making process, therefore we at SNS Insider always believe that we should choose the best method which gives us results closer to reality. This allows us to reach at a stage wherein we can provide our clients best and accurate investment to output ratio.
Each report that we prepare takes a timeframe of 350-400 business hours for production. Starting from the selection of titles through a couple of in-depth brain storming session to the final QC process before uploading our titles on our website we dedicate around 350 working hours. The titles are selected based on their current market cap and the foreseen CAGR and growth.
The 5 steps process:
Step 1: Secondary Research:
Secondary Research or Desk Research is as the name suggests is a research process wherein, we collect data through the readily available information. In this process we use various paid and unpaid databases which our team has access to and gather data through the same. This includes examining of listed companies’ annual reports, Journals, SEC filling etc. Apart from this our team has access to various associations across the globe across different industries. Lastly, we have exchange relationships with various university as well as individual libraries.

Step 2: Primary Research
When we talk about primary research, it is a type of study in which the researchers collect relevant data samples directly, rather than relying on previously collected data. This type of research is focused on gaining content specific facts that can be sued to solve specific problems. Since the collected data is fresh and first hand therefore it makes the study more accurate and genuine.
We at SNS Insider have divided Primary Research into 2 parts.
Part 1 wherein we interview the KOLs of major players as well as the upcoming ones across various geographic regions. This allows us to have their view over the market scenario and acts as an important tool to come closer to the accurate market numbers. As many as 45 paid and unpaid primary interviews are taken from both the demand and supply side of the industry to make sure we land at an accurate judgement and analysis of the market.
This step involves the triangulation of data wherein our team analyses the interview transcripts, online survey responses and observation of on filed participants. The below mentioned chart should give a better understanding of the part 1 of the primary interview.

Part 2: In this part of primary research the data collected via secondary research and the part 1 of the primary research is validated with the interviews from individual consultants and subject matter experts.
Consultants are those set of people who have at least 12 years of experience and expertise within the industry whereas Subject Matter Experts are those with at least 15 years of experience behind their back within the same space. The data with the help of two main processes i.e., FGDs (Focused Group Discussions) and IDs (Individual Discussions). This gives us a 3rd party nonbiased primary view of the market scenario making it a more dependable one while collation of the data pointers.
Step 3: Data Bank Validation
Once all the information is collected via primary and secondary sources, we run that information for data validation. At our intelligence centre our research heads track a lot of information related to the market which includes the quarterly reports, the daily stock prices, and other relevant information. Our data bank server gets updated every fortnight and that is how the information which we collected using our primary and secondary information is revalidated in real time.

Step 4: QA/QC Process
After all the data collection and validation our team does a final level of quality check and quality assurance to get rid of any unwanted or undesired mistakes. This might include but not limited to getting rid of the any typos, duplication of numbers or missing of any important information. The people involved in this process include technical content writers, research heads and graphics people. Once this process is completed the title gets uploader on our platform for our clients to read it.
Step 5: Final QC/QA Process:
This is the last process and comes when the client has ordered the study. In this process a final QA/QC is done before the study is emailed to the client. Since we believe in giving our clients a good experience of our research studies, therefore, to make sure that we do not lack at our end in any way humanly possible we do a final round of quality check and then dispatch the study to the client.
Key Segments:
By Infrastructure
Servers
Storage
Networking
By Enterprise Size
Large Enterprises
SMEs
By Verticals
Retail
BFSI
IT & Telecom
Healthcare
Manufacturing
Others
Request for Segment Customization as per your Business Requirement: Segment Customization Request
Regional Coverage:
North America
US
Canada
Mexico
Europe
Eastern Europe
Poland
Romania
Hungary
Turkey
Rest of Eastern Europe
Western Europe
Germany
France
UK
Italy
Spain
Netherlands
Switzerland
Austria
Rest of Western Europe
Asia Pacific
China
India
Japan
South Korea
Vietnam
Singapore
Australia
Rest of Asia Pacific
Middle East & Africa
Middle East
UAE
Egypt
Saudi Arabia
Qatar
Rest of Middle East
Africa
Nigeria
South Africa
Rest of Africa
Latin America
Brazil
Argentina
Colombia
Rest of Latin America
Request for Country Level Research Report: Country Level Customization Request
Available Customization
With the given market data, SNS Insider offers customization as per the company’s specific needs. The following customization options are available for the report:
Detailed Volume Analysis
Criss-Cross segment analysis (e.g. Product X Application)
Competitive Product Benchmarking
Geographic Analysis
Additional countries in any of the regions
Customized Data Representation
Detailed analysis and profiling of additional market players
The Digital Forensics Market was valued at USD 9.84 Billion in 2023 and will reach USD 30.74 Billion by 2032, growing at a CAGR of 13.51% by 2032.
Hyper-Automation Market was valued at USD 44.38 billion in 2023 and is expected to reach USD 179.96 billion by 2032, growing at a CAGR of 16.89% from 2024-2032.
Dispatch Console Market was valued at USD 1.89 billion in 2023 and will reach USD 2.89 billion by 2032, growing at a CAGR of 4.94% from 2024-2032.
Partner Relationship Management Market was valued at USD 1.27 billion in 2023 and is expected to reach USD 4.14 billion by 2032, growing at a CAGR of 13.91% from 2024-2032.
The Connected Device Analytics Market Size was valued at USD 26.94 Billion in 2023 and will reach USD 173.96 Billion by 2032 and grow at a CAGR of 23.0% by 2032.
The Open-Source Intelligence Market Size was valued at US$ 9.32 billion in 2023 & is expected to reach US$ 59.61 billion by 2032 & grow at a CAGR of 22.9 % over the forecast period of 2024-2032.

Hi! Click one of our member below to chat on Phone
© 2025 All Rights Reserved by SNS Insider Pvt Ltd


