Curved Televisions Market Size & Trends:
The Curved Televisions Market size was valued at USD 8.69 billion in 2024 and is expected to reach USD 72.64 billion by 2032, growing at a CAGR of 30.50% over the forecast period 2025-2032. Curved Televisions Market growth is driven by increasing preference of consumers for immersive viewing experiences, advancements in display technologies such as OLED and QLED, rising availability of high-definition content, and rapid adoption of online gaming activities.
As consumers prefer better home entertainment experiences, the Curved Televisions Market size is on the rise. Besides, curved TVs have the upper hand in terms of viewing angles, and their attractive looks are also quite an influence in them being a part of the premium segment. Growing consumer preference for televisions with large screens for cinema-grade viewing has been a boon for the market. Even with the availability of flat-screen TVs, curved TVs continue to fill niche demands by combining stylish looks with 4K resolution, smart TV features, and other innovations that have helped the market growth stay robust.
A study from the National Library of Medicine analysed how TV curvature, viewing distance, and side angles affect user experience. It found that when the screen’s curve matches the viewer’s distance, for example, a 4000R TV viewed from 4 meters, the sense of immersion and spatial presence improves. However, this effect is only optimal from the center.

To Get More Information On Curved Televisions Market - Request Free Sample Report
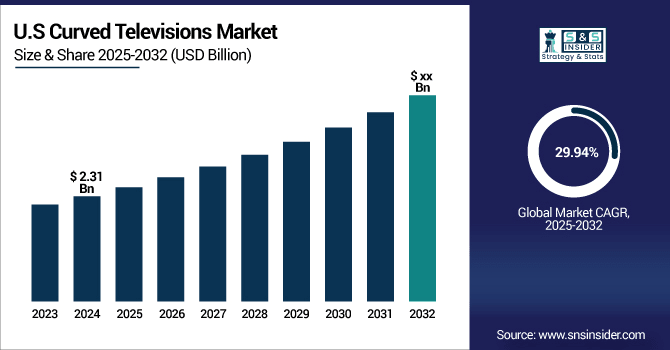
The U.S. Curved Televisions Market size is estimated to be USD 2.31 billion in 2024 and is projected to grow at a CAGR of 29.94%. The curved television market in the U.S. continues to grow as consumers experience higher demand for immersive home entertainment, display technology advances, and show growing interest in premium viewing experiences. Other than the widely sold holographic smart glasses, the deeply improved factors of knowledge include their wide field of view.
Curved Televisions Market Dynamics
Key Drivers:
-
Immersive Curved TVs Gain Popularity as Gamers and Home Theaters Seek Cinematic Viewing Experience
The increasing consumer demand for immersive viewing experiences is expected to drive the growth of the Curved television market. This increase in the viewing angles with curved display enhances the viewing experience in general however, it proves beneficial in gaming and home theatre applications.
In a 2023, more than 60% of shoppers in developed nations prefer curved TVs to create premium entertainment setups because of their cinematic visuals and extra naturalistic photos with less glare resulting from surrounding lighting.
Restrain:
-
High Costs and Viewing Limitations Challenge Curved TV Adoption in Price-Sensitive Global Consumer Markets
The Curved TV market is mainly hindered by the high level of production and cost of purchase compared with a flat-screen TV. Curved displays necessitate unique manufacturing processes and parts, which drive the price of retail units higher. Such a cost barrier stymies mass adoption in price-sensitive markets. Consumers also see the curved TV as less functional on the wall and less functional for viewing off-axis, which hurts sales.
Display Supply Chain Consultants (DSCC) believes the cost of manufacturing a curved OLED display is around 15–25% higher than a flat display.
Opportunity:
-
Curved Televisions Enter Commercial Spaces as Hybrid Work Boosts Demand for Immersive Display Solutions
Curved televisions are next in line to break into commercial as well as institutional business spaces like digital signage, corporate lobbies, simulation centers, and schools. Command centers and virtual collaboration rooms, where wraparound visuals help people focus and gain a better understanding of data, are more frequently utilizing curved displays. The increase in hybrid work models is also driving demand for sophisticated AV solutions in conference rooms, creating a lucrative opportunity area for curved display implementations.
Samsung used its Smart LED curved display panels to encourage customer engagement in its flagship retail environments within Harrods, Hyundai Department Store, and others.
Challenges:
-
Consumer Uncertainty and Content Compatibility Challenges Hinder Curved TV Adoption Despite Potential Benefits
The big problem is the discovery by consumers of compatible content. Since much of the content is still being optimized for flat screens and much of the benefit provided by a curved display is often only realized at given screen sizes (normally 55-inches and higher), if there are no tangible value propositions, consumers may prefer going for more traditional options.
Back in 2022, the YouGov data showed that more than 40% of U.S. consumers were unsure about the true benefits of a curved screen, indicating that the market still needs to educate people.
Curved Televisions Market Segments Analysis
By Type
Cable Track Cables was the largest player in the curved televisions market in 2024, with a 69.3% share of the market. Their dominance is due to premium television systems utilizing them, where long- and short-term durability and structured cable management are important, mainly commercial television setups (but at a home level, too). This combination of efficiency in fixed and semi-flexible routing environments has resulted in large-scale manufacturers selecting anthropomorphic robots as their preferred design.
From 2025 to 2032, the fastest projected growth will come from Torsion Cables. These cables are highly flexible and torque-tight, making them suitable for dynamic applications, including next-gen ultra-slim flexible curved TVs. With consumers looking for more flexible and less cluttered home entertainment systems, torsion cables have become the preferred choice.

By Screen size
The Large-sized Curved Televisions had the largest market share of 51.4% in 2024, empowered by high demand for immersive home theater environments and high-end gaming setups. With better viewing angles, deeper contrast, and the hottest screens in town to anchor a living room today, consumers were fond of these TVs.
Mid-sized Curved Televisions are anticipated to experience the highest CAGR between 2025-2032. This has been fuelled by their growing affordability, space efficiency, and attractiveness to urban households and the rise of the middle class. They are not too big or too small and are perfect for both small living rooms and bedrooms. Moreover, the increasing penetration of smart TVs in a compact with integrated streaming setting is compelling manufacturers to widen their mid-size curved product line.
By End User
The Commercial segment held the highest market share of 47.5% in the curved television market in the year 2024. Mainly due to mass deployment in retail environments, hospitality venues, corporate lobbies, and digital signage applications. That said, in a commercial sense, curved TVs allow for significant visual impact that enhances customer engagement, making it an ideal choice for branding and advertising. These kinds of perfect displays have been deployed in venues of the absolute high end and still high-end hotels to respond to their guests through cinematic ambiance.
The Residential segment is expected to record the highest growth in the forecast years (from 2025 to 2032). With the price of curved TVs steadily dropping and consumers spending more money on home entertainment systems than ever, the appetite is growing for screens that are immersive and look good too. This trend is also being influenced by the increase in smart homes and streaming platforms. The pandemic has made it clear to people that experiencing beautiful images with fantastic audio at home is very good, so today, residential adoption of curved TVs is accelerating very quickly.
Curved Televisions Market Regional Analysis
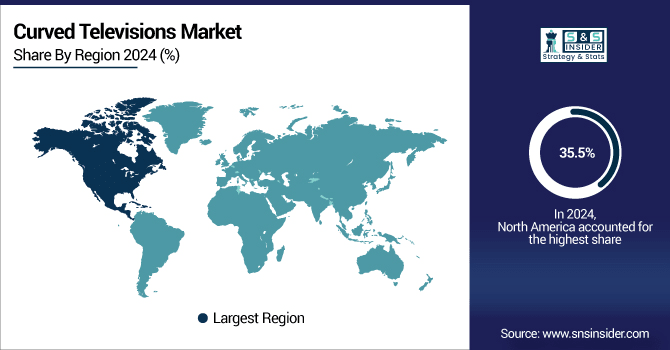
North America held the highest market share of 35.5% in 2024, mainly due to the technological advancements present, high consumer awareness, and strong investment in research and development. Specific contributions have been made by the United States, wherein major corporations like Apple, Google, and Tesla have driven innovation and adoption in various sectors, including electric vehicles, smart manufacturing, and artificial intelligence-powered services. The region is also the home to the likes of Tesla’s Gigafactory in Nevada, which is a case in point of sustainable automotive and energy storage solutions. North America benefits from the availability of skilled labor and robust regulatory frameworks.
Get Customized Report as Per Your Business Requirement - Enquiry Now
The U.S. remains the market leader in this region, leveraging robust public-private partnerships and technology-friendly policies to lead the way.
The Asia Pacific region is expected to have the highest growth rate of 21.2% CAGR over the entire forecast period from 2025 to 2032, due to rapid industrialization, increasing digital transformation investments, and a growing consumer base as a result of a rapidly growing middle class. The China, India, South Korea, Japan axis is heavily investing in smart infrastructure, clean energy, and digital ecologies. Examples include China's "Made in China 2025" for manufacturing innovation, and India's Digital India for internet penetration and provision of digital services.
The Europe region is expected to hold a significant share, with a well-established consumer electronics market and high consumer demand for high-end home entertainment systems, in the Curved Televisions Market. Disposable incomes in the region are abundant, and audiences favor immersive viewing experiences. Home electronics is the category with the most incumbents available throughout Europe, including major retailers and brands from Samsung and LG.
Germany has had the largest market share in this region due to the technologically advanced population, adoption of smart home technologies, and high-end TVs.
Curved Televisions in the Latin America and Middle East & and Africa market are gaining ground with the help of increasing urbanization, an increase in the middle working-class population & change in interest in home entertainment. Adoption is coming more slowly than in the developed regions, but expanding internet access, declining smart TV prices, and the growth of retail networks are slowly but surely increasing penetration of the market in each of their regions.
Curved Televisions Companies are:
Some of the major players in the Curved Televisions Market are Samsung, LG Electronics, Sony, Hisense, TCL, Panasonic, Sharp, Philips, Haier, and Skyworth and others.
Recent Development
-
In February 2025, the IOC and TCL announced a long-term global partnership through to 2032, making TCL a Worldwide Olympic and Paralympic Partner. This deal covers multiple Olympic Games, with TCL providing cutting-edge technologies to enhance experiences for athletes and fans.
-
In November 2024, LG Electronics launched its 2025 OLED evo lineup, featuring AI-powered personalization with the new α 11 AI Gen2 processor. The series includes models with enhanced brightness, wireless connectivity, and advanced gaming features like 4K at 165Hz.
-
In April 2025, Skyworth unveiled its new OmniView Matte Screen technology, offering enhanced contrast and brightness for MiniLED displays. The company also introduced a 100-inch Frame+ TV, combining high-quality visuals with artistic design, competing with top brands in the market.
| Report Attributes | Details |
|---|---|
| Market Size in 2024 | USD 8.69 Billion |
| Market Size by 2032 | USD 72.64 Billion |
| CAGR | CAGR of 30.50% From 2025 to 2032 |
| Base Year | 2024 |
| Forecast Period | 2025-2032 |
| Historical Data | 2021-2023 |
| Report Scope & Coverage | Market Size, Segments Analysis, Competitive Landscape, Regional Analysis, DROC & SWOT Analysis, Forecast Outlook |
| Key Segments | • By Type (Cable Track Cables, Torsion Cables) • By Screen size (Large-sized Curved Televisions, Mid-sized Curved Televisions, Small-sized Curved Televisions) • By End User (Commercial, Institutional, Residential) |
| Regional Analysis/Coverage | North America (US, Canada, Mexico), Europe (Germany, France, UK, Italy, Spain, Poland, Turkey, Rest of Europe), Asia Pacific (China, India, Japan, South Korea, Singapore, Australia, Rest of Asia Pacific), Middle East & Africa (UAE, Saudi Arabia, Qatar, South Africa, Rest of Middle East & Africa), Latin America (Brazil, Argentina, Rest of Latin America) |
| Company Profiles | Samsung, LG Electronics, Sony, Hisense, TCL, Panasonic, Sharp, Philips, Haier, Skyworth |
