Get More Information on Cup Sleeves Market - Request Sample Report
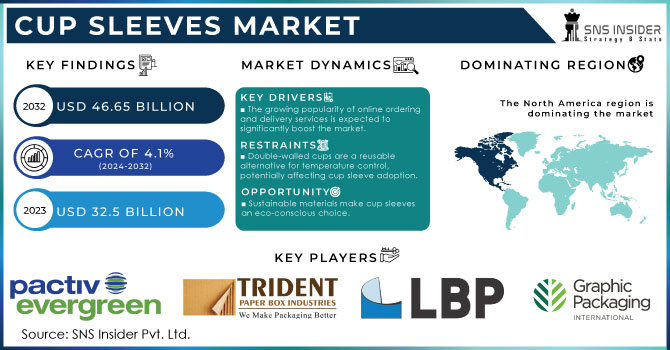
The Cup Sleeves Market Size was valued at USD 32.5 billion in 2023 and is projected to reach USD 46.65 billion by 2032 and grow at a CAGR of 4.1% over the forecast periods 2024 -2032.
Consumers are increasingly environmentally conscious, leading to a demand for eco-friendly packaging solutions. Sustainable cup sleeves made from recycled, biodegradable, or compostable materials are gaining traction due to their reduced environmental footprint. These materials help minimize landfill waste and promote a circular economy. Additionally, sustainable options often boast a lower carbon footprint compared to those made from conventional materials.
Beyond functionality, cup sleeves are evolving into powerful branding tools. Businesses are leveraging their design potential to showcase creativity, connect with customers, and enhance brand recognition. Cup sleeves provide a valuable space to display logos, colors, and unique designs. Eye-catching artwork reinforces brand identity and fosters brand association with the product. In a competitive market, innovative cup sleeve designs offer a unique opportunity for differentiation, leaving a lasting impression on customers.
MARKET DYNAMICS
KEY DRIVERS:
The growing popularity of online ordering and delivery services is expected to significantly boost the market.
The explosion of online food delivery services has transformed how we indulge in our favorite drinks and meals. Consumers, especially those craving coffee, tea, or other hot and cold beverages, are increasingly embracing takeaway and delivery options. This shift towards online convenience has significantly boosted the demand for reliable and efficient packaging solutions, propelling the cup sleeve market forward.
The flourishing coffee culture is expected to be a key driver of growth in the market.
RESTRAINTS:
Double-walled cups are a reusable alternative for temperature control, potentially affecting cup sleeve adoption.
Double-walled cups pose a significant challenge to cup sleeves. Manufacturers argue that these cups effectively maintain beverage temperature without needing a sleeve, offering additional insulation and features like embossing and spot colors. Furthermore, double-walled cups can be more cost-effective, considering they eliminate the need for a separate sleeve and potentially boast special temperature control properties. Their ready availability, reasonable pricing, and short lead times for smaller orders make them an attractive alternative.
Disposable cup sleeves, often made from hard-to-recycle materials, contribute to landfill waste.
OPPORTUNITY:
Sustainable materials make cup sleeves an eco-conscious choice.
Eco-friendly materials are a major reason behind the rise of sustainable cup sleeves. Consumers are increasingly opting for these sleeves made from recycled content, biodegradable options, or compostable materials, all of which boast a smaller environmental footprint. These eco-conscious choices help reduce overall waste and promote a circular economy.
Cup sleeves are now a canvas for innovative designs and artwork, transforming them into powerful branding tools.
CHALLENGES:
Balancing affordability is a major challenge for the cup sleeve market.
While cup sleeves offer branding and marketing opportunities, they add an extra cost to the packaging compared to using a sleeve-less cup. Manufacturers need to carefully consider material selection, production processes, and potential minimum order quantities to create cost-effective cup sleeve solutions. This is especially important to remain competitive with double-walled cups, which may offer a lower perceived cost per use for consumers.
Complying with varying regional regulations on materials and compostability can add complexity.
IMPACT OF RUSSIA-UKRAINE WAR
The war has led to the closure of packaging and production facilities in both Ukraine and Russia, impacting the supply of raw materials like PET (polyethylene terephthalate) used in some cup sleeves. Companies with strong financial ties to the region may face difficulties sourcing materials or finished cup sleeves. Sanctions and logistical challenges can further disrupt global supply chains, impacting the availability and potentially raising the cost of materials needed for cup sleeve production. The war has caused a surge in energy prices, a key input for many manufacturing processes. This translates to potentially higher production costs for cup sleeves. Companies may need to adjust production processes or source materials from alternative locations, potentially leading to increased expenses. Supply chain disruptions, rising production costs, and potential changes in consumer spending could hinder growth.
IMPACT OF ECONOMIC SLOWDOWN
During economic downturns, consumers tend to tighten their belts and prioritize essential goods over non-essential items like takeaway beverages and the cup sleeves that accompany them. This could lead to a decrease in demand for cup sleeves. Businesses facing declining sales and profits may implement cost-cutting measures that impact cup sleeve usage. Restaurants, cafes, and other food service establishments might see a decline in customer traffic during a recession. This can lead to a decrease in demand for cup sleeves as these businesses purchase fewer cups and, consequently, fewer cup sleeves. Overall, an economic slowdown can pose challenges for the cup sleeves market. Reduced consumer spending, business cutbacks, and lower demand from the food service industry can lead to a decline in sales. However, the severity of the impact and potential areas of resilience will depend on the specific nature and duration of the economic downturn.
KEY MARKET SEGMENTS
By Material
Plastic
Paper & Paperboard
Rubber
Paper & paperboard dominating in the cup sleeve market, fueled by a growing emphasis on hygiene, especially post-pandemic. Consumers increasingly prioritize sanitary food and beverage options, driving demand for paper takeout cups and their accompanying paper & paperboard sleeves.
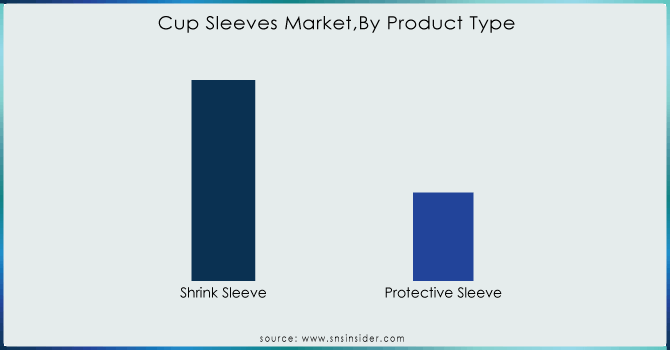
By Product Type
Shrink Sleeve
Protective Sleeve
Protective sleeves lead the cup sleeve market with share of 60%, offering an extra layer of defense for fresh fruit trays. During handling, shipping, and storage, these sleeves shield fruits from physical damage, dust, and pollutants. This not only reduces food waste and spoilage but also helps maintain the quality and freshness of fruits and vegetables. Additionally, protective sleeves act as a barrier, allowing retailers to extend the display and shelf life of their produce.
Get More Information on Cup Sleeves Market - Enquiry Now
By Capacity
200-235 Ml
380-420 Ml
480-540 Ml
530-570 Ml
620-680 Ml
The cup sleeve market caters to various cup sizes, ranging from 200ml to 680ml. However, the 380-420ml segment dominates, holding a 45% market share. This popularity can be attributed to the convenience and versatility of medium-sized cups. Manufacturers prioritize user experience by offering sturdy, leak-proof, and cut-resistant designs for these cups, allowing comfortable handling of beverages for extended periods. Additionally, the eco-friendly nature of paper cups, made from renewable resources, further fuels their popularity within this dominant size segment.
By Channel
Online
Offline
Retail
Direct
The cup sleeves market is currently dominated by offline channels, holding a 63% market share due to the prevalence of retail stores and direct sales. This trend is likely fueled by several factors associated with modern lifestyles such as increasing urbanization, continuous advancements in technology, and a significant change in how consumers shop. Online platforms are attracting buyers with features like scheduled or expedited deliveries, on-demand or subscription services, rising disposable income, and enticing discounts.
By End User
Food & Beverage Industry
Hotels & Restaurants
Cafes & Kiosks
Quick-Service Restaurants
Canteens
The food & beverage industry drives cup sleeve demand due to their temperature control benefits. Single-wall cups paired with cup sleeves offer a cost-effective and insulated solution for both hot and cold takeaway beverages, making them popular with retailers.
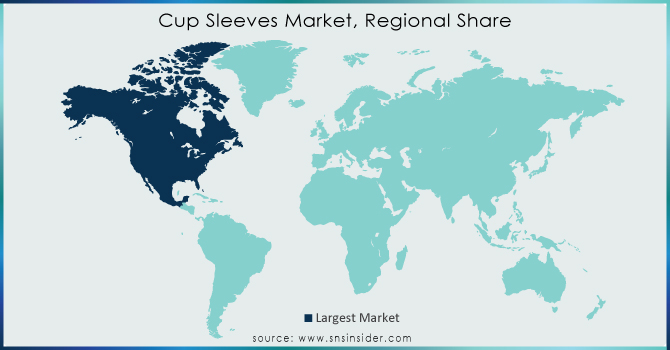
REGIONAL ANALYSIS
The North American market is poised to dominate the cup sleeve industry, fueled by a surging coffee culture. The proliferation of coffee shops, cafes, and quick-service restaurants catering to this daily habit has significantly increased demand for cup sleeves. Europe captures the second-largest market share in cup sleeves, driven by its thriving travel and hotel industries. The influx of tourists visiting European countries significantly boosts demand for takeaway coffee and beverages, consequently increasing the need for cup sleeves. Notably, Germany leads the region in cup sleeve market share, while the UK market exhibits the fastest growth.
The Asia-Pacific market is predicted to experience the fastest growth. This surge is driven by two key factors that are a growing environmental consciousness among consumers and stricter government regulations on single-use plastics. As awareness of the negative impact of disposable plastics increases, consumers are more receptive to sustainable options like cup sleeves. Additionally, stricter regulations on disposable cups in the region are creating a favorable market for cup sleeves. China, currently holding the largest market share in the Asia-Pacific region, and India, with the fastest growth, exemplify this trend.
REGIONAL COVERAGE:
North America
US
Canada
Mexico
Europe
Eastern Europe
Poland
Romania
Hungary
Turkey
Rest of Eastern Europe
Western Europe
Germany
France
UK
Italy
Spain
Netherlands
Switzerland
Austria
Rest of Western Europe
Asia Pacific
China
India
Japan
South Korea
Vietnam
Singapore
Australia
Rest of Asia Pacific
Middle East & Africa
Middle East
UAE
Egypt
Saudi Arabia
Qatar
Rest of Middle East
Africa
Nigeria
South Africa
Rest of Africa
Latin America
Brazil
Argentina
Colombia
Rest of Latin America
Key players
Some the major players in Cup Sleeves Market are Graphic Packaging International, LLC, BriteVision Media, LLC, Pactiv LLC, HotShot Coffee Sleeves USA, LBP Manufacturing LLC, Trident Paper Box Industries, Sabert Corporation, Starbucks Corporation, Printed Cup Company, Novolex And Others Players.
RECENT DEVELOPMENT
In 2023, packaging leader Mondi Group unveiled its innovative insulated cup sleeve, designed to extend the temperature control of both hot and cold beverages.
Sonoco, a global manufacturer of packaging solutions, announced its commitment to sustainability in 2023 with the launch of a new cup sleeve. The sleeve utilizes 100% recycled materials and is compostable in industrial facilities, offering an eco-conscious alternative for hot and cold beverages.
Sustainability leader BioPak joined forces with investment firm Five V Capital in December 2022. This strategic alliance, combining BioPak's eco-friendly packaging expertise with Five V Capital's over AUD 1.5 billion in assets, aims to fuel BioPak's growth and accelerate the shift towards a sustainable future and circular economy.
| Report Attributes | Details |
|---|---|
| Market Size in 2023 | US$ 32.5 Bn |
| Market Size by 2032 | US$ 46.65 Bn |
| CAGR | CAGR of 4.1% From 2024 to 2032 |
| Base Year | 2023 |
| Forecast Period | 2024-2032 |
| Historical Data | 2020-2022 |
| Report Scope & Coverage | Market Size, Segments Analysis, Competitive Landscape, Regional Analysis, DROC & SWOT Analysis, Forecast Outlook |
| Key Segments | • By Material (Plastic, Paper & Paperboard, Rubber) • By Product Type (Shrink Sleeve, Protective Sleeve) • By Capacity (200-235 Ml, 380-420 Ml, 480-540 Ml, 530-570 Ml, 620-680 Ml) • By Channel [Online, Offline (Retail, Direct)] • By End User (Food & Beverage Industry, Hotels & Restaurants, Cafes & Kiosks, Quick-Service Restaurants, Canteens) |
| Regional Analysis/Coverage | North America (US, Canada, Mexico), Europe (Eastern Europe [Poland, Romania, Hungary, Turkey, Rest of Eastern Europe] Western Europe] Germany, France, UK, Italy, Spain, Netherlands, Switzerland, Austria, Rest of Western Europe]), Asia Pacific (China, India, Japan, South Korea, Vietnam, Singapore, Australia, Rest of Asia Pacific), Middle East & Africa (Middle East [UAE, Egypt, Saudi Arabia, Qatar, Rest of Middle East], Africa [Nigeria, South Africa, Rest of Africa], Latin America (Brazil, Argentina, Colombia Rest of Latin America) |
| Company Profiles | Graphic Packaging International, LLC, BriteVision Media, LLC, Pactiv LLC, HotShot Coffee Sleeves USA, LBP Manufacturing LLC, Trident Paper Box Industries, Sabert Corporation, Starbucks Corporation, Printed Cup Company, Novolex |
| Key Drivers | • The growing popularity of online ordering and delivery services is expected to significantly boost the market. • The flourishing coffee culture is expected to be a key driver of growth in the market. |
| Key Restraints | • Double-walled cups are a reusable alternative for temperature control, potentially affecting cup sleeve adoption. • Disposable cup sleeves, often made from hard-to-recycle materials, contribute to landfill waste. |
Ans: The Cup Sleeves Market is expected to grow at a CAGR of 4.1%.
Ans: Cup Sleeves Market size was USD 32.5 billion in 2023 and is expected to Reach USD 46.65 billion by 2032.
Ans: The growing popularity of online ordering and delivery services is expected to significantly boost the market.
Ans: Double-walled cups are a reusable alternative for temperature control, potentially affecting cup sleeve adoption.
Ans: North America holds the dominant position in the Cup Sleeves Market.
TABLE OF CONTENTS
1. Introduction
1.1 Market Definition
1.2 Scope
1.3 Research Assumptions
2. Industry Flowchart
3. Research Methodology
4. Market Dynamics
4.1 Drivers
4.2 Restraints
4.3 Opportunities
4.4 Challenges
5. Impact Analysis
5.1 Impact of Russia-Ukraine Crisis
5.2 Impact of Economic Slowdown on Major Countries
5.2.1 Introduction
5.2.2 United States
5.2.3 Canada
5.2.4 Germany
5.2.5 France
5.2.6 UK
5.2.7 China
5.2.8 Japan
5.2.9 South Korea
5.2.10 India
6. Value Chain Analysis
7. Porter’s 5 Forces Model
8. Pest Analysis
9. Cup Sleeves Market Segmentation, By Material
9.1 Introduction
9.2 Trend Analysis
9.3 Plastic
9.4 Paper & Paperboard
9.5 Rubber
10. Cup Sleeves Market Segmentation, By Product Type
10.1 Introduction
10.2 Trend Analysis
10.3 Shrink Sleeve
10.4 Protective Sleeve
11. Cup Sleeves Market Segmentation, By Capacity
11.1 Introduction
11.2 Trend Analysis
11.3 200-235 Ml
11.4 380-420 Ml
11.5 480-540 Ml
11.6 530-570 Ml
11.7 620-680 Ml
12. Cup Sleeves Market Segmentation, By Channel
12.1 Introduction
12.2 Trend Analysis
12.3 Online
12.4 Offline
12.4.1 Retail
12.4.2 Direct
13. Cup Sleeves Market Segmentation, By End User
13.1 Introduction
13.2 Trend Analysis
13.3 Food & Beverage Industry
13.4 Hotels & Restaurants
13.5 Cafes & Kiosks
13.6 Quick-Service Restaurants
13.7 Canteens
14. Regional Analysis
14.1 Introduction
14.2 North America
14.2.1 Trend Analysis
14.2.2 North America Cup Sleeves Market By Country
14.2.3 North America Cup Sleeves Market By Material
14.2.4 North America Cup Sleeves Market By Product Type
14.2.5 North America Cup Sleeves Market By Capacity
14.2.6 North America Cup Sleeves Market, By Channel
14.2.7 North America Cup Sleeves Market, By End User
14.2.8 USA
14.2.8.1 USA Cup Sleeves Market By Material
14.2.8.2 USA Cup Sleeves Market By Product Type
14.2.8.3 USA Cup Sleeves Market By Capacity
14.2.8.4 USA Cup Sleeves Market, By Channel
14.2.8.5 USA Cup Sleeves Market, By End User
14.2.9 Canada
14.2.9.1 Canada Cup Sleeves Market By Material
14.2.9.2 Canada Cup Sleeves Market By Product Type
14.2.9.3 Canada Cup Sleeves Market By Capacity
14.2.9.4 Canada Cup Sleeves Market, By Channel
14.2.9.5 Canada Cup Sleeves Market, By End User
14.2.10 Mexico
14.2.10.1 Mexico Cup Sleeves Market By Material
14.2.10.2 Mexico Cup Sleeves Market By Product Type
14.2.10.3 Mexico Cup Sleeves Market By Capacity
14.2.10.4 Mexico Cup Sleeves Market, By Channel
14.2.10.5 Mexico Cup Sleeves Market, By End User
14.3 Europe
14.3.1 Trend Analysis
14.3.2 Eastern Europe
14.3.2.1 Eastern Europe Cup Sleeves Market By Country
14.3.2.2 Eastern Europe Cup Sleeves Market By Material
14.3.2.3 Eastern Europe Cup Sleeves Market By Product Type
14.3.2.4 Eastern Europe Cup Sleeves Market By Capacity
14.3.2.5 Eastern Europe Cup Sleeves Market By Channel
14.3.2.6 Eastern Europe Cup Sleeves Market, By End User
14.3.2.7 Poland
14.3.2.7.1 Poland Cup Sleeves Market By Material
14.3.2.7.2 Poland Cup Sleeves Market By Product Type
14.3.2.7.3 Poland Cup Sleeves Market By Capacity
14.3.2.7.4 Poland Cup Sleeves Market By Channel
14.3.2.7.5 Poland Cup Sleeves Market, By End User
14.3.2.8 Romania
14.3.2.8.1 Romania Cup Sleeves Market By Material
14.3.2.8.2 Romania Cup Sleeves Market By Product Type
14.3.2.8.3 Romania Cup Sleeves Market By Capacity
14.3.2.8.4 Romania Cup Sleeves Market By Channel
14.3.2.8.5 Romania Cup Sleeves Market, By End User
14.3.2.9 Hungary
14.3.2.9.1 Hungary Cup Sleeves Market By Material
14.3.2.9.2 Hungary Cup Sleeves Market By Product Type
14.3.2.9.3 Hungary Cup Sleeves Market By Capacity
14.3.2.9.4 Hungary Cup Sleeves Market By Channel
14.3.2.9.5 Hungary Cup Sleeves Market, By End User
14.3.2.10 Turkey
14.3.2.10.1 Turkey Cup Sleeves Market By Material
14.3.2.10.2 Turkey Cup Sleeves Market By Product Type
14.3.2.10.3 Turkey Cup Sleeves Market By Capacity
14.3.2.10.4 Turkey Cup Sleeves Market By Channel
14.3.2.10.5 Turkey Cup Sleeves Market, By End User
14.3.2.11 Rest of Eastern Europe
14.3.2.11.1 Rest of Eastern Europe Cup Sleeves Market By Material
14.3.2.11.2 Rest of Eastern Europe Cup Sleeves Market By Product Type
14.3.2.11.3 Rest of Eastern Europe Cup Sleeves Market By Capacity
14.3.2.11.4 Rest of Eastern Europe Cup Sleeves Market By Channel
14.3.2.11.5 Rest of Eastern Europe Cup Sleeves Market, By End User
14.3.3 Western Europe
14.3.3.1 Western Europe Cup Sleeves Market By Country
14.3.3.2 Western Europe Cup Sleeves Market By Material
14.3.3.3 Western Europe Cup Sleeves Market By Product Type
14.3.3.4 Western Europe Cup Sleeves Market By Capacity
14.3.3.5 Western Europe Cup Sleeves Market By Channel
14.3.3.6 Western Europe Cup Sleeves Market, By End User
14.3.3.7 Germany
14.3.3.7.1 Germany Cup Sleeves Market By Material
14.3.3.7.2 Germany Cup Sleeves Market By Product Type
14.3.3.7.3 Germany Cup Sleeves Market By Capacity
14.3.3.7.4 Germany Cup Sleeves Market By Channel
14.3.3.7.5 Germany Cup Sleeves Market, By End User
14.3.3.8 France
14.3.3.8.1 France Cup Sleeves Market By Material
14.3.3.8.2 France Cup Sleeves Market By Product Type
14.3.3.8.3 France Cup Sleeves Market By Capacity
14.3.3.8.4 France Cup Sleeves Market By Channel
14.3.3.8.5 France Cup Sleeves Market, By End User
14.3.3.9 UK
14.3.3.9.1 UK Cup Sleeves Market By Material
14.3.3.9.2 UK Cup Sleeves Market By Product Type
14.3.3.9.3 UK Cup Sleeves Market By Capacity
14.3.3.9.4 UK Cup Sleeves Market By Channel
14.3.3.9.5 UK Cup Sleeves Market, By End User
14.3.3.10 Italy
14.3.3.10.1 Italy Cup Sleeves Market By Material
14.3.3.10.2 Italy Cup Sleeves Market By Product Type
14.3.3.10.3 Italy Cup Sleeves Market By Capacity
14.3.3.10.4 Italy Cup Sleeves Market By Channel
14.3.3.10.5 Italy Cup Sleeves Market, By End User
14.3.3.11 Spain
14.3.3.11.1 Spain Cup Sleeves Market By Material
14.3.3.11.2 Spain Cup Sleeves Market By Product Type
14.3.3.11.3 Spain Cup Sleeves Market By Capacity
14.3.3.11.4 Spain Cup Sleeves Market By Channel
14.3.3.11.5 Spain Cup Sleeves Market, By End User
14.3.3.12 Netherlands
14.3.3.12.1 Netherlands Cup Sleeves Market By Material
14.3.3.12.2 Netherlands Cup Sleeves Market By Product Type
14.3.3.12.3 Netherlands Cup Sleeves Market By Capacity
14.3.3.12.4 Netherlands Cup Sleeves Market By Channel
14.3.3.12.5 Netherlands Cup Sleeves Market, By End User
14.3.3.13 Switzerland
14.3.3.13.1 Switzerland Cup Sleeves Market By Material
14.3.3.13.2 Switzerland Cup Sleeves Market By Product Type
14.3.3.13.3 Switzerland Cup Sleeves Market By Capacity
14.3.3.13.4 Switzerland Cup Sleeves Market By Channel
14.3.3.13.5 Switzerland Cup Sleeves Market, By End User
14.3.3.14 Austria
14.3.3.14.1 Austria Cup Sleeves Market By Material
14.3.3.14.2 Austria Cup Sleeves Market By Product Type
14.3.3.14.3 Austria Cup Sleeves Market By Capacity
14.3.3.14.4 Austria Cup Sleeves Market By Channel
14.3.3.14.5 Austria Cup Sleeves Market, By End User
14.3.3.15 Rest of Western Europe
14.3.3.15.1 Rest of Western Europe Cup Sleeves Market By Material
14.3.3.15.2 Rest of Western Europe Cup Sleeves Market By Product Type
14.3.3.15.3 Rest of Western Europe Cup Sleeves Market By Capacity
14.3.3.15.4 Rest of Western Europe Cup Sleeves Market By Channel
14.3.3.15.5 Rest of Western Europe Cup Sleeves Market, By End User
14.4 Asia-Pacific
14.4.1 Trend Analysis
14.4.2 Asia-Pacific Cup Sleeves Market By country
14.4.3 Asia-Pacific Cup Sleeves Market By Material
14.4.4 Asia-Pacific Cup Sleeves Market By Product Type
14.4.5 Asia-Pacific Cup Sleeves Market By Capacity
14.4.6 Asia-Pacific Cup Sleeves Market By Channel
14.4.7 Asia-Pacific Cup Sleeves Market, By End User
14.4.8 China
14.4.8.1 China Cup Sleeves Market By Material
14.4.8.2 China Cup Sleeves Market By Product Type
14.4.8.3 China Cup Sleeves Market By Capacity
14.4.8.4 China Cup Sleeves Market By Channel
14.4.8.5 China Cup Sleeves Market, By End User
14.4.9 India
14.4.9.1 India Cup Sleeves Market By Material
14.4.9.2 India Cup Sleeves Market By Product Type
14.4.9.3 India Cup Sleeves Market By Capacity
14.4.9.4 India Cup Sleeves Market By Channel
14.4.9.5 India Cup Sleeves Market, By End User
14.4.10 Japan
14.4.10.1 Japan Cup Sleeves Market By Material
14.4.10.2 Japan Cup Sleeves Market By Product Type
14.4.10.3 Japan Cup Sleeves Market By Capacity
14.4.10.4 Japan Cup Sleeves Market By Channel
14.4.10.5 Japan Cup Sleeves Market, By End User
14.4.11 South Korea
14.4.11.1 South Korea Cup Sleeves Market By Material
14.4.11.2 South Korea Cup Sleeves Market By Product Type
14.4.11.3 South Korea Cup Sleeves Market By Capacity
14.4.11.4 South Korea Cup Sleeves Market By Channel
14.4.11.5 South Korea Cup Sleeves Market, By End User
14.4.12 Vietnam
14.4.12.1 Vietnam Cup Sleeves Market By Material
14.4.12.2 Vietnam Cup Sleeves Market By Product Type
14.4.12.3 Vietnam Cup Sleeves Market By Capacity
14.4.12.4 Vietnam Cup Sleeves Market By Channel
14.4.12.5 Vietnam Cup Sleeves Market, By End User
14.4.13 Singapore
14.4.13.1 Singapore Cup Sleeves Market By Material
14.4.13.2 Singapore Cup Sleeves Market By Product Type
14.4.13.3 Singapore Cup Sleeves Market By Capacity
14.4.13.4 Singapore Cup Sleeves Market By Channel
14.4.13.5 Singapore Cup Sleeves Market, By End User
14.4.14 Australia
14.4.14.1 Australia Cup Sleeves Market By Material
14.4.14.2 Australia Cup Sleeves Market By Product Type
14.4.14.3 Australia Cup Sleeves Market By Capacity
14.4.14.4 Australia Cup Sleeves Market By Channel
14.4.14.5 Australia Cup Sleeves Market, By End User
14.4.15 Rest of Asia-Pacific
14.4.15.1 Rest of Asia-Pacific Cup Sleeves Market By Material
14.4.15.2 Rest of Asia-Pacific Cup Sleeves Market By Product Type
14.4.15.3 Rest of Asia-Pacific Cup Sleeves Market By Capacity
14.4.15.4 Rest of Asia-Pacific Cup Sleeves Market By Channel
14.4.15.5 Rest of Asia-Pacific Cup Sleeves Market, By End User
14.5 Middle East & Africa
14.5.1 Trend Analysis
14.5.2 Middle East
14.5.2.1 Middle East Cup Sleeves Market By Country
14.5.2.2 Middle East Cup Sleeves Market By Material
14.5.2.3 Middle East Cup Sleeves Market By Product Type
14.5.2.4 Middle East Cup Sleeves Market By Capacity
14.5.2.5 Middle East Cup Sleeves Market By Channel
14.5.2.6 Middle East Cup Sleeves Market, By End User
14.5.2.7 UAE
14.5.2.7.1 UAE Cup Sleeves Market By Material
14.5.2.7.2 UAE Cup Sleeves Market By Product Type
14.5.2.7.3 UAE Cup Sleeves Market By Capacity
14.5.2.7.4 UAE Cup Sleeves Market By Channel
14.5.2.7.5 UAE Cup Sleeves Market, By End User
14.5.2.8 Egypt
14.5.2.8.1 Egypt Cup Sleeves Market By Material
14.5.2.8.2 Egypt Cup Sleeves Market By Product Type
14.5.2.8.3 Egypt Cup Sleeves Market By Capacity
14.5.2.8.4 Egypt Cup Sleeves Market By Channel
14.5.2.8.5 Egypt Cup Sleeves Market, By End User
14.5.2.9 Saudi Arabia
14.5.2.9.1 Saudi Arabia Cup Sleeves Market By Material
14.5.2.9.2 Saudi Arabia Cup Sleeves Market By Product Type
14.5.2.9.3 Saudi Arabia Cup Sleeves Market By Capacity
14.5.2.9.4 Saudi Arabia Cup Sleeves Market By Channel
14.5.2.9.5 Saudi Arabia Cup Sleeves Market, By End User
14.5.2.10 Qatar
14.5.2.10.1 Qatar Cup Sleeves Market By Material
14.5.2.10.2 Qatar Cup Sleeves Market By Product Type
14.5.2.10.3 Qatar Cup Sleeves Market By Capacity
14.5.2.10.4 Qatar Cup Sleeves Market By Channel
14.5.2.10.5 Qatar Cup Sleeves Market, By End User
14.5.2.11 Rest of Middle East
14.5.2.11.1 Rest of Middle East Cup Sleeves Market By Material
14.5.2.11.2 Rest of Middle East Cup Sleeves Market By Product Type
14.5.2.11.3 Rest of Middle East Cup Sleeves Market By Capacity
14.5.2.11.4 Rest of Middle East Cup Sleeves Market By Channel
14.5.2.11.5 Rest of Middle East Cup Sleeves Market, By End User
14.5.3 Africa
14.5.3.1 Africa Cup Sleeves Market By Country
14.5.3.2 Africa Cup Sleeves Market By Material
14.5.3.3 Africa Cup Sleeves Market By Product Type
14.5.3.4 Africa Cup Sleeves Market By Capacity
14.5.3.5 Africa Cup Sleeves Market By Channel
14.5.3.6 Africa Cup Sleeves Market, By End User
14.5.3.7 Nigeria
14.5.3.7.1 Nigeria Cup Sleeves Market By Material
14.5.3.7.2 Nigeria Cup Sleeves Market By Product Type
14.5.3.7.3 Nigeria Cup Sleeves Market By Capacity
14.5.3.7.4 Nigeria Cup Sleeves Market By Channel
14.5.3.7.5 Nigeria Cup Sleeves Market, By End User
14.5.3.8 South Africa
14.5.3.8.1 South Africa Cup Sleeves Market By Material
14.5.3.8.2 South Africa Cup Sleeves Market By Product Type
14.5.3.8.3 South Africa Cup Sleeves Market By Capacity
14.5.3.8.4 South Africa Cup Sleeves Market By Channel
14.5.3.8.5 South Africa Cup Sleeves Market, By End User
14.5.3.9 Rest of Africa
14.5.3.9.1 Rest of Africa Cup Sleeves Market By Material
14.5.3.9.2 Rest of Africa Cup Sleeves Market By Product Type
14.5.3.9.3 Rest of Africa Cup Sleeves Market By Capacity
14.5.3.9.4 Rest of Africa Cup Sleeves Market By Channel
14.5.3.9.5 Rest of Africa Cup Sleeves Market, By End User
14.6 Latin America
14.6.1 Trend Analysis
14.6.2 Latin America Cup Sleeves Market By country
14.6.3 Latin America Cup Sleeves Market By Material
14.6.4 Latin America Cup Sleeves Market By Product Type
14.6.5 Latin America Cup Sleeves Market By Capacity
14.6.6 Latin America Cup Sleeves Market By Channel
14.6.7 Latin America Cup Sleeves Market, By End User
14.6.8 Brazil
14.6.8.1 Brazil Cup Sleeves Market By Material
14.6.8.2 Brazil Cup Sleeves Market By Product Type
14.6.8.3 Brazil Cup Sleeves Market By Capacity
14.6.8.4 Brazil Cup Sleeves Market By Channel
14.6.8.5 Brazil Cup Sleeves Market, By End User
14.6.9 Argentina
14.6.9.1 Argentina Cup Sleeves Market By Material
14.6.9.2 Argentina Cup Sleeves Market By Product Type
14.6.9.3 Argentina Cup Sleeves Market By Capacity
14.6.9.4 Argentina Cup Sleeves Market By Channel
14.6.9.5 Argentina Cup Sleeves Market, By End User
14.6.10 Colombia
14.6.10.1 Colombia Cup Sleeves Market By Material
14.6.10.2 Colombia Cup Sleeves Market By Product Type
14.6.10.3 Colombia Cup Sleeves Market By Capacity
14.6.10.4 Colombia Cup Sleeves Market By Channel
14.6.10.5 Colombia Cup Sleeves Market, By End User
14.6.11 Rest of Latin America
14.6.11.1 Rest of Latin America Cup Sleeves Market By Material
14.6.11.2 Rest of Latin America Cup Sleeves Market By Product Type
14.6.11.3 Rest of Latin America Cup Sleeves Market By Capacity
14.6.11.4 Rest of Latin America Cup Sleeves Market By Channel
14.6.11.5 Rest of Latin America Cup Sleeves Market, By End User
15. Company Profiles
15.1Graphic Packaging International, LLC
15.1.1 Company Overview
15.1.2 Financial
15.1.3 Products/ Services Offered
15.1.4 SWOT Analysis
15.1.5 The SNS View
15.2 BriteVision Media, LLC
15.2.1 Company Overview
15.2.2 Financial
15.2.3 Products/ Services Offered
15.2.4 SWOT Analysis
15.2.5 The SNS View
15.3 Pactiv LLC
15.3.1 Company Overview
15.3.2 Financial
15.3.3 Products/ Services Offered
15.3.4 SWOT Analysis
15.3.5 The SNS View
15.4 HotShot Coffee Sleeves USA
15.4.1 Company Overview
15.4.2 Financial
15.4.3 Products/ Services Offered
15.4.4 SWOT Analysis
15.4.5 The SNS View
15.5 LBP Manufacturing LLC
15.5.1 Company Overview
15.5.2 Financial
15.5.3 Products/ Services Offered
15.5.4 SWOT Analysis
15.5.5 The SNS View
15.6 Trident Paper Box Industries
15.6.1 Company Overview
15.6.2 Financial
15.6.3 Products/ Services Offered
15.6.4 SWOT Analysis
15.6.5 The SNS View
15.7 Sabert Corporation
15.7.1 Company Overview
15.7.2 Financial
15.7.3 Products/ Services Offered
15.7.4 SWOT Analysis
15.7.5 The SNS View
15.8 Starbucks Corporation
15.8.1 Company Overview
15.8.2 Financial
15.8.3 Products/ Services Offered
15.8.4 SWOT Analysis
15.8.5 The SNS View
15.9Printed Cup Company
15.9.1 Company Overview
15.9.2 Financial
15.9.3 Products/ Services Offered
15.9.4 SWOT Analysis
15.9.5 The SNS View
15.10 Novolex
15.10.1 Company Overview
15.10.2 Financial
15.10.3 Products/ Services Offered
15.10.4 SWOT Analysis
15.10.5 The SNS View
16. Competitive Landscape
16.1 Competitive Benchmarking
16.2 Market Share Analysis
16.3 Recent Developments
16.3.1 Industry News
16.3.2 Company News
16.3.3 Mergers & Acquisitions
17. Use Case and Best Practices
18. Conclusion
An accurate research report requires proper strategizing as well as implementation. There are multiple factors involved in the completion of good and accurate research report and selecting the best methodology to compete the research is the toughest part. Since the research reports we provide play a crucial role in any company’s decision-making process, therefore we at SNS Insider always believe that we should choose the best method which gives us results closer to reality. This allows us to reach at a stage wherein we can provide our clients best and accurate investment to output ratio.
Each report that we prepare takes a timeframe of 350-400 business hours for production. Starting from the selection of titles through a couple of in-depth brain storming session to the final QC process before uploading our titles on our website we dedicate around 350 working hours. The titles are selected based on their current market cap and the foreseen CAGR and growth.
The 5 steps process:
Step 1: Secondary Research:
Secondary Research or Desk Research is as the name suggests is a research process wherein, we collect data through the readily available information. In this process we use various paid and unpaid databases which our team has access to and gather data through the same. This includes examining of listed companies’ annual reports, Journals, SEC filling etc. Apart from this our team has access to various associations across the globe across different industries. Lastly, we have exchange relationships with various university as well as individual libraries.

Step 2: Primary Research
When we talk about primary research, it is a type of study in which the researchers collect relevant data samples directly, rather than relying on previously collected data. This type of research is focused on gaining content specific facts that can be sued to solve specific problems. Since the collected data is fresh and first hand therefore it makes the study more accurate and genuine.
We at SNS Insider have divided Primary Research into 2 parts.
Part 1 wherein we interview the KOLs of major players as well as the upcoming ones across various geographic regions. This allows us to have their view over the market scenario and acts as an important tool to come closer to the accurate market numbers. As many as 45 paid and unpaid primary interviews are taken from both the demand and supply side of the industry to make sure we land at an accurate judgement and analysis of the market.
This step involves the triangulation of data wherein our team analyses the interview transcripts, online survey responses and observation of on filed participants. The below mentioned chart should give a better understanding of the part 1 of the primary interview.

Part 2: In this part of primary research the data collected via secondary research and the part 1 of the primary research is validated with the interviews from individual consultants and subject matter experts.
Consultants are those set of people who have at least 12 years of experience and expertise within the industry whereas Subject Matter Experts are those with at least 15 years of experience behind their back within the same space. The data with the help of two main processes i.e., FGDs (Focused Group Discussions) and IDs (Individual Discussions). This gives us a 3rd party nonbiased primary view of the market scenario making it a more dependable one while collation of the data pointers.
Step 3: Data Bank Validation
Once all the information is collected via primary and secondary sources, we run that information for data validation. At our intelligence centre our research heads track a lot of information related to the market which includes the quarterly reports, the daily stock prices, and other relevant information. Our data bank server gets updated every fortnight and that is how the information which we collected using our primary and secondary information is revalidated in real time.

Step 4: QA/QC Process
After all the data collection and validation our team does a final level of quality check and quality assurance to get rid of any unwanted or undesired mistakes. This might include but not limited to getting rid of the any typos, duplication of numbers or missing of any important information. The people involved in this process include technical content writers, research heads and graphics people. Once this process is completed the title gets uploader on our platform for our clients to read it.
Step 5: Final QC/QA Process:
This is the last process and comes when the client has ordered the study. In this process a final QA/QC is done before the study is emailed to the client. Since we believe in giving our clients a good experience of our research studies, therefore, to make sure that we do not lack at our end in any way humanly possible we do a final round of quality check and then dispatch the study to the client.
The Sachet Packaging Market size was USD 8.65 billion in 2023 and is expected to Reach USD 13.27 billion by 2031 and grow at a CAGR of 5.5% over the forecast period of 2024-2031.
The AI In Packaging Market Size was valued at USD 2100 million in 2023 and is expected to reach USD 5593.62 million by 2031 and grow at a CAGR of 11.5 % over the forecast period 2024-2031.
The Augmented Reality (AR) in Packaging Market valued at USD 9.0 billion in 2023 and it will reach USD 139.31 billion by 2032, grow at a CAGR of 35.5% by 2032.
The Container Liner Market Size was valued at USD 892 million in 2023 and is expected to reach USD 1360.24 million by 2032 and grow at a CAGR of 4.8 % over the forecast period 2024-2032.
The Petrochemical Packaging Market Size was valued at USD 1104.31 billion in 2023 and is expected to reach USD 1869.23 billion by 2031 and grow at a CAGR of 6.8% over the forecast period 2024-2031.
The Dunnage Packaging Market size was USD 4.08 billion in 2023 and is expected to Reach USD 6.55 billion by 2031 and grow at a CAGR of 6.1% over the forecast period of 2024-2031.

Hi! Click one of our member below to chat on Phone
© 2025 All Rights Reserved by SNS Insider Pvt Ltd


