image

Cryptocurrency Market Report Scope & Overview:

Cryptocurrency Market,Revenue Analysis

Get more information on Cryptocurrency Market - Request Sample Report

Cryptocurrency Market was valued at USD 5.08 billion in 2023 and is expected to reach USD 15.39 Billion by 2032, growing at a CAGR of 13.13% from 2024-2032.
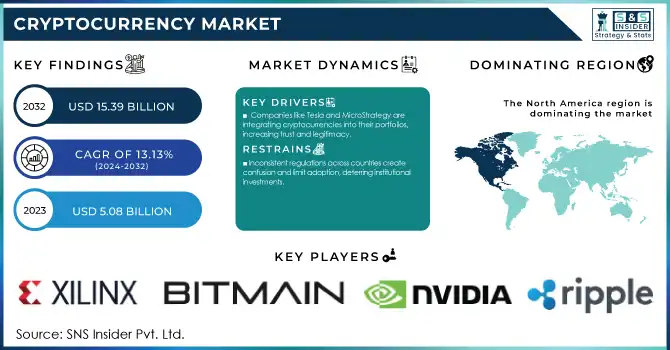
The cryptocurrency market’s remarkable growth is driven by rising adoption, innovative technology, and expanding use cases. Blockchain networks now host over 220 million monthly active addresses—a threefold increase since late 2023—demonstrating widespread global engagement. Stablecoins stand out as a transformative force, facilitating USD 8.5 trillion in transactions in Q2 2024, surpassing Visa’s USD 3.9 trillion during the same period. These digital currencies effectively bridge the gap between traditional financial systems and cryptocurrency, offering secure, low-cost, and efficient transaction solutions. Institutional interest continues to surge, as evidenced by companies like Tesla and MicroStrategy incorporating Bitcoin into their portfolios, boosting overall market confidence.

Technological advancements such as Ethereum’s upgrades and layer-2 scaling solutions have further enhanced transaction efficiency and cost-effectiveness, making cryptocurrencies increasingly attractive to both institutional and retail users. In South America, cryptocurrency ownership surged by over 116% in the past year, highlighting its role in fostering financial inclusion for underbanked communities. Asia, meanwhile, remains a major hub, with 327 million users driving the adoption of digital payments and blockchain applications. Beyond speculative trading, the market is diversifying with use cases like cross-border payments, non-fungible tokens (NFTs), and decentralized applications (dApps). Ripple’s XRP has become a preferred choice for global financial transfers due to its efficiency, while decentralized exchanges like Uniswap empower users by reducing reliance on traditional financial platforms.

Despite its rapid growth, the cryptocurrency market faces challenges such as price volatility and evolving regulatory frameworks, which will be critical in determining its long-term scalability and sustainability.

Market Dynamics

Drivers

  • Companies like Tesla and MicroStrategy are integrating cryptocurrencies into their portfolios, increasing trust and legitimacy

  • Innovations such as Ethereum 2.0 and layer-2 scaling solutions improve transaction speed and reduce costs

  • Applications in cross-border payments, NFTs, decentralized finance (DeFi), and decentralized apps (dApps) are broadening crypto's utility

The cryptocurrency market is increasingly expanding its applications beyond speculative trading, leveraging cross-border payments, non-fungible tokens (NFTs), decentralized finance (DeFi), and decentralized applications (dApps) to redefine traditional industries. These innovations are fostering financial inclusion, driving technological innovation, and enhancing operational efficiency across various sectors. In cross-border payments, cryptocurrencies such as Bitcoin, Ripple's XRP, and stablecoins offer rapid, cost-efficient alternatives to traditional banking systems. By eliminating intermediaries like banks, these solutions enable near-instant transfers at reduced costs, making them highly appealing for remittances and international trade. This disrupts conventional systems like SWIFT by bypassing prolonged settlement periods and high fees.

NFTs are transforming digital ownership and intellectual property rights in fields like art, gaming, and entertainment. Platforms such as OpenSea empower creators to mint and trade NFTs directly, fostering a new digital economy. The gaming industry, in particular, utilizes NFTs for tokenized in-game assets that can be traded or sold, boosting user engagement and monetization.

DeFi platforms leverage blockchain to offer decentralized versions of traditional financial services, including lending, borrowing, and insurance. Solutions like Aave and Compound enable users to earn interest or secure loans without relying on banks, which is particularly impactful in underbanked regions. By offering inclusive financial opportunities, DeFi is unlocking access to millions of people worldwide. Decentralized applications (dApps) further enhance blockchain’s utility by addressing use cases such as decentralized exchanges, supply chain management, and identity verification. These applications prioritize transparency, security, and censorship resistance, making them indispensable in industries requiring high trust and accountability.

Together, these advancements demonstrate the transformative potential of cryptocurrency, fostering more inclusive, decentralized, and efficient systems while driving continued market growth.

Restraints

  • Inconsistent regulations across countries create confusion and limit adoption, deterring institutional investments​

  • Extreme fluctuations in cryptocurrency prices undermine its viability as a stable investment or payment method

  • Vulnerabilities like hacking, scams, and fraud in exchanges and wallets raise trust issues among users​

The cryptocurrency market continues to face significant challenges posed by vulnerabilities like hacking, scams, and fraud, especially in exchanges and wallets—key ecosystem components. These security flaws weaken user confidence and present major hurdles to wider market adoption.

Cryptocurrency exchanges, which enable the trading of digital assets, have consistently been high-value targets for cybercriminals. Noteworthy incidents, the USD 625 million hack of the Ronin Network in 2022, highlight the scale of potential damage. These attacks expose gaps in platform security and lead to substantial financial losses, undermining trust in centralized exchanges and the overall crypto ecosystem.

Wallets, particularly hot wallets connected to the internet, also present significant security concerns. These wallets are frequently targeted by phishing scams, malware, and private key theft, with the loss of private keys resulting in permanent access loss to funds. Fraudulent schemes like Ponzi scams and fake ICOs have further exploited users, leading to billions in losses. For example, phishing attacks targeting wallet users rose sharply in 2024, by over 45%, underlining the urgent need for improved security and user education.

These vulnerabilities lead to financial damages and deter retail and institutional investors who demand secure and trustworthy platforms for asset management. To counter these risks, platforms invest in robust security measures, such as multi-factor authentication, hardware wallets, and decentralized exchanges to reduce reliance on vulnerable centralized systems. Regulatory authorities are also stepping in to enhance compliance, accountability, and oversight, aiming to curb fraudulent activities and strengthen user trust.

While these efforts have made progress, the ongoing risks of hacking and fraud remain a significant challenge for the cryptocurrency market. This underscores the critical need for continued advancements in security technology and comprehensive regulatory frameworks to ensure user trust and long-term market stability.

Segment Analysis

By Type

Bitcoin dominated the market and represented a significant revenue share of more than 40.25% in 2023. Bitcoin will continue to grow due to its strong status as the first cryptocurrency and its increasing adoption by institutional investors such as Tesla and MicroStrategy which are integrating Bitcoin into their balance sheets. Moreover, Bitcoin is known as a store of value, or "digital gold," which is another factor maintaining this market domination. DeFi, NFTs, and the shift towards proof-of-stake (Ethereum 2.0) are major catalysts for growth. Continued dApp adoption from the functionality of its network

Ethereum is anticipated to register the highest compound annual growth rate (CAGR) during the forecast period. Ethereum’s innovative smart contract capabilities and the rise of decentralized finance (DeFi) applications have driven its rapid adoption. Ethereum’s transition from proof-of-work to proof-of-stake through its Ethereum 2.0 upgrade has also enhanced scalability, reduced energy consumption, and attracted more developers. The rise of DeFi, non-fungible tokens (NFTs), and Ethereum’s move to proof-of-stake (Ethereum 2.0) are key growth drivers. The Ethereum network's ability to support decentralized applications (dApps) continues to fuel adoption.

By Component

The Hardware segment dominated the crypto market and represented a significant revenue share of 68.23%, and this can be attributed to significant demand for mining hardware such as ASICs and GPUs. For large coins like Bitcoin or Ethereum, validating their transactions requires mining. With the increasing complexity of mining operations, and the price of cryptocurrencies such as Bitcoin continuing to soar, there is a greater demand for purpose-built hardware to address these challenges. The continued transition to Ethereum 2.0 and the expansion of institutional mining operations have also pushed hardware demand higher.

The software segment is anticipated to grow at the fastest growth rate in the cryptocurrency market. These are driven by the rising utilization of blockchain platforms, decentralized finance (DeFi) solutions, wallet applications, and cryptocurrency exchanges. As the use cases of block chain technology expand in the form of NFTs, Smart contracts, and decentralized applications (dApps), a growing need for crypto-related software has emerged. The main forces behind it are the expansion of DeFi platforms, innovations of Ethereum 2.0, and growing interest of secure non-custodial wallets. The software sector is leading in terms of growth with increasing BaaS (blockchain-as-a-service) offerings for businesses giving another momentum to the software sector.

By Process

The mining segment dominated the cryptocurrency market and represented a significant revenue share of 62.3%, serving a crucial role in transaction validation and blockchain security. Mining is vital for creating new digital currencies and upholding transaction integrity, particularly for dominant assets like Bitcoin and Ethereum. As digital asset adoption grows and values increase, the demand for specialized mining hardware and energy-intensive operations rises significantly. The transition to Ethereum 2.0, which shifts from Proof of Work (PoW) to Proof of Stake (PoS), is redefining mining processes while sparking innovation in mining hardware, especially for Bitcoin and other cryptocurrencies. Key factors driving mining market growth include the surge in Bitcoin prices, rising institutional investments, and the growing complexity of mining algorithms, all contributing to a demand for more advanced, efficient mining hardware.

The transaction segment is anticipated to witness the highest compound annual growth rate (CAGR) in the cryptocurrency market. This segment covers the processing and validation of cryptocurrency transactions, a growth area driven by the increasing use of digital currencies for payments, remittances, and decentralized finance (DeFi) services. With blockchain technology becoming more mainstream, the volume of transactions across platforms like Bitcoin, Ethereum, and stable coins continues to rise. Factors fueling this growth include widespread cryptocurrency adoption for daily transactions, the expansion of decentralized exchanges, and innovations in transaction speed and cost efficiency, notably through Layer-2 technologies like the Lightning Network.
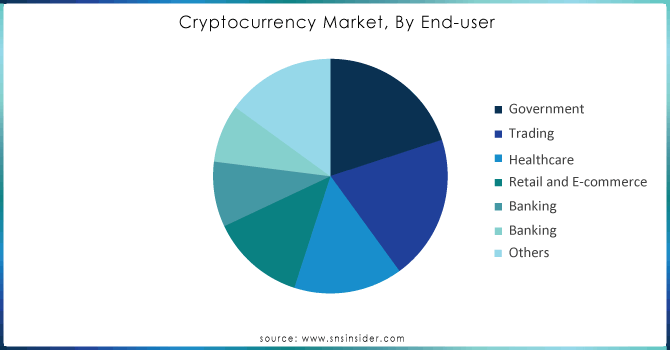
 

Cryptocurrency-Market-By-End-user.

Do you need any customization research study on Cryptocurrency Market - Enquiry Now


Regional Analysis

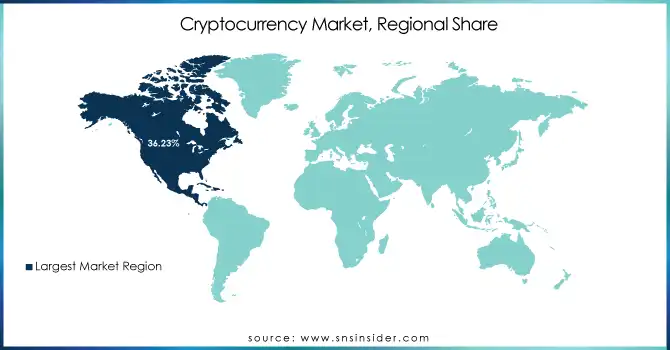
In 2023, North America dominated the cryptocurrency market and represented revenue share of 36.23%, driven by the concentration of cryptocurrency mining farms, such as Riot Blockchain, Marathon Digital, and Bitfarm. These facilities play a critical role in validating transactions and securing blockchain networks, especially for cryptocurrencies like Bitcoin and Ethereum. The rapid adoption of cryptocurrencies in the U.S. and the recognition of digital currencies as viable investment assets by major financial institutions are also contributing to the region's growth. Moreover, the increasing use of cryptocurrencies for transactions in retail spaces further supports this expansion. Moving forward, North America is expected to maintain strong growth, especially with institutional investments and technological advancements in blockchain systems

The Asia Pacific region is experiencing the highest compound annual growth rate (CAGR) in the cryptocurrency market. Countries like Japan, South Korea, and China are driving this growth, thanks to their strong focus on blockchain innovation and cryptocurrency infrastructure. In particular, Japan’s government-backed initiatives and China’s dominance in mining hardware production contribute significantly. Additionally, decentralized finance (DeFi) and blockchain research in the region continue to thrive, attracting both institutional and retail investors. The active development of blockchain applications for a wide range of industries, from finance to supply chain management, is poised to further accelerate market expansion in the region​

Cryptocurrency-Market-Regional-Analysis-2023

Key Players

The major key players along with their products are

  • Coinbase - Coinbase Exchange

  • Binance - Binance Exchange

  • Kraken - Kraken Exchange

  • Gemini - Gemini Wallet

  • Bitfinex - Bitfinex Exchange

  • Ripple Labs - Ripple (XRP)

  • Ethereum Foundation - Ethereum Blockchain

  • Bitcoin Foundation - Bitcoin Protocol

  • Chainalysis - Chainalysis Reactor (Compliance and Investigation Tool)

  • BlockFi - BlockFi Interest Account (BIA)

  • Bitmain - Antminer S19 Pro (ASIC Miner)

  • Ledger - Ledger Nano X (Hardware Wallet)

  • Tether - Tether (USDT)

  • OKX - OKX Exchange

  • KuCoin - KuCoin Exchange

  • Crypto.com - Crypto.com App

  • Cardano (IOHK) - Cardano Blockchain

  • Polkadot - Polkadot Blockchain

  • Avalanche - Avalanche Blockchain

  • Uniswap - Uniswap Protocol

Recent Developments

January 2024 – SEC Approval of Bitcoin ETFs: The U.S. Securities and Exchange Commission (SEC) is expected to make a historic decision on the approval of spot Bitcoin Exchange-Traded Funds (ETFs) by January 2024. This has created considerable anticipation in the market, with experts predicting a high likelihood of approval. This approval is anticipated to bring more institutional investors into the cryptocurrency space, potentially boosting mainstream acceptance of digital currencies​

January 2024 – Ethereum’s Layer-2 Scaling Solutions: Ethereum has made notable progress with its Layer-2 scaling solutions aimed at reducing transaction congestion and fees. These solutions are expected to significantly enhance the platform's scalability and improve user experiences, driving further adoption in the decentralized finance (DeFi) space

Cryptocurrency Market Report Scope:

Report Attributes Details
Market Size in 2023  USD 5.08 billion
Market Size by 2032  USD 15.39 Billion
CAGR   CAGR of 13.13% from 2024-2032
Base Year  2023
Forecast Period  2024-2032
Historical Data  2020-2022
Report Scope & Coverage Market Size, Segments Analysis, Competitive  Landscape, Regional Analysis, DROC & SWOT Analysis, Forecast Outlook
Key Segments • By Component (Hardware, Software)
• By Process (Mining, Transaction)
• By Type (Bitcoin, Ethereum, Bitcoin Cash, Ripple, Litecoin, Dash, Others)
• By Application (Trading, Payments, Remittance, Banking, Others)
Regional Analysis/Coverage North America (US, Canada, Mexico), Europe (Eastern Europe [Poland, Romania, Hungary, Turkey, Rest of Eastern Europe] Western Europe] Germany, France, UK, Italy, Spain, Netherlands, Switzerland, Austria, Rest of Western Europe]), Asia Pacific (China, India, Japan, South Korea, Vietnam, Singapore, Australia, Rest of Asia Pacific), Middle East & Africa (Middle East [UAE, Egypt, Saudi Arabia, Qatar, Rest of Middle East], Africa [Nigeria, South Africa, Rest of Africa], Latin America (Brazil, Argentina, Colombia, Rest of Latin America)
Company Profiles Bitmain, NVIDIA, Xilinx, Intel, Advanced Micro Devices, Ripple Labs, Ethereum Foundation, Bitfury Group, Coinbase, BitGo, Binance Holdings, Canaan Creative, Bitstamp.
Key Drivers •Companies like Tesla and MicroStrategy are integrating cryptocurrencies into their portfolios, increasing trust and legitimacy
•Innovations such as Ethereum 2.0 and layer-2 scaling solutions improve transaction speed and reduce costs
•Applications in cross-border payments, NFTs, decentralized finance (DeFi), and decentralized apps (dApps) are broadening crypto's utility
Market Opportunities •Inconsistent regulations across countries create confusion and limit adoption, deterring institutional investments
•Extreme fluctuations in cryptocurrency prices undermine its viability as a stable investment or payment method
•Vulnerabilities like hacking, scams, and fraud in exchanges and wallets raise trust issues among users


Frequently Asked Questions

Ans- Challenges in the Cryptocurrency Market are

  • Inconsistent regulations across countries create confusion and limit adoption, deterring institutional investments?
  • Extreme fluctuations in cryptocurrency prices undermine its viability as a stable investment or payment method

Ans- one main growth factor for the Cryptocurrency Market is

  • Companies like Tesla and MicroStrategy are integrating cryptocurrencies into their portfolios, increasing trust and legitimacy

Ans- the North America dominated the market and represented a significant revenue share in 2023

Ans- the CAGR of the Cryptocurrency Market during the forecast period is 13.13% from 2024-2032.

Ans Cryptocurrency Market was valued at USD 5.08 billion in 2023 and is expected to reach USD 15.39 Billion by 2032, growing at a CAGR of 13.13% from 2024-2032.

TABLE OF CONTENTS

1. Introduction

1.1 Market Definition

1.2 Scope (Inclusion and Exclusions)

1.3 Research Assumptions

2. Executive Summary

2.1 Market Overview

2.2 Regional Synopsis

2.3 Competitive Summary

3. Research Methodology

3.1 Top-Down Approach

3.2 Bottom-up Approach

3.3. Data Validation

3.4 Primary Interviews

4. Market Dynamics Impact Analysis

4.1 Market Driving Factors Analysis

4.1.1 Drivers

4.1.2 Restraints

4.1.3 Opportunities

4.1.4 Challenges

4.2 PESTLE Analysis

4.3 Porter’s Five Forces Model

5. Statistical Insights and Trends Reporting

5.1 Adoption Rates of Emerging Technologies

5.2 Network Infrastructure Expansion, by Region

5.3 Cybersecurity Incidents, by Region (2020-2023)

5.4 Cloud Services Usage, by Region

6. Competitive Landscape

6.1 List of Major Companies, By Region

6.2 Market Share Analysis, By Region

6.3 Product Benchmarking

6.3.1 Product specifications and features

6.3.2 Pricing

6.4 Strategic Initiatives

6.4.1 Marketing and promotional activities

6.4.2 Distribution and supply chain strategies

6.4.3 Expansion plans and new product launches

6.4.4 Strategic partnerships and collaborations

6.5 Technological Advancements

6.6 Market Positioning and Branding

7. Cryptocurrency Market Segmentation, by Type

7.1 Chapter Overview

7.2Bitcoin

7.2.1 Bitcoin Market Trends Analysis (2020-2032)

7.2.2 Bitcoin Market Size Estimates and Forecasts to 2032 (USD Billion)

7.3Ethereum

7.3.1Ethereum Market Trends Analysis (2020-2032)

7.3.2Ethereum Market Size Estimates and Forecasts to 2032 (USD Billion)

7.4Bitcoin Cash

7.4.1Bitcoin Cash Market Trends Analysis (2020-2032)

7.4.2Bitcoin Cash Market Size Estimates and Forecasts to 2032 (USD Billion)

7.5Ripple

7.5.1Ripple Market Trends Analysis (2020-2032)

7.5.2Ripple Market Size Estimates and Forecasts to 2032 (USD Billion)

7.6Litecoin

7.6.1Litecoin Market Trends Analysis (2020-2032)

7.6.2Litecoin Market Size Estimates and Forecasts to 2032 (USD Billion)

7.7Dashcoin

7.7.1Dashcoin Market Trends Analysis (2020-2032)

7.7.2Dashcoin Market Size Estimates and Forecasts to 2032 (USD Billion)

7.8Others

7.8.1Others Market Trends Analysis (2020-2032)

7.8.2Others Market Size Estimates and Forecasts to 2032 (USD Billion)

8. Cryptocurrency Market Segmentation, by Process

8.1 Chapter Overview

      8.2 Mining

8.2.1 Mining Market Trends Analysis (2020-2032)

8.2.2 Mining Market Size Estimates and Forecasts to 2032 (USD Billion)

8.3 Transaction

         8.3.1 Transaction Market Trends Analysis (2020-2032)

8.3.2 Transaction Market Size Estimates and Forecasts to 2032 (USD Billion)

9. Cryptocurrency Market Segmentation, by Component

9.1 Chapter Overview

9.2 Hardware

         9.2.1 Hardware Market Trends Analysis (2020-2032)

9.2.2 Hardware Market Size Estimates and Forecasts to 2032 (USD Billion)

         9.2.3 Central Processing Unit

         9.2.3.1 Central Processing Unit Market Trends Analysis (2020-2032)

9.2.3.2 Central Processing Unit Market Size Estimates and Forecasts to 2032 (USD Billion)

         9.2.4 Graphics Processing Unit

         9.2.4.1 Graphics Processing Unit Market Trends Analysis (2020-2032)

9.2.4.2 Graphics Processing Unit Market Size Estimates and Forecasts to 2032 (USD Billion)

        9.2.5 Application-Specific Integrated Circuit

         9.2.5.1 Application-Specific Integrated Circuit Market Trends Analysis (2020-2032)

9.2.5.2 Application-Specific Integrated Circuit Market Size Estimates and Forecasts to 2032 (USD Billion)

         9.2.6 Field Programmable Gate Array

         9.2.6.1 Field Programmable Gate Array Market Trends Analysis (2020-2032)

9.2.6.2 Field Programmable Gate Array Market Size Estimates and Forecasts to 2032 (USD Billion)

9.3 Software

9.3.1 Software Market Trends Analysis (2020-2032)

9.3.2 Software Market Size Estimates and Forecasts to 2032 (USD Billion)

         9.3.3 Mining Software

9.3.3.1 Mining Software Market Trends Analysis (2020-2032)

9.3.3.2 Mining Software Market Size Estimates and Forecasts to 2032 (USD Billion)

         9.3.4 Exchange Software

9.3.4.1 Exchange Software Market Trends Analysis (2020-2032)

9.3.4.2 Exchange Software Market Size Estimates and Forecasts to 2032 (USD Billion)

        9.3.5 Wallet

9.3.5.1 Wallet Market Trends Analysis (2020-2032)

9.3.5.2 Wallet Market Size Estimates and Forecasts to 2032 (USD Billion)

         9.3.6 Payment

9.3.6.1 Payment Market Trends Analysis (2020-2032)

9.3.6.2 Payment Market Size Estimates and Forecasts to 2032 (USD Billion)

         9.3.7 Others

9.3.7.1 Others Market Trends Analysis (2020-2032)

9.3.7.2 Others Market Size Estimates and Forecasts to 2032 (USD Billion)

10. Cryptocurrency Market Segmentation, by End-use  

10.1 Chapter Overview

10.2 Banking


               10.2.1 Banking Market Trends Analysis (2020-2032)

10.2.2 Banking Market Size Estimates and Forecasts to 2032 (USD Billion)

10.3 Gaming

10.3.1 Gaming Market Trends Analysis (2020-2032)

10.3.2 Gaming Market Size Estimates and Forecasts to 2032 (USD Billion)

10.4 Government

10.4.1 Government Market Trends Analysis (2020-2032)

10.4.2 Government Market Size Estimates and Forecasts to 2032 (USD Billion)

10.5 Healthcare

10.5.1 Healthcare Market Trends Analysis (2020-2032)

10.5.2 Healthcare Market Size Estimates and Forecasts to 2032 (USD Billion)

10.6 Retail & E-commerce

10.6.1 Retail & E-commerce Market Trends Analysis (2020-2032)

10.6.2 Retail & E-commerce Market Size Estimates and Forecasts to 2032 (USD Billion)

10.7 Trading

10.7.1 Trading Market Trends Analysis (2020-2032)

10.7.2 Trading Market Size Estimates and Forecasts to 2032 (USD Billion)

10.8 Others

10.8.1 Others Market Trends Analysis (2020-2032)

10.8.2 Others Market Size Estimates and Forecasts to 2032 (USD Billion)

11. Regional Analysis

11.1 Chapter Overview

11.2 North America

11.2.1 Trends Analysis

11.2.2 North America Cryptocurrency Market Estimates and Forecasts, by Country (2020-2032) (USD Billion)

11.2.3 North America Cryptocurrency Market Estimates and Forecasts, by Type (2020-2032) (USD Billion)  

11.2.4 North America Cryptocurrency Market Estimates and Forecasts, by Process (2020-2032) (USD Billion)

11.2.5 North America Cryptocurrency Market Estimates and Forecasts, by Component (2020-2032) (USD Billion)

11.2.6 North America Cryptocurrency Market Estimates and Forecasts, by End-Use (2020-2032) (USD Billion)

11.2.7 USA

11.2.7.1 USA Cryptocurrency Market Estimates and Forecasts, by Type (2020-2032) (USD Billion)

11.2.7.2 USA Cryptocurrency Market Estimates and Forecasts, by Process (2020-2032) (USD Billion)

11.2.7.3 USA Cryptocurrency Market Estimates and Forecasts, by Component (2020-2032) (USD Billion)

11.2.7.4 USA Cryptocurrency Market Estimates and Forecasts, by End-Use (2020-2032) (USD Billion)

11.2.8 Canada

11.2.8.1 Canada Cryptocurrency Market Estimates and Forecasts, by Type (2020-2032) (USD Billion)

11.2.8.2 Canada Cryptocurrency Market Estimates and Forecasts, by Process (2020-2032) (USD Billion)

11.2.8.3 Canada Cryptocurrency Market Estimates and Forecasts, by Component (2020-2032) (USD Billion)

11.2.8.4 Canada Cryptocurrency Market Estimates and Forecasts, by End-Use (2020-2032) (USD Billion)

11.2.9 Mexico

11.2.9.1 Mexico Cryptocurrency Market Estimates and Forecasts, by Type (2020-2032) (USD Billion)

11.2.9.2 Mexico Cryptocurrency Market Estimates and Forecasts, by Process (2020-2032) (USD Billion)

11.2.9.3 Mexico Cryptocurrency Market Estimates and Forecasts, by Component (2020-2032) (USD Billion)

11.2.9.4 Mexico Cryptocurrency Market Estimates and Forecasts, by End-Use (2020-2032) (USD Billion)

11.3 Europe

11.3.1 Eastern Europe

11.3.1.1 Trends Analysis

11.3.1.2 Eastern Europe Cryptocurrency Market Estimates and Forecasts, by Country (2020-2032) (USD Billion)

11.3.1.3 Eastern Europe Cryptocurrency Market Estimates and Forecasts, by Type (2020-2032) (USD Billion)  

11.3.1.4 Eastern Europe Cryptocurrency Market Estimates and Forecasts, by Process (2020-2032) (USD Billion)

11.3.1.5 Eastern Europe Cryptocurrency Market Estimates and Forecasts, by Component (2020-2032) (USD Billion)

11.3.1.6 Eastern Europe Cryptocurrency Market Estimates and Forecasts, by End-Use (2020-2032) (USD Billion)

11.3.1.7 Poland

11.3.1.7.1 Poland Cryptocurrency Market Estimates and Forecasts, by Type (2020-2032) (USD Billion)

11.3.1.7.2 Poland Cryptocurrency Market Estimates and Forecasts, by Process (2020-2032) (USD Billion)

11.3.1.7.3 Poland Cryptocurrency Market Estimates and Forecasts, by Component (2020-2032) (USD Billion)

11.3.1.7.4 Poland Cryptocurrency Market Estimates and Forecasts, by End-Use (2020-2032) (USD Billion)

11.3.1.8 Romania

11.3.1.8.1 Romania Cryptocurrency Market Estimates and Forecasts, by Type (2020-2032) (USD Billion)

11.3.1.8.2 Romania Cryptocurrency Market Estimates and Forecasts, by Process (2020-2032) (USD Billion)

11.3.1.8.3 Romania Cryptocurrency Market Estimates and Forecasts, by Component (2020-2032) (USD Billion)

11.3.1.8.4 Romania Cryptocurrency Market Estimates and Forecasts, by End-Use (2020-2032) (USD Billion)

11.3.1.9 Hungary

11.3.1.9.1 Hungary Cryptocurrency Market Estimates and Forecasts, by Type (2020-2032) (USD Billion)

11.3.1.9.2 Hungary Cryptocurrency Market Estimates and Forecasts, by Process (2020-2032) (USD Billion)

11.3.1.9.3 Hungary Cryptocurrency Market Estimates and Forecasts, by Component (2020-2032) (USD Billion)

11.3.1.9.4 Hungary Cryptocurrency Market Estimates and Forecasts, by End-Use (2020-2032) (USD Billion)

11.3.1.10 Turkey

11.3.1.10.1 Turkey Cryptocurrency Market Estimates and Forecasts, by Type (2020-2032) (USD Billion)

11.3.1.10.2 Turkey Cryptocurrency Market Estimates and Forecasts, by Process (2020-2032) (USD Billion)

11.3.1.10.3 Turkey Cryptocurrency Market Estimates and Forecasts, by Component (2020-2032) (USD Billion)

11.3.1.10.4 Turkey Cryptocurrency Market Estimates and Forecasts, by End-Use (2020-2032) (USD Billion)

11.3.1.11 Rest of Eastern Europe

11.3.1.11.1 Rest of Eastern Europe Cryptocurrency Market Estimates and Forecasts, by Type (2020-2032) (USD Billion)

11.3.1.11.2 Rest of Eastern Europe Cryptocurrency Market Estimates and Forecasts, by Process (2020-2032) (USD Billion)

11.3.1.11.3 Rest of Eastern Europe Cryptocurrency Market Estimates and Forecasts, by Component (2020-2032) (USD Billion)

11.3.1.11.4 Rest of Eastern Europe Cryptocurrency Market Estimates and Forecasts, by End-Use (2020-2032) (USD Billion)

11.3.2 Western Europe

11.3.2.1 Trends Analysis

11.3.2.2 Western Europe Cryptocurrency Market Estimates and Forecasts, by Country (2020-2032) (USD Billion)

11.3.2.3 Western Europe Cryptocurrency Market Estimates and Forecasts, by Type (2020-2032) (USD Billion)  

11.3.2.4 Western Europe Cryptocurrency Market Estimates and Forecasts, by Process (2020-2032) (USD Billion)

11.3.2.5 Western Europe Cryptocurrency Market Estimates and Forecasts, by Component (2020-2032) (USD Billion)

11.3.2.6 Western Europe Cryptocurrency Market Estimates and Forecasts, by End-Use (2020-2032) (USD Billion)

11.3.2.7 Germany

11.3.2.7.1 Germany Cryptocurrency Market Estimates and Forecasts, by Type (2020-2032) (USD Billion)

11.3.2.7.2 Germany Cryptocurrency Market Estimates and Forecasts, by Process (2020-2032) (USD Billion)

11.3.2.7.3 Germany Cryptocurrency Market Estimates and Forecasts, by Component (2020-2032) (USD Billion)

11.3.2.7.4 Germany Cryptocurrency Market Estimates and Forecasts, by End-Use (2020-2032) (USD Billion)

11.3.2.8 France

11.3.2.8.1 France Cryptocurrency Market Estimates and Forecasts, by Type (2020-2032) (USD Billion)

11.3.2.8.2 France Cryptocurrency Market Estimates and Forecasts, by Process (2020-2032) (USD Billion)

11.3.2.8.3 France Cryptocurrency Market Estimates and Forecasts, by Component (2020-2032) (USD Billion)

11.3.2.8.4 France Cryptocurrency Market Estimates and Forecasts, by End-Use (2020-2032) (USD Billion)

11.3.2.9 UK

11.3.2.9.1 UK Cryptocurrency Market Estimates and Forecasts, by Type (2020-2032) (USD Billion)

11.3.2.9.2 UK Cryptocurrency Market Estimates and Forecasts, by Process (2020-2032) (USD Billion)

11.3.2.9.3 UK Cryptocurrency Market Estimates and Forecasts, by Component (2020-2032) (USD Billion)

11.3.2.9.4 UK Cryptocurrency Market Estimates and Forecasts, by End-Use (2020-2032) (USD Billion)

11.3.2.10 Italy

11.3.2.10.1 Italy Cryptocurrency Market Estimates and Forecasts, by Type (2020-2032) (USD Billion)

11.3.2.10.2 Italy Cryptocurrency Market Estimates and Forecasts, by Process (2020-2032) (USD Billion)

11.3.2.10.3 Italy Cryptocurrency Market Estimates and Forecasts, by Component (2020-2032) (USD Billion)

11.3.2.10.4 Italy Cryptocurrency Market Estimates and Forecasts, by End-Use (2020-2032) (USD Billion)

11.3.2.11 Spain

11.3.2.11.1 Spain Cryptocurrency Market Estimates and Forecasts, by Type (2020-2032) (USD Billion)

11.3.2.11.2 Spain Cryptocurrency Market Estimates and Forecasts, by Process (2020-2032) (USD Billion)

11.3.2.11.3 Spain Cryptocurrency Market Estimates and Forecasts, by Component (2020-2032) (USD Billion)

11.3.2.11.4 Spain Cryptocurrency Market Estimates and Forecasts, by End-Use (2020-2032) (USD Billion)

11.3.2.12 Netherlands

11.3.2.12.1 Netherlands Cryptocurrency Market Estimates and Forecasts, by Type (2020-2032) (USD Billion)

11.3.2.12.2 Netherlands Cryptocurrency Market Estimates and Forecasts, by Process (2020-2032) (USD Billion)

11.3.2.12.3 Netherlands Cryptocurrency Market Estimates and Forecasts, by Component (2020-2032) (USD Billion)

11.3.2.12.4 Netherlands Cryptocurrency Market Estimates and Forecasts, by End-Use (2020-2032) (USD Billion)

11.3.2.13 Switzerland

11.3.2.13.1 Switzerland Cryptocurrency Market Estimates and Forecasts, by Type (2020-2032) (USD Billion)

11.3.2.13.2 Switzerland Cryptocurrency Market Estimates and Forecasts, by Process (2020-2032) (USD Billion)

11.3.2.13.3 Switzerland Cryptocurrency Market Estimates and Forecasts, by Component (2020-2032) (USD Billion)

11.3.2.13.4 Switzerland Cryptocurrency Market Estimates and Forecasts, by End-Use (2020-2032) (USD Billion)

11.3.2.14 Austria

11.3.2.14.1 Austria Cryptocurrency Market Estimates and Forecasts, by Type (2020-2032) (USD Billion)

11.3.2.14.2 Austria Cryptocurrency Market Estimates and Forecasts, by Process (2020-2032) (USD Billion)

11.3.2.14.3 Austria Cryptocurrency Market Estimates and Forecasts, by Component (2020-2032) (USD Billion)

11.3.2.14.4 Austria Cryptocurrency Market Estimates and Forecasts, by End-Use (2020-2032) (USD Billion)

11.3.2.15 Rest of Western Europe

11.3.2.15.1 Rest of Western Europe Cryptocurrency Market Estimates and Forecasts, by Type (2020-2032) (USD Billion)

11.3.2.15.2 Rest of Western Europe Cryptocurrency Market Estimates and Forecasts, by Process (2020-2032) (USD Billion)

11.3.2.15.3 Rest of Western Europe Cryptocurrency Market Estimates and Forecasts, by Component (2020-2032) (USD Billion)

11.3.2.15.4 Rest of Western Europe Cryptocurrency Market Estimates and Forecasts, by End-Use (2020-2032) (USD Billion)

11.4 Asia Pacific

11.4.1 Trends Analysis

11.4.2 Asia Pacific Cryptocurrency Market Estimates and Forecasts, by Country (2020-2032) (USD Billion)

11.4.3 Asia Pacific Cryptocurrency Market Estimates and Forecasts, by Type (2020-2032) (USD Billion)  

11.4.4 Asia Pacific Cryptocurrency Market Estimates and Forecasts, by Process (2020-2032) (USD Billion)

11.4.5 Asia Pacific Cryptocurrency Market Estimates and Forecasts, by Component (2020-2032) (USD Billion)

11.4.6 Asia Pacific Cryptocurrency Market Estimates and Forecasts, by End-Use (2020-2032) (USD Billion)

11.4.7 China

11.4.7.1 China Cryptocurrency Market Estimates and Forecasts, by Type (2020-2032) (USD Billion)

11.4.7.2 China Cryptocurrency Market Estimates and Forecasts, by Process (2020-2032) (USD Billion)

11.4.7.3 China Cryptocurrency Market Estimates and Forecasts, by Component (2020-2032) (USD Billion)

11.4.7.4 China Cryptocurrency Market Estimates and Forecasts, by End-Use (2020-2032) (USD Billion)

11.4.8 India

11.4.8.1 India Cryptocurrency Market Estimates and Forecasts, by Type (2020-2032) (USD Billion)

11.4.8.2 India Cryptocurrency Market Estimates and Forecasts, by Process (2020-2032) (USD Billion)

11.4.8.3 India Cryptocurrency Market Estimates and Forecasts, by Component (2020-2032) (USD Billion)

11.4.8.4 India Cryptocurrency Market Estimates and Forecasts, by End-Use (2020-2032) (USD Billion)

11.4.9 Japan

11.4.9.1 Japan Cryptocurrency Market Estimates and Forecasts, by Type (2020-2032) (USD Billion)

11.4.9.2 Japan Cryptocurrency Market Estimates and Forecasts, by Process (2020-2032) (USD Billion)

11.4.9.3 Japan Cryptocurrency Market Estimates and Forecasts, by Component (2020-2032) (USD Billion)

11.4.9.4 Japan Cryptocurrency Market Estimates and Forecasts, by End-Use (2020-2032) (USD Billion)

11.4.10 South Korea

11.4.10.1 South Korea Cryptocurrency Market Estimates and Forecasts, by Type (2020-2032) (USD Billion)

11.4.10.2 South Korea Cryptocurrency Market Estimates and Forecasts, by Process (2020-2032) (USD Billion)

11.4.10.3 South Korea Cryptocurrency Market Estimates and Forecasts, by Component (2020-2032) (USD Billion)

11.4.10.4 South Korea Cryptocurrency Market Estimates and Forecasts, by End-Use (2020-2032) (USD Billion)

11.4.11 Vietnam

11.4.11.1 Vietnam Cryptocurrency Market Estimates and Forecasts, by Type (2020-2032) (USD Billion)

11.4.11.2 Vietnam Cryptocurrency Market Estimates and Forecasts, by Process (2020-2032) (USD Billion)

11.4.11.3 Vietnam Cryptocurrency Market Estimates and Forecasts, by Component (2020-2032) (USD Billion)

11.4.11.4 Vietnam Cryptocurrency Market Estimates and Forecasts, by End-Use (2020-2032) (USD Billion)

11.4.12 Singapore

11.4.12.1 Singapore Cryptocurrency Market Estimates and Forecasts, by Type (2020-2032) (USD Billion)

11.4.12.2 Singapore Cryptocurrency Market Estimates and Forecasts, by Process (2020-2032) (USD Billion)

11.4.12.3 Singapore Cryptocurrency Market Estimates and Forecasts, by Component (2020-2032) (USD Billion)

11.4.12.4 Singapore Cryptocurrency Market Estimates and Forecasts, by End-Use (2020-2032) (USD Billion)

11.4.13 Australia

11.4.13.1 Australia Cryptocurrency Market Estimates and Forecasts, by Type (2020-2032) (USD Billion)

11.4.13.2 Australia Cryptocurrency Market Estimates and Forecasts, by Process (2020-2032) (USD Billion)

11.4.13.3 Australia Cryptocurrency Market Estimates and Forecasts, by Component (2020-2032) (USD Billion)

11.4.13.4 Australia Cryptocurrency Market Estimates and Forecasts, by End-Use (2020-2032) (USD Billion)

11.4.14 Rest of Asia Pacific

11.4.14.1 Rest of Asia Pacific Cryptocurrency Market Estimates and Forecasts, by Type (2020-2032) (USD Billion)

11.4.14.2 Rest of Asia Pacific Cryptocurrency Market Estimates and Forecasts, by Process (2020-2032) (USD Billion)

11.4.14.3 Rest of Asia Pacific Cryptocurrency Market Estimates and Forecasts, by Component (2020-2032) (USD Billion)

11.4.14.4 Rest of Asia Pacific Cryptocurrency Market Estimates and Forecasts, by End-Use (2020-2032) (USD Billion)

11.5 Middle East and Africa

11.5.1 Middle East

11.5.1.1 Trends Analysis

11.5.1.2 Middle East Cryptocurrency Market Estimates and Forecasts, by Country (2020-2032) (USD Billion)

11.5.1.3 Middle East Cryptocurrency Market Estimates and Forecasts, by Type (2020-2032) (USD Billion)  

11.5.1.4 Middle East Cryptocurrency Market Estimates and Forecasts, by Process (2020-2032) (USD Billion)

11.5.1.5 Middle East Cryptocurrency Market Estimates and Forecasts, by Component (2020-2032) (USD Billion)

11.5.1.6 Middle East Cryptocurrency Market Estimates and Forecasts, by End-Use (2020-2032) (USD Billion)

11.5.1.7 UAE

11.5.1.7.1 UAE Cryptocurrency Market Estimates and Forecasts, by Type (2020-2032) (USD Billion)

11.5.1.7.2 UAE Cryptocurrency Market Estimates and Forecasts, by Process (2020-2032) (USD Billion)

11.5.1.7.3 UAE Cryptocurrency Market Estimates and Forecasts, by Component (2020-2032) (USD Billion)

11.5.1.7.4 UAE Cryptocurrency Market Estimates and Forecasts, by End-Use   (2020-2032) (USD Billion)

11.5.1.8 Egypt

11.5.1.8.1 Egypt Cryptocurrency Market Estimates and Forecasts, by Type (2020-2032) (USD Billion)

11.5.1.8.2 Egypt Cryptocurrency Market Estimates and Forecasts, by Process (2020-2032) (USD Billion)

11.5.1.8.3 Egypt Cryptocurrency Market Estimates and Forecasts, by Component (2020-2032) (USD Billion)

11.5.1.8.4 Egypt Cryptocurrency Market Estimates and Forecasts, by End-Use (2020-2032) (USD Billion)

11.5.1.9 Saudi Arabia

11.5.1.9.1 Saudi Arabia Cryptocurrency Market Estimates and Forecasts, by Type (2020-2032) (USD Billion)

11.5.1.9.2 Saudi Arabia Cryptocurrency Market Estimates and Forecasts, by Process (2020-2032) (USD Billion)

11.5.1.9.3 Saudi Arabia Cryptocurrency Market Estimates and Forecasts, by Component (2020-2032) (USD Billion)

11.5.1.9.4 Saudi Arabia Cryptocurrency Market Estimates and Forecasts, by End-Use (2020-2032) (USD Billion)

11.5.1.10 Qatar

11.5.1.10.1 Qatar Cryptocurrency Market Estimates and Forecasts, by Type (2020-2032) (USD Billion)

11.5.1.10.2 Qatar Cryptocurrency Market Estimates and Forecasts, by Process (2020-2032) (USD Billion)

11.5.1.10.3 Qatar Cryptocurrency Market Estimates and Forecasts, by Component (2020-2032) (USD Billion)

11.5.1.10.4 Qatar Cryptocurrency Market Estimates and Forecasts, by End-Use (2020-2032) (USD Billion)

11.5.1.11 Rest of Middle East

11.5.1.11.1 Rest of Middle East Cryptocurrency Market Estimates and Forecasts, by Type (2020-2032) (USD Billion)

11.5.1.11.2 Rest of Middle East Cryptocurrency Market Estimates and Forecasts, by Process (2020-2032) (USD Billion)

11.5.1.11.3 Rest of Middle East Cryptocurrency Market Estimates and Forecasts, by Component (2020-2032) (USD Billion)

11.5.1.11.4 Rest of Middle East Cryptocurrency Market Estimates and Forecasts, by End-Use (2020-2032) (USD Billion)

11.5.2 Africa

11.5.2.1 Trends Analysis

11.5.2.2 Africa Cryptocurrency Market Estimates and Forecasts, by Country (2020-2032) (USD Billion)

11.5.2.3 Africa Cryptocurrency Market Estimates and Forecasts, by Type (2020-2032) (USD Billion)  

11.5.2.4 Africa Cryptocurrency Market Estimates and Forecasts, by Process (2020-2032) (USD Billion)

11.5.2.5 Africa Cryptocurrency Market Estimates and Forecasts, by Component (2020-2032) (USD Billion)

11.5.2.6 Africa Cryptocurrency Market Estimates and Forecasts, by End-Use (2020-2032) (USD Billion)

11.5.2.7 South Africa

11.5.2.7.1 South Africa Cryptocurrency Market Estimates and Forecasts, by Type (2020-2032) (USD Billion)

11.5.2.7.2 South Africa Cryptocurrency Market Estimates and Forecasts, by Process (2020-2032) (USD Billion)

11.5.2.7.3 South Africa Cryptocurrency Market Estimates and Forecasts, by Component (2020-2032) (USD Billion)

11.5.2.7.4 South Africa Cryptocurrency Market Estimates and Forecasts, by End-Use (2020-2032) (USD Billion)

11.5.2.8 Nigeria

11.5.2.8.1 Nigeria Cryptocurrency Market Estimates and Forecasts, by Type (2020-2032) (USD Billion)

11.5.2.8.2 Nigeria Cryptocurrency Market Estimates and Forecasts, by Process (2020-2032) (USD Billion)

11.5.2.8.3 Nigeria Cryptocurrency Market Estimates and Forecasts, by Component (2020-2032) (USD Billion)

11.5.2.8.4 Nigeria Cryptocurrency Market Estimates and Forecasts, by End-Use (2020-2032) (USD Billion)

11.5.2.9 Rest of Africa

11.5.2.9.1 Rest of Africa Cryptocurrency Market Estimates and Forecasts, by Type (2020-2032) (USD Billion)

11.5.2.9.2 Rest of Africa Cryptocurrency Market Estimates and Forecasts, by Process (2020-2032) (USD Billion)

11.5.2.9.3 Rest of Africa Cryptocurrency Market Estimates and Forecasts, by Component (2020-2032) (USD Billion)

11.5.2.9.4 Rest of Africa Cryptocurrency Market Estimates and Forecasts, by End-Use (2020-2032) (USD Billion)

11.6 Latin America

11.6.1 Trends Analysis

11.6.2 Latin America Cryptocurrency Market Estimates and Forecasts, by Country (2020-2032) (USD Billion)

11.6.3 Latin America Cryptocurrency Market Estimates and Forecasts, by Type (2020-2032) (USD Billion)  

11.6.4 Latin America Cryptocurrency Market Estimates and Forecasts, by Process (2020-2032) (USD Billion)

11.6.5 Latin America Cryptocurrency Market Estimates and Forecasts, by Component (2020-2032) (USD Billion)

11.6.6 Latin America Cryptocurrency Market Estimates and Forecasts, by End-Use (2020-2032) (USD Billion)

11.6.7 Brazil

11.6.7.1 Brazil Cryptocurrency Market Estimates and Forecasts, by Type (2020-2032) (USD Billion)

11.6.7.2 Brazil Cryptocurrency Market Estimates and Forecasts, by Process (2020-2032) (USD Billion)

11.6.7.3 Brazil Cryptocurrency Market Estimates and Forecasts, by Component (2020-2032) (USD Billion)

11.6.7.4 Brazil Cryptocurrency Market Estimates and Forecasts, by End-Use (2020-2032) (USD Billion)

11.6.8 Argentina

11.6.8.1 Argentina Cryptocurrency Market Estimates and Forecasts, by Type (2020-2032) (USD Billion)

11.6.8.2 Argentina Cryptocurrency Market Estimates and Forecasts, by Process (2020-2032) (USD Billion)

11.6.8.3 Argentina Cryptocurrency Market Estimates and Forecasts, by Component (2020-2032) (USD Billion)

11.6.8.4 Argentina Cryptocurrency Market Estimates and Forecasts, by End-Use (2020-2032) (USD Billion)

11.6.9 Colombia

11.6.9.1 Colombia Cryptocurrency Market Estimates and Forecasts, by Type (2020-2032) (USD Billion)

11.6.9.2 Colombia Cryptocurrency Market Estimates and Forecasts, by Process (2020-2032) (USD Billion)

11.6.9.3 Colombia Cryptocurrency Market Estimates and Forecasts, by Component (2020-2032) (USD Billion)

11.6.9.4 Colombia Cryptocurrency Market Estimates and Forecasts, by End-Use (2020-2032) (USD Billion)

11.6.10 Rest of Latin America

11.6.10.1 Rest of Latin America Cryptocurrency Market Estimates and Forecasts, by Type (2020-2032) (USD Billion)

11.6.10.2 Rest of Latin America Cryptocurrency Market Estimates and Forecasts, by Process (2020-2032) (USD Billion)

11.6.10.3 Rest of Latin America Cryptocurrency Market Estimates and Forecasts, by Component (2020-2032) (USD Billion)

11.6.10.4 Rest of Latin America Cryptocurrency Market Estimates and Forecasts, by End-Use (2020-2032) (USD Billion)

12. Company Profiles

12.1 Amazon Web Services (AWS)

               12.1.1 Company Overview

12.1.2 Financial

12.1.3 Products/ Services Offered

12.1.4 SWOT Analysis

12.2 Microsoft

             12.2.1 Company Overview

12.2.2 Financial

12.2.3 Products/ Services Offered

12.2.4 SWOT Analysis

12.3 Google Cloud Platform

12.3.1 Company Overview

12.3.2 Financial

12.3.3 Products/ Services Offered

12.3.4 SWOT Analysis

12.4 IBM

12.4.1 Company Overview

12.4.2 Financial

12.4.3 Products/ Services Offered

12.4.4 SWOT Analysis

12.5 Palo Alto Networks

             12.5.1 Company Overview

12.5.2 Financial

12.5.3 Products/ Services Offered

12.5.4 SWOT Analysis

12.6 Cisco

               12.6.1 Company Overview

12.6.2 Financial

12.6.3 Products/ Services Offered

12.6.4 SWOT Analysis

12.7 Check Point Software Technologies

             12.7.1 Company Overview

12.7.2 Financial

12.7.3 Products/ Services Offered

12.7.4 SWOT Analysis

12.8 Fortinet

            12.8.1 Company Overview

12.8.2 Financial

12.8.3 Products/ Services Offered

12.8.4 SWOT Analysis

12.9 McAfee

12.9.1 Company Overview

12.9.2 Financial

12.9.3 Products/ Services Offered

12.9.4 SWOT Analysis

12.10 NortonLifeLock

               12.10.1 Company Overview

12.10.2 Financial

12.10.3 Products/ Services Offered

12.10.4 SWOT Analysis

13. Use Cases and Best Practices

14. Conclusion

An accurate research report requires proper strategizing as well as implementation. There are multiple factors involved in the completion of good and accurate research report and selecting the best methodology to compete the research is the toughest part. Since the research reports we provide play a crucial role in any company’s decision-making process, therefore we at SNS Insider always believe that we should choose the best method which gives us results closer to reality. This allows us to reach at a stage wherein we can provide our clients best and accurate investment to output ratio.

Each report that we prepare takes a timeframe of 350-400 business hours for production. Starting from the selection of titles through a couple of in-depth brain storming session to the final QC process before uploading our titles on our website we dedicate around 350 working hours. The titles are selected based on their current market cap and the foreseen CAGR and growth.


The 5 steps process:

Step 1: Secondary Research:

Secondary Research or Desk Research is as the name suggests is a research process wherein, we collect data through the readily available information. In this process we use various paid and unpaid databases which our team has access to and gather data through the same. This includes examining of listed companies’ annual reports, Journals, SEC filling etc. Apart from this our team has access to various associations across the globe across different industries. Lastly, we have exchange relationships with various university as well as individual libraries.

Secondary Research

Step 2: Primary Research

When we talk about primary research, it is a type of study in which the researchers collect relevant data samples directly, rather than relying on previously collected data.  This type of research is focused on gaining content specific facts that can be sued to solve specific problems. Since the collected data is fresh and first hand therefore it makes the study more accurate and genuine.

We at SNS Insider have divided Primary Research into 2 parts.

Part 1 wherein we interview the KOLs of major players as well as the upcoming ones across various geographic regions. This allows us to have their view over the market scenario and acts as an important tool to come closer to the accurate market numbers. As many as 45 paid and unpaid primary interviews are taken from both the demand and supply side of the industry to make sure we land at an accurate judgement and analysis of the market.

This step involves the triangulation of data wherein our team analyses the interview transcripts, online survey responses and observation of on filed participants. The below mentioned chart should give a better understanding of the part 1 of the primary interview.

Primary Research

Part 2: In this part of primary research the data collected via secondary research and the part 1 of the primary research is validated with the interviews from individual consultants and subject matter experts.

Consultants are those set of people who have at least 12 years of experience and expertise within the industry whereas Subject Matter Experts are those with at least 15 years of experience behind their back within the same space. The data with the help of two main processes i.e., FGDs (Focused Group Discussions) and IDs (Individual Discussions). This gives us a 3rd party nonbiased primary view of the market scenario making it a more dependable one while collation of the data pointers.

Step 3: Data Bank Validation

Once all the information is collected via primary and secondary sources, we run that information for data validation. At our intelligence centre our research heads track a lot of information related to the market which includes the quarterly reports, the daily stock prices, and other relevant information. Our data bank server gets updated every fortnight and that is how the information which we collected using our primary and secondary information is revalidated in real time.

Data Bank Validation

Step 4: QA/QC Process

After all the data collection and validation our team does a final level of quality check and quality assurance to get rid of any unwanted or undesired mistakes. This might include but not limited to getting rid of the any typos, duplication of numbers or missing of any important information. The people involved in this process include technical content writers, research heads and graphics people. Once this process is completed the title gets uploader on our platform for our clients to read it.

Step 5: Final QC/QA Process:

This is the last process and comes when the client has ordered the study. In this process a final QA/QC is done before the study is emailed to the client. Since we believe in giving our clients a good experience of our research studies, therefore, to make sure that we do not lack at our end in any way humanly possible we do a final round of quality check and then dispatch the study to the client.

Key Segments:


By Type

  • Bitcoin

  • Ethereum

  • Bitcoin Cash

  • Ripple

  • Litecoin

  • Dashcoin

  • Others

 By Component

  • Hardware

  • Software

 By Process

  • Mining

  • Transaction

By Application

  • Trading

  • Remittance

  • Payment

  • Others

Request for Segment Customization as per your Business Requirement: Segment Customization Request

REGIONAL COVERAGE:

North America

  • US

  • Canada

  • Mexico

Europe

  • Eastern Europe

    • Poland

    • Romania

    • Hungary

    • Turkey

    • Rest of Eastern Europe

  • Western Europe

    • Germany

    • France

    • UK

    • Italy

    • Spain

    • Netherlands

    • Switzerland

    • Austria

    • Rest of Western Europe

Asia Pacific

  • China

  • India

  • Japan

  • South Korea

  • Vietnam

  • Singapore

  • Australia

  • Rest of Asia Pacific

Middle East & Africa

  • Middle East

    • UAE

    • Egypt

    • Saudi Arabia

    • Qatar

    • Rest of the Middle East

  • Africa

    • Nigeria

    • South Africa

    • Rest of Africa

Latin America

  • Brazil

  • Argentina

  • Colombia

  • Rest of Latin America

Request for Country Level Research Report: Country Level Customization Request

Available Customization

With the given market data, SNS Insider offers customization as per the company’s specific needs. The following customization options are available for the report:

  • Product Analysis

  • Criss-Cross segment analysis (e.g. Product X Application)

  • Product Matrix which gives a detailed comparison of product portfolio of each company

  • Geographic Analysis

  • Additional countries in any of the regions

  • Company Information

  • Detailed analysis and profiling of additional market players (Up to five)


  •            5000 (33% Discount)


  •            8950 (40% Discount)


  •            3050 (23% Discount)

Start a Conversation

Hi! Click one of our member below to chat on Phone