Cryogenic Tanks Market Size was valued at USD 6.78 Billion in 2023 and is expected to reach USD 10.61 Billion by 2032 and grow at a CAGR of 5.17% over the forecast period 2024-2032.
The Cryogenic Tanks Market is witnessing strong growth as demand for liquefied gases is increasing in industries like healthcare, energy, and manufacturing. The tanks are necessary for the storage and transportation of gases such as LNG, liquid nitrogen, oxygen, and hydrogen at extremely low temperatures. Advances in insulation and material strength are improving efficiency and safety. The demand is fueled by higher LNG consumption, growing industrial uses, and increasing medical oxygen demand.
The Cryogenic Tanks Market was valued at USD 1.08 Billion in 2023 and is expected to reach USD 1.87 Billion by 2032, growing at a CAGR of 6.36% from 2024 to 2032. The U.S. Cryogenic Tanks Market is growing on account of growing demand for liquefied gases in industries including healthcare, energy, and manufacturing. The increased use of LNG as a less polluting fuel, as well as the augmented demand for industrial gases and medical oxygen, is boosting market growth. The well-established oil & gas infrastructure in the country and improvements in technology related to cryogenic storage strengthen market opportunities. Government policies that encourage clean energy adoption also enhance the demand for LNG storage.
Key Drivers:
Increasing Adoption of LNG as a Cleaner Alternative to Conventional Fossil Fuels Drives Cryogenic Tanks Market Growth
The increasing trend towards liquefied natural gas (LNG) as a cleaner fuel is largely fueling demand for cryogenic tanks. With strict carbon emission policies and a growing emphasis on sustainable energy solutions, industries are investing in LNG infrastructure, increasing storage and transportation needs. The U.S. and other developed countries are increasing LNG export terminals, further fueling the cryogenic tank market. Also, industries such as power generation, shipping, and transportation are embracing LNG to lower their carbon footprint. This increased use of LNG requires cutting-edge cryogenic storage solutions, paving the way for technological innovations in tank design, insulation, and security.
Restraint:
High Initial Investment and Maintenance Costs Hinder the Expansion of the Cryogenic Tanks Market Globally
The large capital outlay needed for cryogenic tank production, installation, and upkeep is a significant limitation. The equipment materials and insulation technologies required to ensure ultra-low temperatures contribute substantially to the costs of production. Regulatory requirements for cryogenic storage safety compliance, which are stringent, also contribute to operational costs. Sectors with limited budgets, particularly in developing countries, can be challenged to implement cryogenic tanks on a large scale. Maintenance and regular inspections are also expensive, as maintaining structural integrity and temperature stability requires constant monitoring. These aspects make it difficult for small and medium-sized enterprises (SMEs) to enter the market.
Opportunity:
Technological Advancements in Cryogenic Storage and Insulation Materials Create Growth Potential for the Cryogenic Tanks Market
Ongoing innovations in cryogenic insulation, light materials, and energy-saving designs are creating new avenues for the growth of the cryogenic tanks market. Developments like vacuum-insulated storage tanks, composite materials, and Internet of Things-enabled temperature sensing enhance performance, safety, and cost-effectiveness. Moreover, research into hydrogen storage technologies for fuel cell usage is fuelling demand for future cryogenic tanks. As businesses increasingly focus on energy efficiency and sustainability, new cryogenic storage technologies with reduced energy use and longer lifespan are gaining momentum. Businesses investing in intelligent cryogenic systems and automated monitoring will reap rewards from growing applications in the healthcare, aerospace, and clean energy industries.
Challenge:
Stringent Government Regulations and Safety Compliance Requirements Pose Operational Challenges in the Cryogenic Tanks Market
The market for cryogenic tanks is stringently regulated because of safety issues related to liquefied gas storage and transportation at very low temperatures. Governments impose stringent compliance requirements on tank design, material, and procedural operations to avert dangers like leaks, explosions, and pressure failures. Complying with these rigid certification demands, such as ASME, DOT, and ISO, adds expenses and prolongs production cycles. Furthermore, changing environmental laws regarding greenhouse gas emissions affect LNG transportation and storage. Firms have to spend on ongoing compliance upgrades and safety improvements, which makes market entry and growth challenging for new entrants and small firms in the sector.
By Cryogenic Liquid
The Liquid Natural Gas industry dominates the market for cryogenic tanks with a 32.25% share in revenues by 2023, buoyed by global growth in demand for clean energy and enhanced adoption of LNG as fuel in power production, transport, and industry usage. Organizations such as Chart Industries and Linde Plc are putting capital in high-tech storage and transportation units for LNG and huge capacity terminals for LNG storage. In 2023, Chart Industries introduced its HLNG vehicle tank to enable heavy-duty trucking for LNG. U.S. and European LNG export facility expansion, as well as government incentives for low-carbon fuel, is boosting demand for cryogenic storage systems, solidifying market growth.
Liquefied Nitrogen is growing with the highest CAGR of 5.96% due to growing applications across healthcare, pharmaceuticals, and food processing industries. The growing need for cryopreservation, storage of medical gas, and freezing of food has been driving the market growth. Advanced cryogenic storage tanks were introduced by Air Products and Chemicals Inc. for biomedical and lab use recently, improving efficiency and reliability. High-capacity tanks for industrial distribution of gas, specifically nitrogen tanks, were launched by Cryolor as well. The increasing emphasis on R&D in biotechnology, semiconductor cooling, and aerospace further drives demand for high-performance cryogenic tanks, further driving the liquefied nitrogen segment's fast market growth.
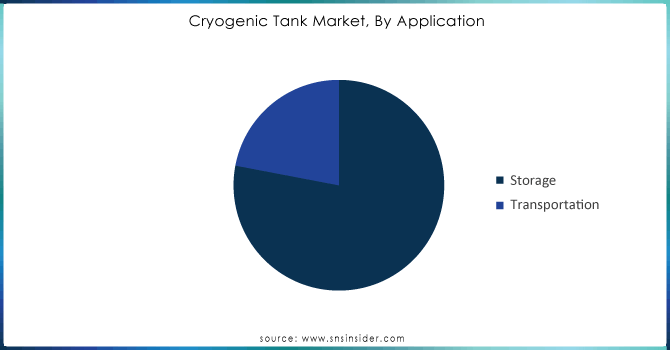
By Application
The Storage segment accounted for the highest revenue share of 63.94% in 2023 due to the increasing demand for LNG, liquid nitrogen, oxygen, and hydrogen in various industries. The growing use of large-scale cryogenic storage tanks in healthcare, energy, and manufacturing has driven market growth. Players like Chart Industries launched sophisticated vacuum-insulated cryogenic storage tanks to improve efficiency and minimize energy losses. INOX India also increased the production of cryogenic tanks to address increasing storage requirements for LNG. The increasing emphasis on clean energy and storage of medical oxygen has further boosted this segment, which has become the pillar of the cryogenic tank market globally.
The Transportation segment is also expected to develop at the highest CAGR of 5.71% with growing demand for LNG and hydrogen transport in energy and industrial applications. With growing global LNG commerce, players such as Cryolor and Linde have launched high-capacity cryogenic trailers to improve efficiency in long-distance gas transport. Air Products also rolled out hydrogen transport tanks to meet the expanding hydrogen economy. Growing applications of cryogenic ISO containers and on-site cryogenic solutions for medical oxygen and industrial gas supply further increase this segment. As industries switch to low-carbon energy, demand for cryogenic transport solutions will keep increasing market growth at a faster pace.
Need any customization research on Cryogenic Tank Market - Enquiry Now
By End-Use
Manufacturing dominated the market for cryogenic tanks in 2023, accounting for 34.46% of the revenues, supported by the growing usage of liquefied gases like nitrogen, oxygen, and argon in industry applications. The growing use of metal fabrication, chemical processing, and electronic manufacturing has also spurred the demand for effective cryogenic storage technology. Players such as Chart Industries and Air Products have introduced next-generation cryogenic tanks with improved insulation technology for industrial gas storage. Cryolor has also introduced high-capacity cryogenic tanks to address manufacturing requirements. With industrial automation increasing, the demand for high-purity cryogenic gases is driving investment in next-generation cryogenic storage solutions for precision manufacturing.
The Healthcare industry is seeing the highest growth in the market for cryogenic tanks at a CAGR of 6.08%, due to increasing demand for medical oxygen and liquid nitrogen for cryopreservation and medical procedures. Demand for medical-grade oxygen storage picked up speed during the COVID-19 pandemic, and companies such as Linde and Air Liquide began increasing their cryogenic tank offerings. Portable cryogenic tanks for hospitals were introduced by INOX India, increasing on-site oxygen availability. Technological advances in cryogenic biobanking and regenerative medicine are additionally driving market expansion.
By Raw Material
The Steel segment led the Cryogenic Tanks Market in 2023 with the highest revenue share because of its strength, durability, and resistance to harsh temperatures. Top players such as Chart Industries and Linde Plc have launched sophisticated cryogenic storage products made of stainless steel to address the increasing demand for LNG, medical gases, and industrial processes. In 2023, Cryofab introduced an upgraded stainless steel cryogenic tank line with enhanced insulation performance. The dominance of the steel segment is fueled by its widespread application in massive LNG storage and transportation, in line with the increasing global energy demand and medical gas distribution networks.
The Nickel Alloy segment is expected to achieve the highest CAGR in the Cryogenic Tanks Market through the forecast period due to its higher corrosion resistance and thermal stability. Air Products and VRV S.p.A. are among the companies that have created advanced nickel alloy-based cryogenic tanks for harsh environments, such as hydrogen storage and aerospace. Air Liquide launched in 2024 high-performance nickel alloy cryogenic tanks, specifically designed for storing liquid hydrogen and backing the worldwide hydrogen economy. The high-speed uptake of nickel alloy materials is driven by the growth in investment in hydrogen infrastructure and the move toward clean energy solutions.
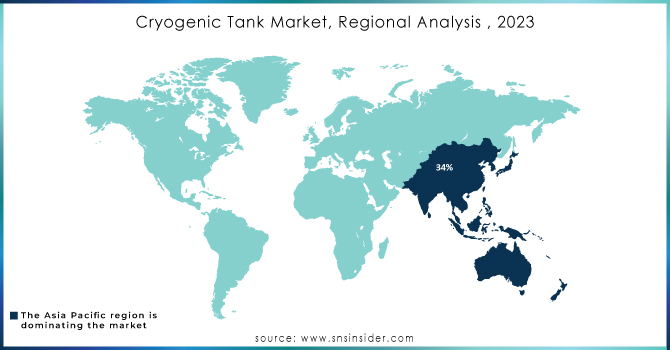
The Asia Pacific market leads the cryogenic tanks industry, with a share of 34.26% of total revenue in 2023 due to the rising use of LNG, medical gases, and industrial gases. Nations such as China, India, and Japan are experiencing fast-paced industrial growth, healthcare development, and clean energy uptake, increasing demand for cryogenic storage products. Market leaders like INOX India and CIMC Enric have introduced high-capacity LNG storage tanks to cater to increasing energy demand. Linde and Air Liquide have also increased their cryogenic gas manufacturing facilities to fulfill increasing demand. Continuous investment in LNG terminals, hydrogen infrastructure, and medical gas storage further reinforces the region's leadership in the cryogenic tanks market.
The North American cryogenic tanks market is anticipated to grow at a CAGR of 6.06% over the forecast period, driven by rising LNG production, hydrogen economy development, and growth in the healthcare sector. The U.S. and Canada are spending significantly on LNG export terminals and cryogenic transport solutions to aid clean energy transition. Players such as Chart Industries and Air Products have developed next-generation vacuum-insulated cryogenic tanks to improve LNG and hydrogen storage efficiency. In 2023, Air Liquide commissioned a big liquid hydrogen storage facility to enable aerospace and industrial applications. The high emphasis on decarbonization, adoption of clean fuels, and cryogenic technology is driving the region's market growth.
ISISAN A.Ş. – (Cryogenic Storage Tanks, Vacuum Insulated Piping)
Cryolor – (Cryogenic Transport Trailers, Vacuum Insulated Cryogenic Storage Tanks)
FIBA Technologies, Inc. – (Cryogenic ISO Containers, Tube Trailers)
Cryofab, Inc. – (Cryogenic Dewars, Custom Cryogenic Tanks)
SURETANK – (Cryogenic Offshore Tanks, ISO Tank Containers)
Super Cryogenic Systems Pvt Ltd. – (Liquid Nitrogen Containers, Cryogenic Freezers)
Chart Industries – (LNG Storage Tanks, Cryogenic MicroBulk Systems)
Wessington Cryogenics – (Cryogenic Pressure Vessels, Liquid Helium Storage Tanks)
Eden Cryogenic LLC – (Vacuum Insulated Cryogenic Tanks, Cryogenic Pump Systems)
INOX India Limited – (LNG Transport Tanks, Cryogenic Bulk Storage Tanks)
AIR WATER INC – (Cryogenic Liquid Cylinders, Industrial Gas Storage Tanks)
Linde PLC – (Cryogenic Bulk Tanks, Hydrogen Storage Solutions)
Air Products and Chemicals, Inc. – (Cryogenic Tank Trailers, Liquid Nitrogen Generators)
April 2023 – Chart Industries introduced the "Cryo-Vantage" series, an advanced cryogenic storage solution that improves efficiency in liquefied gases like LNG, oxygen, and hydrogen. This new series enhances thermal insulation, reducing boil-off rates significantly.
September 2023 – Linde unveiled a cryogenic carbon capture tank system that integrates with industrial processes to capture CO₂ emissions using cryogenic temperatures, improving sustainability.
| Report Attributes | Details |
|---|---|
| Market Size in 2023 | USD 6.78 Billion |
| Market Size by 2032 | USD 10.61 Billion |
| CAGR | CAGR of 5.17% From 2024 to 2032 |
| Base Year | 2023 |
| Forecast Period | 2024-2032 |
| Historical Data | 2020-2022 |
| Report Scope & Coverage | Market Size, Segments Analysis, Competitive Landscape, Regional Analysis, DROC & SWOT Analysis, Forecast Outlook |
| Key Segments | • By Cryogenic Liquid - (Liquefied Nitrogen, Liquid Natural Gas (LNG), Liquid Hydrogen, Liquid Oxygen, Others) • By Application - (Storage, Transportation) • By End Use - (Manufacturing, Healthcare, Food & Beverages, Others) • By Material – (Steel, Nickel Alloy, Aluminum Alloy) |
| Regional Analysis/Coverage | North America (US, Canada, Mexico), Europe (Eastern Europe [Poland, Romania, Hungary, Turkey, Rest of Eastern Europe] Western Europe] Germany, France, UK, Italy, Spain, Netherlands, Switzerland, Austria, Rest of Western Europe]), Asia Pacific (China, India, Japan, South Korea, Vietnam, Singapore, Australia, Rest of Asia Pacific), Middle East & Africa (Middle East [UAE, Egypt, Saudi Arabia, Qatar, Rest of Middle East], Africa [Nigeria, South Africa, Rest of Africa], Latin America (Brazil, Argentina, Colombia, Rest of Latin America) |
| Company Profiles | ISISAN A.Ş., Cryolor, FIBA Technologies, Inc., Cryofab, Inc., SURETANK, Super Cryogenic Systems Pvt Ltd., Chart Industries, Wessington Cryogenics, Eden Cryogenic LLC, INOX India Limited, AIR WATER INC, Linde PLC, Air Products and Chemicals, Inc. |
Ans: The Cryogenic Tanks Market is expected to grow at a CAGR of 5.17% during 2024-2032.
Ans: The Cryogenic Tanks Market size was USD 6.78 Billion in 2023 and is expected to Reach USD 10.61 Billion by 2032.
Ans: The major growth factor of the Cryogenic Tanks Market is the rising demand for LNG, industrial gases, and medical oxygen across various industries.
Ans: The Liquid Natural Gas segment dominated the Cryogenic Tanks Market.
Ans: Asia Pacific dominated the Cryogenic Tanks Market in 2023.
1. Introduction
1.1 Market Definition
1.2 Scope (Inclusion and Exclusions)
1.3 Research Assumptions
2. Executive Summary
2.1 Market Overview
2.2 Regional Synopsis
2.3 Competitive Summary
3. Research Methodology
3.1 Top-Down Approach
3.2 Bottom-up Approach
3.3. Data Validation
3.4 Primary Interviews
4. Market Dynamics Impact Analysis
4.1 Market Driving Factors Analysis
4.1.1 Drivers
4.1.2 Restraints
4.1.3 Opportunities
4.1.4 Challenges
4.2 PESTLE Analysis
4.3 Porter’s Five Forces Model
5. Statistical Insights and Trends Reporting
5.1 Industry Trends & Innovations
5.2 Key Mergers & Acquisitions
5.3 Production Capacity & Utilization Rate
5.4 Energy Consumption Analysis
6. Competitive Landscape
6.1 List of Major Companies, By Region
6.2 Market Share Analysis, By Region
6.3 Product Benchmarking
6.3.1 Product specifications and features
6.3.2 Pricing
6.4 Strategic Initiatives
6.4.1 Marketing and promotional activities
6.4.2 Distribution and Supply Chain Strategies
6.4.3 Expansion plans and new product launches
6.4.4 Strategic partnerships and collaborations
6.5 Technological Advancements
6.6 Market Positioning and Branding
7. Cryogenic Tanks Market Segmentation, By Cryogenic Liquid
7.1 Chapter Overview
7.2 Liquefied Nitrogen
7.2.1 Liquefied Nitrogen Market Trends Analysis (2020-2032)
7.2.2 Liquefied Nitrogen Market Size Estimates and Forecasts to 2032 (USD Billion)
7.3 Liquid Natural Gas (LNG)
7.3.1 Liquid Natural Gas (LNG) Market Trends Analysis (2020-2032)
7.3.2 Liquid Natural Gas (LNG) Market Size Estimates and Forecasts to 2032 (USD Billion)
7.4 Liquid Hydrogen
7.4.1 Liquid Hydrogen Market Trends Analysis (2020-2032)
7.4.2 Liquid Hydrogen Market Size Estimates and Forecasts to 2032 (USD Billion)
7.5 Liquid Oxygen
7.5.1 Liquid Oxygen Market Trends Analysis (2020-2032)
7.5.2 Liquid Oxygen Market Size Estimates and Forecasts to 2032 (USD Billion)
7.6 Others
7.6.1 Others Market Trends Analysis (2020-2032)
7.6.2 Others Market Size Estimates and Forecasts to 2032 (USD Billion)
8. Cryogenic Tanks Market Segmentation, By Application
8.1 Chapter Overview
8.2 Storage
8.2.1 Storage Market Trends Analysis (2020-2032)
8.2.2 Storage Market Size Estimates and Forecasts to 2032 (USD Billion)
8.3 Transportation
8.3.1 Transportation Market Trends Analysis (2020-2032)
8.3.2 Transportation Market Size Estimates and Forecasts to 2032 (USD Billion)
9. Cryogenic Tanks Market Segmentation, By End Use
9.1 Chapter Overview
9.2 Manufacturing
9.2.1 Manufacturing Market Trends Analysis (2020-2032)
9.2.2 Manufacturing Market Size Estimates and Forecasts to 2032 (USD Billion)
9.3 Healthcare
9.3.1 Healthcare Market Trends Analysis (2020-2032)
9.3.2 Healthcare Market Size Estimates and Forecasts to 2032 (USD Billion)
9.4 Food & Beverages
9.4.1 Food & Beverages Market Trends Analysis (2020-2032)
9.4.2 Food & Beverages Market Size Estimates and Forecasts to 2032 (USD Billion)
9.5 Others
9.5.1 Others Market Trends Analysis (2020-2032)
9.5.2 Others Market Size Estimates and Forecasts to 2032 (USD Billion)
10. Cryogenic Tanks Market Segmentation, By Raw Material
10.1 Chapter Overview
10.2 steel
10.2.1 Steel Market Trends Analysis (2020-2032)
10.2.2 Steel Market Size Estimates and Forecasts to 2032 (USD Billion)
10.3 Nickel Alloy
10.3.1 Nickel Alloy Market Trends Analysis (2020-2032)
10.3.2 Nickel Alloy Market Size Estimates and Forecasts to 2032 (USD Billion)
10.4 Aluminum Alloy
10.4.1 Aluminum Alloy Market Trends Analysis (2020-2032)
10.4.2 Aluminum Alloy Market Size Estimates and Forecasts to 2032 (USD Billion)
11. Regional Analysis
11.1 Chapter Overview
11.2 North America
11.2.1 Trends Analysis
11.2.2 North America Cryogenic Tanks Market Estimates and Forecasts, by Country (2020-2032) (USD Billion)
11.2.3 North America Cryogenic Tanks Market Estimates and Forecasts, By Cryogenic Liquid (2020-2032) (USD Billion)
11.2.4 North America Cryogenic Tanks Market Estimates and Forecasts, By Application (2020-2032) (USD Billion)
11.2.5 North America Cryogenic Tanks Market Estimates and Forecasts, By End Use (2020-2032) (USD Billion)
11.2.6 North America Cryogenic Tanks Market Estimates and Forecasts, By Raw Material(2020-2032) (USD Billion)
11.2.7 USA
11.2.7.1 USA Cryogenic Tanks Market Estimates and Forecasts, By Cryogenic Liquid (2020-2032) (USD Billion)
11.2.7.2 USA Cryogenic Tanks Market Estimates and Forecasts, By Application (2020-2032) (USD Billion)
11.2.7.3 USA Cryogenic Tanks Market Estimates and Forecasts, By End Use (2020-2032) (USD Billion)
11.2.7.4 USA Cryogenic Tanks Market Estimates and Forecasts, By Raw Material(2020-2032) (USD Billion)
11.2.8 Canada
11.2.8.1 Canada Cryogenic Tanks Market Estimates and Forecasts, By Cryogenic Liquid (2020-2032) (USD Billion)
11.2.8.2 Canada Cryogenic Tanks Market Estimates and Forecasts, By Application (2020-2032) (USD Billion)
11.2.8.3 Canada Cryogenic Tanks Market Estimates and Forecasts, By End Use (2020-2032) (USD Billion)
11.2.8.4 Canada Cryogenic Tanks Market Estimates and Forecasts, By Raw Material (2020-2032) (USD Billion)
11.2.9 Mexico
11.2.9.1 Mexico Cryogenic Tanks Market Estimates and Forecasts, By Cryogenic Liquid (2020-2032) (USD Billion)
11.2.9.2 Mexico Cryogenic Tanks Market Estimates and Forecasts, By Application (2020-2032) (USD Billion)
11.2.9.3 Mexico Cryogenic Tanks Market Estimates and Forecasts, By End Use (2020-2032) (USD Billion)
11.2.9.4 Mexico Cryogenic Tanks Market Estimates and Forecasts, By Raw Material (2020-2032) (USD Billion)
11.3 Europe
11.3.1 Eastern Europe
11.3.1.1 Trends Analysis
11.3.1.2 Eastern Europe Cryogenic Tanks Market Estimates and Forecasts, by Country (2020-2032) (USD Billion)
11.3.1.3 Eastern Europe Cryogenic Tanks Market Estimates and Forecasts, By Cryogenic Liquid (2020-2032) (USD Billion)
11.3.1.4 Eastern Europe Cryogenic Tanks Market Estimates and Forecasts, By Application (2020-2032) (USD Billion)
11.3.1.5 Eastern Europe Cryogenic Tanks Market Estimates and Forecasts, By End Use (2020-2032) (USD Billion)
11.3.1.6 Eastern Europe Cryogenic Tanks Market Estimates and Forecasts, By Raw Material(2020-2032) (USD Billion)
11.3.1.7 Poland
11.3.1.7.1 Poland Cryogenic Tanks Market Estimates and Forecasts, By Cryogenic Liquid (2020-2032) (USD Billion)
11.3.1.7.2 Poland Cryogenic Tanks Market Estimates and Forecasts, By Application (2020-2032) (USD Billion)
11.3.1.7.3 Poland Cryogenic Tanks Market Estimates and Forecasts, By End Use (2020-2032) (USD Billion)
11.3.1.7.4 Poland Cryogenic Tanks Market Estimates and Forecasts, By Raw Material(2020-2032) (USD Billion)
11.3.1.8 Romania
11.3.1.8.1 Romania Cryogenic Tanks Market Estimates and Forecasts, By Cryogenic Liquid (2020-2032) (USD Billion)
11.3.1.8.2 Romania Cryogenic Tanks Market Estimates and Forecasts, By Application (2020-2032) (USD Billion)
11.3.1.8.3 Romania Cryogenic Tanks Market Estimates and Forecasts, By End Use (2020-2032) (USD Billion)
11.3.1.8.4 Romania Cryogenic Tanks Market Estimates and Forecasts, By Raw Material (2020-2032) (USD Billion)
11.3.1.9 Hungary
11.3.1.9.1 Hungary Cryogenic Tanks Market Estimates and Forecasts, By Cryogenic Liquid (2020-2032) (USD Billion)
11.3.1.9.2 Hungary Cryogenic Tanks Market Estimates and Forecasts, By Application (2020-2032) (USD Billion)
11.3.1.9.3 Hungary Cryogenic Tanks Market Estimates and Forecasts, By End Use (2020-2032) (USD Billion)
11.3.1.9.4 Hungary Cryogenic Tanks Market Estimates and Forecasts, By Raw Material (2020-2032) (USD Billion)
11.3.1.10 turkey
11.3.1.10.1 Turkey Cryogenic Tanks Market Estimates and Forecasts, By Cryogenic Liquid (2020-2032) (USD Billion)
11.3.1.10.2 Turkey Cryogenic Tanks Market Estimates and Forecasts, By Application (2020-2032) (USD Billion)
11.3.1.10.3 Turkey Cryogenic Tanks Market Estimates and Forecasts, By End Use (2020-2032) (USD Billion)
11.3.1.10.4 Turkey Cryogenic Tanks Market Estimates and Forecasts, By Raw Material (2020-2032) (USD Billion)
11.3.1.11 Rest of Eastern Europe
11.3.1.11.1 Rest of Eastern Europe Cryogenic Tanks Market Estimates and Forecasts, By Cryogenic Liquid (2020-2032) (USD Billion)
11.3.1.11.2 Rest of Eastern Europe Cryogenic Tanks Market Estimates and Forecasts, By Application (2020-2032) (USD Billion)
11.3.1.11.3 Rest of Eastern Europe Cryogenic Tanks Market Estimates and Forecasts, By End Use (2020-2032) (USD Billion)
11.3.1.11.4 Rest of Eastern Europe Cryogenic Tanks Market Estimates and Forecasts, By Raw Material (2020-2032) (USD Billion)
11.3.2 Western Europe
11.3.2.1 Trends Analysis
11.3.2.2 Western Europe Cryogenic Tanks Market Estimates and Forecasts, by Country (2020-2032) (USD Billion)
11.3.2.3 Western Europe Cryogenic Tanks Market Estimates and Forecasts, By Cryogenic Liquid (2020-2032) (USD Billion)
11.3.2.4 Western Europe Cryogenic Tanks Market Estimates and Forecasts, By Application (2020-2032) (USD Billion)
11.3.2.5 Western Europe Cryogenic Tanks Market Estimates and Forecasts, By End Use (2020-2032) (USD Billion)
11.3.2.6 Western Europe Cryogenic Tanks Market Estimates and Forecasts, By Raw Material (2020-2032) (USD Billion)
11.3.2.7 Germany
11.3.2.7.1 Germany Cryogenic Tanks Market Estimates and Forecasts, By Cryogenic Liquid (2020-2032) (USD Billion)
11.3.2.7.2 Germany Cryogenic Tanks Market Estimates and Forecasts, By Application (2020-2032) (USD Billion)
11.3.2.7.3 Germany Cryogenic Tanks Market Estimates and Forecasts, By End Use (2020-2032) (USD Billion)
11.3.2.7.4 Germany Cryogenic Tanks Market Estimates and Forecasts, By Raw Material (2020-2032) (USD Billion)
11.3.2.8 France
11.3.2.8.1 France Cryogenic Tanks Market Estimates and Forecasts, By Cryogenic Liquid (2020-2032) (USD Billion)
11.3.2.8.2 France Cryogenic Tanks Market Estimates and Forecasts, By Application (2020-2032) (USD Billion)
11.3.2.8.3 France Cryogenic Tanks Market Estimates and Forecasts, By End Use (2020-2032) (USD Billion)
11.3.2.8.4 France Cryogenic Tanks Market Estimates and Forecasts, By Raw Material (2020-2032) (USD Billion)
11.3.2.9 UK
11.3.2.9.1 UK Cryogenic Tanks Market Estimates and Forecasts, By Cryogenic Liquid (2020-2032) (USD Billion)
11.3.2.9.2 UK Cryogenic Tanks Market Estimates and Forecasts, By Application (2020-2032) (USD Billion)
11.3.2.9.3 UK Cryogenic Tanks Market Estimates and Forecasts, By End Use (2020-2032) (USD Billion)
11.3.2.9.4 UK Cryogenic Tanks Market Estimates and Forecasts, By Raw Material (2020-2032) (USD Billion)
11.3.2.10 Italy
11.3.2.10.1 Italy Cryogenic Tanks Market Estimates and Forecasts, By Cryogenic Liquid (2020-2032) (USD Billion)
11.3.2.10.2 Italy Cryogenic Tanks Market Estimates and Forecasts, By Application (2020-2032) (USD Billion)
11.3.2.10.3 Italy Cryogenic Tanks Market Estimates and Forecasts, By End Use (2020-2032) (USD Billion)
11.3.2.10.4 Italy Cryogenic Tanks Market Estimates and Forecasts, By Raw Material (2020-2032) (USD Billion)
11.3.2.11 Spain
11.3.2.11.1 Spain Cryogenic Tanks Market Estimates and Forecasts, By Cryogenic Liquid (2020-2032) (USD Billion)
11.3.2.11.2 Spain Cryogenic Tanks Market Estimates and Forecasts, By Application (2020-2032) (USD Billion)
11.3.2.11.3 Spain Cryogenic Tanks Market Estimates and Forecasts, By End Use (2020-2032) (USD Billion)
11.3.2.11.4 Spain Cryogenic Tanks Market Estimates and Forecasts, By Raw Material (2020-2032) (USD Billion)
11.3.2.12 Netherlands
11.3.2.12.1 Netherlands Cryogenic Tanks Market Estimates and Forecasts, By Cryogenic Liquid (2020-2032) (USD Billion)
11.3.2.12.2 Netherlands Cryogenic Tanks Market Estimates and Forecasts, By Application (2020-2032) (USD Billion)
11.3.2.12.3 Netherlands Cryogenic Tanks Market Estimates and Forecasts, By End Use (2020-2032) (USD Billion)
11.3.2.12.4 Netherlands Cryogenic Tanks Market Estimates and Forecasts, By Raw Material (2020-2032) (USD Billion)
11.3.2.13 Switzerland
11.3.2.13.1 Switzerland Cryogenic Tanks Market Estimates and Forecasts, By Cryogenic Liquid (2020-2032) (USD Billion)
11.3.2.13.2 Switzerland Cryogenic Tanks Market Estimates and Forecasts, By Application (2020-2032) (USD Billion)
11.3.2.13.3 Switzerland Cryogenic Tanks Market Estimates and Forecasts, By End Use (2020-2032) (USD Billion)
11.3.2.13.4 Switzerland Cryogenic Tanks Market Estimates and Forecasts, By Raw Material (2020-2032) (USD Billion)
11.3.2.14 Austria
11.3.2.14.1 Austria Cryogenic Tanks Market Estimates and Forecasts, By Cryogenic Liquid (2020-2032) (USD Billion)
11.3.2.14.2 Austria Cryogenic Tanks Market Estimates and Forecasts, By Application (2020-2032) (USD Billion)
11.3.2.14.3 Austria Cryogenic Tanks Market Estimates and Forecasts, By End Use (2020-2032) (USD Billion)
11.3.2.14.4 Austria Cryogenic Tanks Market Estimates and Forecasts, By Raw Material (2020-2032) (USD Billion)
11.3.2.15 Rest of Western Europe
11.3.2.15.1 Rest of Western Europe Cryogenic Tanks Market Estimates and Forecasts, By Cryogenic Liquid (2020-2032) (USD Billion)
11.3.2.15.2 Rest of Western Europe Cryogenic Tanks Market Estimates and Forecasts, By Application (2020-2032) (USD Billion)
11.3.2.15.3 Rest of Western Europe Cryogenic Tanks Market Estimates and Forecasts, By End Use (2020-2032) (USD Billion)
11.3.2.15.4 Rest of Western Europe Cryogenic Tanks Market Estimates and Forecasts, By Raw Material (2020-2032) (USD Billion)
11.4 Asia Pacific
11.4.1 Trends Analysis
11.4.2 Asia Pacific Cryogenic Tanks Market Estimates and Forecasts, by Country (2020-2032) (USD Billion)
11.4.3 Asia Pacific Cryogenic Tanks Market Estimates and Forecasts, By Cryogenic Liquid (2020-2032) (USD Billion)
11.4.4 Asia Pacific Cryogenic Tanks Market Estimates and Forecasts, By Application (2020-2032) (USD Billion)
11.4.5 Asia Pacific Cryogenic Tanks Market Estimates and Forecasts, By End Use (2020-2032) (USD Billion)
11.4.6 Asia Pacific Cryogenic Tanks Market Estimates and Forecasts, By Raw Material (2020-2032) (USD Billion)
11.4.7 China
11.4.7.1 China Cryogenic Tanks Market Estimates and Forecasts, By Cryogenic Liquid (2020-2032) (USD Billion)
11.4.7.2 China Cryogenic Tanks Market Estimates and Forecasts, By Application (2020-2032) (USD Billion)
11.4.7.3 China Cryogenic Tanks Market Estimates and Forecasts, By End Use (2020-2032) (USD Billion)
11.4.7.4 China Cryogenic Tanks Market Estimates and Forecasts, By Raw Material (2020-2032) (USD Billion)
11.4.8 India
11.4.8.1 India Cryogenic Tanks Market Estimates and Forecasts, By Cryogenic Liquid (2020-2032) (USD Billion)
11.4.8.2 India Cryogenic Tanks Market Estimates and Forecasts, By Application (2020-2032) (USD Billion)
11.4.8.3 India Cryogenic Tanks Market Estimates and Forecasts, By End Use (2020-2032) (USD Billion)
11.4.8.4 India Cryogenic Tanks Market Estimates and Forecasts, By Raw Material (2020-2032) (USD Billion)
11.4.9 japan
11.4.9.1 Japan Cryogenic Tanks Market Estimates and Forecasts, By Cryogenic Liquid (2020-2032) (USD Billion)
11.4.9.2 Japan Cryogenic Tanks Market Estimates and Forecasts, By Application (2020-2032) (USD Billion)
11.4.9.3 Japan Cryogenic Tanks Market Estimates and Forecasts, By End Use (2020-2032) (USD Billion)
11.4.9.4 Japan Cryogenic Tanks Market Estimates and Forecasts, By Raw Material (2020-2032) (USD Billion)
11.4.10 South Korea
11.4.10.1 South Korea Cryogenic Tanks Market Estimates and Forecasts, By Cryogenic Liquid (2020-2032) (USD Billion)
11.4.10.2 South Korea Cryogenic Tanks Market Estimates and Forecasts, By Application (2020-2032) (USD Billion)
11.4.10.3 South Korea Cryogenic Tanks Market Estimates and Forecasts, By End Use (2020-2032) (USD Billion)
11.4.10.4 South Korea Cryogenic Tanks Market Estimates and Forecasts, By Raw Material (2020-2032) (USD Billion)
11.4.11 Vietnam
11.4.11.1 Vietnam Cryogenic Tanks Market Estimates and Forecasts, By Cryogenic Liquid (2020-2032) (USD Billion)
11.4.11.2 Vietnam Cryogenic Tanks Market Estimates and Forecasts, By Application (2020-2032) (USD Billion)
11.4.11.3 Vietnam Cryogenic Tanks Market Estimates and Forecasts, By End Use (2020-2032) (USD Billion)
11.4.11.4 Vietnam Cryogenic Tanks Market Estimates and Forecasts, By Raw Material (2020-2032) (USD Billion)
11.4.12 Singapore
11.4.12.1 Singapore Cryogenic Tanks Market Estimates and Forecasts, By Cryogenic Liquid (2020-2032) (USD Billion)
11.4.12.2 Singapore Cryogenic Tanks Market Estimates and Forecasts, By Application (2020-2032) (USD Billion)
11.4.12.3 Singapore Cryogenic Tanks Market Estimates and Forecasts, By End Use (2020-2032) (USD Billion)
11.4.12.4 Singapore Cryogenic Tanks Market Estimates and Forecasts, By Raw Material (2020-2032) (USD Billion)
11.4.13 Australia
11.4.13.1 Australia Cryogenic Tanks Market Estimates and Forecasts, By Cryogenic Liquid (2020-2032) (USD Billion)
11.4.13.2 Australia Cryogenic Tanks Market Estimates and Forecasts, By Application (2020-2032) (USD Billion)
11.4.13.3 Australia Cryogenic Tanks Market Estimates and Forecasts, By End Use (2020-2032) (USD Billion)
11.4.13.4 Australia Cryogenic Tanks Market Estimates and Forecasts, By Raw Material (2020-2032) (USD Billion)
11.4.14 Rest of Asia Pacific
11.4.14.1 Rest of Asia Pacific Cryogenic Tanks Market Estimates and Forecasts, By Cryogenic Liquid (2020-2032) (USD Billion)
11.4.14.2 Rest of Asia Pacific Cryogenic Tanks Market Estimates and Forecasts, By Application (2020-2032) (USD Billion)
11.4.14.3 Rest of Asia Pacific Cryogenic Tanks Market Estimates and Forecasts, By End Use (2020-2032) (USD Billion)
11.4.14.4 Rest of Asia Pacific Cryogenic Tanks Market Estimates and Forecasts, By Raw Material (2020-2032) (USD Billion)
11.5 Middle East and Africa
11.5.1 Middle East
11.5.1.1 Trends Analysis
11.5.1.2 Middle East Cryogenic Tanks Market Estimates and Forecasts, by Country (2020-2032) (USD Billion)
11.5.1.3 Middle East Cryogenic Tanks Market Estimates and Forecasts, By Cryogenic Liquid (2020-2032) (USD Billion)
11.5.1.4 Middle East Cryogenic Tanks Market Estimates and Forecasts, By Application (2020-2032) (USD Billion)
11.5.1.5 Middle East Cryogenic Tanks Market Estimates and Forecasts, By End Use (2020-2032) (USD Billion)
11.5.1.6 Middle East Cryogenic Tanks Market Estimates and Forecasts, By Raw Material (2020-2032) (USD Billion)
11.5.1.7 UAE
11.5.1.7.1 UAE Cryogenic Tanks Market Estimates and Forecasts, By Cryogenic Liquid (2020-2032) (USD Billion)
11.5.1.7.2 UAE Cryogenic Tanks Market Estimates and Forecasts, By Application (2020-2032) (USD Billion)
11.5.1.7.3 UAE Cryogenic Tanks Market Estimates and Forecasts, By End Use (2020-2032) (USD Billion)
11.5.1.7.4 UAE Cryogenic Tanks Market Estimates and Forecasts, By Raw Material (2020-2032) (USD Billion)
11.5.1.8 Egypt
11.5.1.8.1 Egypt Cryogenic Tanks Market Estimates and Forecasts, By Cryogenic Liquid (2020-2032) (USD Billion)
11.5.1.8.2 Egypt Cryogenic Tanks Market Estimates and Forecasts, By Application (2020-2032) (USD Billion)
11.5.1.8.3 Egypt Cryogenic Tanks Market Estimates and Forecasts, By End Use (2020-2032) (USD Billion)
11.5.1.8.4 Egypt Cryogenic Tanks Market Estimates and Forecasts, By Raw Material (2020-2032) (USD Billion)
11.5.1.9 Saudi Arabia
11.5.1.9.1 Saudi Arabia Cryogenic Tanks Market Estimates and Forecasts, By Cryogenic Liquid (2020-2032) (USD Billion)
11.5.1.9.2 Saudi Arabia Cryogenic Tanks Market Estimates and Forecasts, By Application (2020-2032) (USD Billion)
11.5.1.9.3 Saudi Arabia Cryogenic Tanks Market Estimates and Forecasts, By End Use (2020-2032) (USD Billion)
11.5.1.9.4 Saudi Arabia Cryogenic Tanks Market Estimates and Forecasts, By Raw Material (2020-2032) (USD Billion)
11.5.1.10 Qatar
11.5.1.10.1 Qatar Cryogenic Tanks Market Estimates and Forecasts, By Cryogenic Liquid (2020-2032) (USD Billion)
11.5.1.10.2 Qatar Cryogenic Tanks Market Estimates and Forecasts, By Application (2020-2032) (USD Billion)
11.5.1.10.3 Qatar Cryogenic Tanks Market Estimates and Forecasts, By End Use (2020-2032) (USD Billion)
11.5.1.10.4 Qatar Cryogenic Tanks Market Estimates and Forecasts, By Raw Material (2020-2032) (USD Billion)
11.5.1.11 Rest of Middle East
11.5.1.11.1 Rest of Middle East Cryogenic Tanks Market Estimates and Forecasts, By Cryogenic Liquid (2020-2032) (USD Billion)
11.5.1.11.2 Rest of Middle East Cryogenic Tanks Market Estimates and Forecasts, By Application (2020-2032) (USD Billion)
11.5.1.11.3 Rest of Middle East Cryogenic Tanks Market Estimates and Forecasts, By End Use (2020-2032) (USD Billion)
11.5.1.11.4 Rest of Middle East Cryogenic Tanks Market Estimates and Forecasts, By Raw Material (2020-2032) (USD Billion)
11.5.2 Africa
11.5.2.1 Trends Analysis
11.5.2.2 Africa Cryogenic Tanks Market Estimates and Forecasts, by Country (2020-2032) (USD Billion)
11.5.2.3 Africa Cryogenic Tanks Market Estimates and Forecasts, By Cryogenic Liquid (2020-2032) (USD Billion)
11.5.2.4 Africa Cryogenic Tanks Market Estimates and Forecasts, By Application (2020-2032) (USD Billion)
11.5.2.5 Africa Cryogenic Tanks Market Estimates and Forecasts, By End Use (2020-2032) (USD Billion)
11.5.2.6 Africa Cryogenic Tanks Market Estimates and Forecasts, By Raw Material (2020-2032) (USD Billion)
11.5.2.7 South Africa
11.5.2.7.1 South Africa Cryogenic Tanks Market Estimates and Forecasts, By Cryogenic Liquid (2020-2032) (USD Billion)
11.5.2.7.2 South Africa Cryogenic Tanks Market Estimates and Forecasts, By Application (2020-2032) (USD Billion)
11.5.2.7.3 South Africa Cryogenic Tanks Market Estimates and Forecasts, By End Use (2020-2032) (USD Billion)
11.5.2.7.4 South Africa Cryogenic Tanks Market Estimates and Forecasts, By Raw Material (2020-2032) (USD Billion)
11.5.2.8 Nigeria
11.5.2.8.1 Nigeria Cryogenic Tanks Market Estimates and Forecasts, By Cryogenic Liquid (2020-2032) (USD Billion)
11.5.2.8.2 Nigeria Cryogenic Tanks Market Estimates and Forecasts, By Application (2020-2032) (USD Billion)
11.5.2.8.3 Nigeria Cryogenic Tanks Market Estimates and Forecasts, By End Use (2020-2032) (USD Billion)
11.5.2.8.4 Nigeria Cryogenic Tanks Market Estimates and Forecasts, By Raw Material (2020-2032) (USD Billion)
11.5.2.9 Rest of Africa
11.5.2.9.1 Rest of Africa Cryogenic Tanks Market Estimates and Forecasts, By Cryogenic Liquid (2020-2032) (USD Billion)
11.5.2.9.2 Rest of Africa Cryogenic Tanks Market Estimates and Forecasts, By Application (2020-2032) (USD Billion)
11.5.2.9.3 Rest of Africa Cryogenic Tanks Market Estimates and Forecasts, By End Use (2020-2032) (USD Billion)
11.5.2.9.4 Rest of Africa Cryogenic Tanks Market Estimates and Forecasts, By Raw Material (2020-2032) (USD Billion)
11.6 Latin America
11.6.1 Trends Analysis
11.6.2 Latin America Cryogenic Tanks Market Estimates and Forecasts, by Country (2020-2032) (USD Billion)
11.6.3 Latin America Cryogenic Tanks Market Estimates and Forecasts, By Cryogenic Liquid (2020-2032) (USD Billion)
11.6.4 Latin America Cryogenic Tanks Market Estimates and Forecasts, By Application (2020-2032) (USD Billion)
11.6.5 Latin America Cryogenic Tanks Market Estimates and Forecasts, By End Use (2020-2032) (USD Billion)
11.6.6 Latin America Cryogenic Tanks Market Estimates and Forecasts, By Raw Material (2020-2032) (USD Billion)
11.6.7 brazil
11.6.7.1 Brazil Cryogenic Tanks Market Estimates and Forecasts, By Cryogenic Liquid (2020-2032) (USD Billion)
11.6.7.2 Brazil Cryogenic Tanks Market Estimates and Forecasts, By Application (2020-2032) (USD Billion)
11.6.7.3 Brazil Cryogenic Tanks Market Estimates and Forecasts, By End Use (2020-2032) (USD Billion)
11.6.7.4 Brazil Cryogenic Tanks Market Estimates and Forecasts, By Raw Material (2020-2032) (USD Billion)
11.6.8 Argentina
11.6.8.1 Argentina Cryogenic Tanks Market Estimates and Forecasts, By Cryogenic Liquid (2020-2032) (USD Billion)
11.6.8.2 Argentina Cryogenic Tanks Market Estimates and Forecasts, By Application (2020-2032) (USD Billion)
11.6.8.3 Argentina Cryogenic Tanks Market Estimates and Forecasts, By End Use (2020-2032) (USD Billion)
11.6.8.4 Argentina Cryogenic Tanks Market Estimates and Forecasts, By Raw Material (2020-2032) (USD Billion)
11.6.9 Colombia
11.6.9.1 Colombia Cryogenic Tanks Market Estimates and Forecasts, By Cryogenic Liquid (2020-2032) (USD Billion)
11.6.9.2 Colombia Cryogenic Tanks Market Estimates and Forecasts, By Application (2020-2032) (USD Billion)
11.6.9.3 Colombia Cryogenic Tanks Market Estimates and Forecasts, By End Use (2020-2032) (USD Billion)
11.6.9.4 Colombia Cryogenic Tanks Market Estimates and Forecasts, By Raw Material (2020-2032) (USD Billion)
11.6.10 Rest of Latin America
11.6.10.1 Rest of Latin America Cryogenic Tanks Market Estimates and Forecasts, By Cryogenic Liquid (2020-2032) (USD Billion)
11.6.10.2 Rest of Latin America Cryogenic Tanks Market Estimates and Forecasts, By Application (2020-2032) (USD Billion)
11.6.10.3 Rest of Latin America Cryogenic Tanks Market Estimates and Forecasts, By End Use (2020-2032) (USD Billion)
11.6.10.4 Rest of Latin America Cryogenic Tanks Market Estimates and Forecasts, By Raw Material (2020-2032) (USD Billion)
12. Company Profiles
12.1 ISISAN A.Ş.
12.1.1 Company Overview
12.1.2 Financial
12.1.3 Products/ Services Offered
12.1.4 SWOT Analysis
12.2 Cryolor
12.2.1 Company Overview
12.2.2 Financial
12.2.3 Products/ Services Offered
12.2.4 SWOT Analysis
12.3 FIBA Technologies, Inc.
12.3.1 Company Overview
12.3.2 Financial
12.3.3 Products/ Services Offered
12.3.4 SWOT Analysis
12.4 Cryofab, Inc.
12.4.1 Company Overview
12.4.2 Financial
12.4.3 Products/ Services Offered
12.4.4 SWOT Analysis
12.5 SURETANK
12.5.1 Company Overview
12.5.2 Financial
12.5.3 Products/ Services Offered
12.5.4 SWOT Analysis
12.6 Super Cryogenic Systems Pvt Ltd.
12.6.1 Company Overview
12.6.2 Financial
12.6.3 Products/ Services Offered
12.6.4 SWOT Analysis
12.7 Chart Industries
12.7.1 Company Overview
12.7.2 Financial
12.7.3 Products/ Services Offered
12.7.4 SWOT Analysis
12.8 Wessington Cryogenics
12.8.1 Company Overview
12.8.2 Financial
12.8.3 Products/ Services Offered
12.8.4 SWOT Analysis
12.9 Eden Cryogenic LLC
12.9.1 Company Overview
12.9.2 Financial
12.9.3 Products/ Services Offered
12.9.4 SWOT Analysis
12.10 INOX India Limited
12.10.1 Company Overview
12.10.2 Financial
12.10.3 Products/ Services Offered
12.10.4 SWOT Analysis
13. Use Cases and Best Practices
14. Conclusion
An accurate research report requires proper strategizing as well as implementation. There are multiple factors involved in the completion of good and accurate research report and selecting the best methodology to compete the research is the toughest part. Since the research reports we provide play a crucial role in any company’s decision-making process, therefore we at SNS Insider always believe that we should choose the best method which gives us results closer to reality. This allows us to reach at a stage wherein we can provide our clients best and accurate investment to output ratio.
Each report that we prepare takes a timeframe of 350-400 business hours for production. Starting from the selection of titles through a couple of in-depth brain storming session to the final QC process before uploading our titles on our website we dedicate around 350 working hours. The titles are selected based on their current market cap and the foreseen CAGR and growth.
The 5 steps process:
Step 1: Secondary Research:
Secondary Research or Desk Research is as the name suggests is a research process wherein, we collect data through the readily available information. In this process we use various paid and unpaid databases which our team has access to and gather data through the same. This includes examining of listed companies’ annual reports, Journals, SEC filling etc. Apart from this our team has access to various associations across the globe across different industries. Lastly, we have exchange relationships with various university as well as individual libraries.

Step 2: Primary Research
When we talk about primary research, it is a type of study in which the researchers collect relevant data samples directly, rather than relying on previously collected data. This type of research is focused on gaining content specific facts that can be sued to solve specific problems. Since the collected data is fresh and first hand therefore it makes the study more accurate and genuine.
We at SNS Insider have divided Primary Research into 2 parts.
Part 1 wherein we interview the KOLs of major players as well as the upcoming ones across various geographic regions. This allows us to have their view over the market scenario and acts as an important tool to come closer to the accurate market numbers. As many as 45 paid and unpaid primary interviews are taken from both the demand and supply side of the industry to make sure we land at an accurate judgement and analysis of the market.
This step involves the triangulation of data wherein our team analyses the interview transcripts, online survey responses and observation of on filed participants. The below mentioned chart should give a better understanding of the part 1 of the primary interview.

Part 2: In this part of primary research the data collected via secondary research and the part 1 of the primary research is validated with the interviews from individual consultants and subject matter experts.
Consultants are those set of people who have at least 12 years of experience and expertise within the industry whereas Subject Matter Experts are those with at least 15 years of experience behind their back within the same space. The data with the help of two main processes i.e., FGDs (Focused Group Discussions) and IDs (Individual Discussions). This gives us a 3rd party nonbiased primary view of the market scenario making it a more dependable one while collation of the data pointers.
Step 3: Data Bank Validation
Once all the information is collected via primary and secondary sources, we run that information for data validation. At our intelligence centre our research heads track a lot of information related to the market which includes the quarterly reports, the daily stock prices, and other relevant information. Our data bank server gets updated every fortnight and that is how the information which we collected using our primary and secondary information is revalidated in real time.

Step 4: QA/QC Process
After all the data collection and validation our team does a final level of quality check and quality assurance to get rid of any unwanted or undesired mistakes. This might include but not limited to getting rid of the any typos, duplication of numbers or missing of any important information. The people involved in this process include technical content writers, research heads and graphics people. Once this process is completed the title gets uploader on our platform for our clients to read it.
Step 5: Final QC/QA Process:
This is the last process and comes when the client has ordered the study. In this process a final QA/QC is done before the study is emailed to the client. Since we believe in giving our clients a good experience of our research studies, therefore, to make sure that we do not lack at our end in any way humanly possible we do a final round of quality check and then dispatch the study to the client.
By Cryogenic Liquid
Liquefied Nitrogen
Liquid Natural Gas (LNG)
Liquid Hydrogen
Liquid Oxygen
Others
By Application
Storage
Transportation
By End Use
Manufacturing
Healthcare
Food & Beverages
Others
By Raw Material
Steel
Nickel Alloy
Aluminium Alloy
Request for Segment Customization as per your Business Requirement: Segment Customization Request
North America
US
Canada
Mexico
Europe
Eastern Europe
Poland
Romania
Hungary
Turkey
Rest of Eastern Europe
Western Europe
Germany
France
UK
Italy
Spain
Netherlands
Switzerland
Austria
Rest of Western Europe
Asia Pacific
China
India
Japan
South Korea
Vietnam
Singapore
Australia
Rest of Asia Pacific
Middle East & Africa
Middle East
UAE
Egypt
Saudi Arabia
Qatar
Rest of Middle East
Africa
Nigeria
South Africa
Rest of Africa
Latin America
Brazil
Argentina
Colombia
Rest of Latin America
Request for Country Level Research Report: Country Level Customization Request
Available Customization
With the given market data, SNS Insider offers customization as per the company’s specific needs. The following customization options are available for the report:
Detailed Volume Analysis
Criss-Cross segment analysis (e.g. Product X Application)
Competitive Product Benchmarking
Geographic Analysis
Additional countries in any of the regions
Customized Data Representation
Detailed analysis and profiling of additional market players
Electric Actuators Market was valued at USD 12.88 billion in 2023 and is expected to reach USD 58.32 billion by 2032, growing at a CAGR of 18.35% from 2024-2032.
The Handheld Chemical and Metal Detector Market Size was valued at USD 3.29 billion in 2023 and is expected to reach USD 10.03 billion by 2032 and grow at a CAGR of 13.19% over the forecast period 2024-2032.
Tab Leads and Tab Seal Film Market was esteemed at USD 374.65 Mn in 2023 and is supposed to arrive at USD 1174.91 Mn by 2032 at a CAGR of 13.54% from 2024-2032.
High-Pressure Seals Market was estimated at USD 5.57 billion in 2023 and is expected to arrive at USD 9.67 billion by 2032, at a CAGR of 6.32% from 2024-2032.
The Fluid Handling Systems Market Size was estimated at USD 74.55 billion in 2023 and is expected to arrive at USD 111.28 billion by 2032 with a growing CAGR of 4.55% over the forecast period 2024-2032.
Gas Analyzer, Sensor & Detector Market was estimated at USD 4.31 Bn in 2023 and is expected to reach USD 7.40 Bn by 2032, growing CAGR of 6.19% from 2024-2032.

Hi! Click one of our member below to chat on Phone
© 2025 All Rights Reserved by SNS Insider Pvt Ltd


