image

Crop Protection Chemicals Market Report Scope & Overview:

Crop Protection Chemicals Market Revenue Analysis

Get More Information on Crop Protection Chemicals Market - Request Sample Report

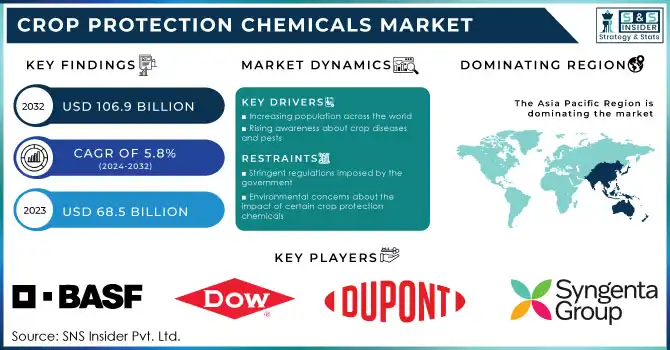
The Crop Protection Chemicals Market Size was valued at USD 64.57 Billion in 2023 and is expected to reach USD 102.31 Billion by 2032, growing at a CAGR of 5.30% over the forecast period of 2024-2032.

The Crop Protection Chemicals Market is evolving with shifting agricultural demands, regulatory policies, and sustainability concerns. Our report examines pricing trends across regions, highlighting cost variations and market competitiveness. The role of raw material suppliers is crucial, influencing production costs and supply chains. With growing emphasis on environmental sustainability, the market is adapting to eco-friendly solutions and stricter regulations. Trade dynamics are explored, identifying key exporting and importing countries shaping global supply. Investment trends reveal strategic expansions, research innovations, and emerging players. Additionally, chemical waste management regulations are tightening, impacting production and disposal practices. This report provides a comprehensive outlook on industry trends, challenges, and growth opportunities defining the future of crop protection chemicals.

Market Dynamics

Drivers

  • Adoption of Integrated Pest Management (IPM) Strategies to Enhance Sustainable Crop Protection Chemical Usage

The increasing adoption of Integrated Pest Management (IPM) strategies is significantly influencing the growth of the Crop Protection Chemicals Market. IPM focuses on a holistic approach to pest control, combining biological, cultural, mechanical, and chemical methods to minimize environmental impact while ensuring effective pest management. Farmers and agricultural organizations are shifting toward IPM due to its ability to reduce excessive chemical usage, improve soil health, and enhance crop resilience against pests and diseases. Governments and regulatory bodies worldwide are also promoting IPM through subsidies, awareness programs, and policy reforms, driving the demand for advanced crop protection chemicals that align with these principles. Manufacturers are increasingly developing products compatible with IPM strategies, such as biopesticides, targeted herbicides, and precision application technologies. The growing preference for IPM is reshaping the market by encouraging innovations that balance productivity with sustainability. As farmers seek efficient yet eco-friendly solutions, the demand for modern crop protection chemicals is set to rise, fostering market expansion in the coming years.

Restraints

  • Rising Resistance of Pests and Weeds to Conventional Crop Protection Chemicals Reducing Effectiveness and Hampering Market Growth

The increasing resistance of pests and weeds to conventional crop protection chemicals is emerging as a critical restraint in the Crop Protection Chemicals Market. Over time, repeated exposure to the same chemical compounds has led to genetic adaptations in pest populations, reducing the efficacy of insecticides, herbicides, and fungicides. This phenomenon has particularly affected key crops such as wheat, corn, and soybeans, where resistance issues are escalating. As a result, farmers are required to use higher doses or multiple chemicals, leading to increased costs and potential environmental risks. The agrochemical industry faces continuous pressure to develop novel active ingredients and integrated management strategies to counteract resistance. However, the research and development cycle for new crop protection chemicals is long and costly, further hindering market growth. The industry must address this challenge through innovation, but resistance management remains a persistent concern for sustainable agricultural productivity.

Opportunities

  • Surging Demand for Bio-Based Crop Protection Chemicals to Reduce Environmental and Health Risks

The rising consumer preference for organic food and sustainable farming practices is creating lucrative opportunities in the Crop Protection Chemicals Market for bio-based solutions. Biopesticides, bioherbicides, and microbial fungicides are gaining traction as effective alternatives to synthetic chemicals, driven by their lower toxicity, biodegradability, and eco-friendly nature. Governments are actively supporting the adoption of bio-based crop protection chemicals through incentives, research grants, and favorable regulatory policies. Key industry players are investing in biological formulations to cater to the growing demand for residue-free agricultural products. The increasing awareness of soil health preservation and biodiversity conservation further accelerates the shift toward bio-based solutions. As agricultural sustainability becomes a global priority, companies focusing on innovative biological crop protection chemicals are expected to witness substantial market growth.

Challenge

  • Balancing Cost-Effectiveness with Sustainability in Crop Protection Chemical Formulations

The challenge of balancing cost-effectiveness with sustainability is a key concern for manufacturers in the Crop Protection Chemicals Market. While the demand for environmentally friendly products is rising, developing sustainable alternatives that are both effective and affordable remains a hurdle. Bio-based pesticides and advanced formulations often come with higher production costs, making them less accessible to small-scale farmers in emerging economies. Additionally, meeting stringent sustainability standards while maintaining profitability requires significant research investment. Companies must innovate cost-efficient solutions without compromising environmental integrity. The industry’s ability to bridge this gap will determine the long-term success of sustainable crop protection technologies.

Segmental Analysis

By Source     

In 2023, the synthetic segment dominated the Crop Protection Chemicals Market, accounting for a 78.5% of the market share. Synthetic chemicals have long been the cornerstone of agricultural pest management due to their immediate and potent effects against a wide spectrum of pests and diseases. Their consistent performance, ease of application, and cost-effectiveness make them the preferred choice for large-scale farming operations. For instance, the U.S. Department of Agriculture (USDA) continues to support the use of approved synthetic pesticides to ensure crop yields meet the nation's food security demands. Similarly, in developing countries like Brazil, the adoption of synthetic herbicides has been instrumental in managing invasive weed species, thereby enhancing crop productivity. Despite the growing interest in bio-based alternatives, the scalability and proven efficacy of synthetic crop protection chemicals solidify their dominance in the market.

By Product Type

Herbicides dominated the Crop Protection Chemicals Market in 2023, capturing approximately 39.6% of the market share. The prevalence of herbicides is largely due to the global challenge of weed management, which significantly impacts crop yields. Weeds compete with crops for essential resources such as nutrients, water, and sunlight, necessitating effective control measures. The U.S. Environmental Protection Agency (EPA) has approved various herbicides that are widely utilized to manage weed proliferation in major crops like corn and soybeans. In regions such as North America, the extensive cultivation of herbicide-tolerant genetically modified crops has further propelled herbicide usage. Additionally, the development of advanced herbicidal formulations by agrochemical companies has enhanced application efficiency and broadened the spectrum of controllable weed species, reinforcing the segment's market leadership.

By Crop Type

Cereals and grains dominated the Crop Protection Chemicals Market in 2023, holding a 45.2% market share. Staple crops like wheat, rice, and maize are fundamental to global food security, leading to extensive cultivation worldwide. The high susceptibility of these crops to various pests and diseases necessitates the substantial use of crop protection chemicals to safeguard yields. Organizations such as the Food and Agriculture Organization (FAO) emphasize the importance of protecting cereal crops to meet the nutritional needs of the growing global population. For example, in India, government initiatives have been implemented to provide farmers with access to effective pesticides and fungicides, aiming to enhance the productivity of rice and wheat. The critical role of cereals and grains in daily diets ensures that this segment remains a primary focus for crop protection efforts.

By Form

The liquid form segment dominated the Crop Protection Chemicals Market in 2023, comprising about 63.1% of the market share. Liquid formulations, including emulsifiable concentrates and solutions, are favored for their ease of handling, mixing, and application. They offer uniform distribution and better adherence to plant surfaces, enhancing the efficacy of the active ingredients. Agricultural extension services often recommend liquid formulations for their versatility and effectiveness across various application methods, such as foliar sprays and soil treatments. In countries like Australia, the widespread use of liquid herbicides has been pivotal in large-scale weed management programs. The adaptability of liquid crop protection chemicals to different spraying equipment and their suitability for tank-mixing with fertilizers or other pesticides contribute to their predominant market position.

By Mode of Application

Foliar spray was the dominant mode of application in the Crop Protection Chemicals Market in 2023, accounting for approximately 54.2% of the market share. This method involves the direct application of chemicals to plant leaves, allowing for rapid absorption and immediate action against pests and diseases. Foliar spraying is particularly effective for addressing above-ground infestations and nutrient deficiencies. The method's efficiency is recognized by agricultural organizations, leading to its widespread adoption in both developed and developing regions. For instance, the Indian Council of Agricultural Research (ICAR) advocates foliar application of micronutrients and pesticides to enhance crop health and yield. The ability to quickly mitigate pest outbreaks and the convenience of combining pest control with nutrient supplementation make foliar spray a preferred choice among farmers, solidifying its leading position in the market.
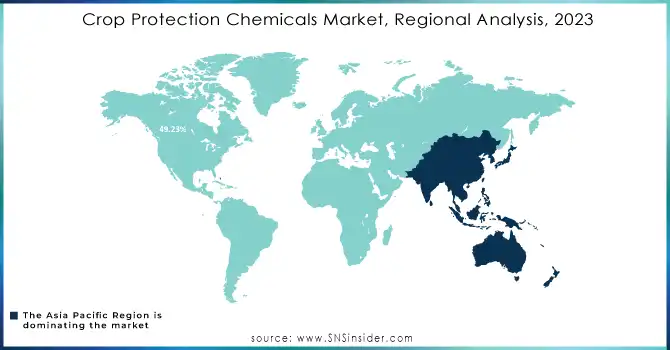
Regional Analysis

In 2023, the Asia Pacific region dominated the Crop Protection Chemicals Market, securing a 38.7% market share, driven by its vast agricultural landscape, high population density, and increasing food demand. Countries such as China, India, and Japan play a crucial role in this dominance. China, the largest producer and consumer of crop protection chemicals, benefits from government-backed agricultural initiatives and a well-established agrochemical industry. According to the National Bureau of Statistics of China, pesticide production reached approximately 2.1 million metric tons in 2023, showcasing its dominance. India, with its heavy reliance on agriculture, has also seen significant demand for insecticides and herbicides, fueled by initiatives like the “Paramparagat Krishi Vikas Yojana,” promoting modernized farming. The Indian agrochemical sector was valued at around $6.3 billion in 2023, as per the Federation of Indian Chambers of Commerce and Industry (FICCI). Additionally, Japan's advanced R&D in biopesticides and stringent agricultural safety regulations further contribute to regional market leadership.

However, North America emerged as the fastest-growing region in the Crop Protection Chemicals Market, with a significant growth rate during the forecast period. The growth is driven by technological advancements, precision agriculture, and increasing demand for sustainable crop protection solutions. The United States dominates the regional market, backed by a strong regulatory framework from agencies like the Environmental Protection Agency (EPA) and the U.S. Department of Agriculture (USDA), which encourage innovation in biopesticides and integrated pest management. In 2023, U.S. farmers spent approximately $14 billion on crop protection chemicals, with a significant rise in bio-based product adoption. Canada also plays a crucial role, with its government supporting sustainable agriculture practices under the "Canadian Agricultural Partnership," which has allocated over CAD 3 billion to improve farm productivity. Additionally, Mexico’s expanding agribusiness sector and increasing exports of fruits and vegetables to the U.S. further fuel market growth in the region.

Crop-Protection-Chemicals-Market-Regional-Analysis-2023

Get Customized Report as per Your Business Requirement - Request For Customized Report

Key Players

  • BASF SE (Headline, Kixor, Engenia)

  • Bayer AG (Bayer CropScience) (Delaro, Propulse, Luna)

  • Corteva Agriscience (Rinskor, Arylex, Transform)

  • FMC Corporation (Cyazypyr, Diamide, Talstar)

  • Ishihara Sangyo Kaisha Ltd. (Flonicamid, Cyflumetofen, Bixafen)

  • Jiangsu Yangnong Chemical Co. Ltd. (Lambda-cyhalothrin, Bifenthrin, Cypermethrin)

  • Kumiai Chemical Industry Co., Ltd. (Pyriftalid, Cyflufenamid, Benzobicyclon)

  • Mitsui Chemicals Agro, Inc. (Dinotefuran, Ortho-dichlorobenzene, Cyflufenamid)

  • Nippon Soda Co., Ltd. (Topsin-M, Nabu, Flutolanil)

  • Nufarm Ltd. (Weedmaster, Panther, Credit Xtreme)

  • PI Industries (Osheen, Biovita, Nominee Gold)

  • Rotam CropScience Ltd. (Rango, Rufast, Tezuma)

  • Sipcam-Oxon Group (Oxonil, Sipstar, Sipgran)

  • Sumitomo Chemical Co., Ltd. (Pyriproxyfen, Esfenvalerate, Fenitrothion)

  • Tagros Chemicals India Ltd. (Lambda-cyhalothrin, Deltamethrin, Cypermethrin)

  • UPL Limited (Manzate, Lifeline, Saaf)

  • Arysta LifeScience Corporation (Evito, Kasumin, Rancona)

  • Isagro S.p.A (Tetraconazole, Kiralaxyl, Copper Oxychloride)

  • Albaugh LLC (Atrazine, Simazine, 2,4-D)

  • Gowan Company (Permit, Sandea, Trellis)

Recent Developments

  • February 2025: Syngenta acquired a genetic repository from Novartis to enhance its biologic crop protection portfolio. The deal aimed to accelerate Syngenta’s research in sustainable agricultural solutions by leveraging Novartis’ genetic data. This acquisition aligned with Syngenta’s strategy to develop innovative and eco-friendly alternatives to conventional pesticides.

  • February 2025: Albaugh introduced a new Etiprole-based alternative formulation that offered twice the market concentration of existing products. The launch aimed to provide farmers with a more efficient crop protection solution, addressing pest resistance and improving overall yield. The formulation was developed to meet the growing demand for advanced insecticides with lower environmental impact.

  • January 2025: Sumitomo Chemical announced a partnership with a European agricultural firm to develop sustainable crop protection solutions. The collaboration focused on enhancing biological pest control methods and reducing reliance on synthetic chemicals. The initiative aligned with global sustainability goals and regulatory requirements for greener agricultural practices.

  • December 2024: Industry leaders at the Agrochem Summit 2024 called for supportive policies to drive growth in the crop protection sector. Discussions emphasized the need for streamlined regulations, increased R&D investments, and incentives for bio-based pesticides. Experts highlighted the role of policy reforms in boosting the agrochemical market amid rising global food demand.

  • January 2024: U.S. farmers faced increasing challenges as herbicide-resistant weeds spread rapidly, reducing the effectiveness of conventional chemical treatments. Scientists warned that resistance to widely used herbicides, including glyphosate, was worsening, leading to higher production costs and yield losses. Experts urged for integrated weed management strategies to counter the growing threat.

Crop Protection Chemicals Market Report Scope:

Report Attributes Details
Market Size in 2023 USD 64.57 Billion
Market Size by 2032 USD 102.31 Billion
CAGR CAGR of 5.30% From 2024 to 2032
Base Year 2023
Forecast Period 2024-2032
Historical Data 2020-2022
Report Scope & Coverage Market Size, Segments Analysis, Competitive  Landscape, Regional Analysis, DROC & SWOT Analysis, Forecast Outlook
Key Segments •By Source (Synthetic, Bio-based)
•By Product Type (Insecticide, Fungicide & Bactericides, Herbicide, Others)
•By Crop Type (Cereals & Grains, Fruits & Vegetables, Oilseeds & Pulses, Others)
•By Form (Liquid, Dry)
•By Mode of Application (Seed Treatment, Soil Treatment, Foliar Spray, Others)
Regional Analysis/Coverage North America (US, Canada, Mexico), Europe (Eastern Europe [Poland, Romania, Hungary, Turkey, Rest of Eastern Europe] Western Europe] Germany, France, UK, Italy, Spain, Netherlands, Switzerland, Austria, Rest of Western Europe]), Asia Pacific (China, India, Japan, South Korea, Vietnam, Singapore, Australia, Rest of Asia Pacific), Middle East & Africa (Middle East [UAE, Egypt, Saudi Arabia, Qatar, Rest of Middle East], Africa [Nigeria, South Africa, Rest of Africa], Latin America (Brazil, Argentina, Colombia, Rest of Latin America)
Company Profiles BASF SE, Bayer AG (Bayer CropScience), Syngenta Group, Corteva Agriscience, FMC Corporation, UPL Limited, Sumitomo Chemical Co., Ltd., Nufarm Ltd., American Vanguard Corporation, ADAMA Agricultural Solutions Ltd. and other key players


Frequently Asked Questions

Ans: The Crop Protection Chemicals Market was valued at USD 64.57 billion in 2023.

Ans: The Crop Protection Chemicals Market is projected to grow at a CAGR of 5.30% from 2024 to 2032.

Ans: The adoption of Integrated Pest Management (IPM) strategies is a major driver of the Crop Protection Chemicals Market.

Ans: The synthetic segment held a 78.5% share of the Crop Protection Chemicals Market in 2023.

Ans: The Asia Pacific region held the largest share of the Crop Protection Chemicals Market in 2023.

Table of Contents:

1. Introduction

1.1 Market Definition

1.2 Scope (Inclusion and Exclusions)

1.3 Research Assumptions

2. Executive Summary

2.1 Market Overview

2.2 Regional Synopsis

2.3 Competitive Summary

3. Research Methodology

3.1 Top-Down Approach

3.2 Bottom-up Approach

3.3. Data Validation

3.4 Primary Interviews

4. Market Dynamics Impact Analysis

4.1 Market Driving Factors Analysis

4.1.1 Drivers

4.1.2 Restraints

4.2 PESTLE Analysis

4.3 Porter’s Five Forces Model

5. Statistical Insights and Trends Reporting

5.1 Pricing Analysis of Different Crop Protection Chemical Products Across Regions.

5.2 Raw Material Suppliers and Their Impact on Cost Structure

5.3 Environmental & Sustainability Factors

5.4 Top Exporting and Importing Countries of Crop Protection Chemicals

5.5 Investment and Funding Analysis

5.6 Regulations Governing Chemical Waste Management

6. Competitive Landscape

6.1 List of Major Companies, By Region

6.2 Market Share Analysis, By Region

6.3 Product Benchmarking

6.3.1 Product specifications and features

6.3.2 Pricing

 6.4 Strategic Initiatives

6.4.1 Marketing and promotional activities

6.4.2 Distribution and supply chain strategies

6.4.3 Expansion plans and new product launches

6.4.4 Strategic partnerships and collaborations

6.5 Technological Advancements

6.6 Market Positioning and Branding

7. Crop Protection Chemicals Market Segmentation, By Source

7.1 Chapter Overview

7.2 Synthetic

7.2.1 Synthetic Market Trends Analysis (2020-2032)

7.2.2 Synthetic Market Size Estimates and Forecasts to 2032 (USD Billion)

7.3 Bio-based

7.3.1 Bio-based Market Trends Analysis (2020-2032)

7.3.2 Bio-based Market Size Estimates and Forecasts to 2032 (USD Billion)

8. Crop Protection Chemicals Market Segmentation, By Product Type

8.1 Chapter Overview

8.2 Insecticide

8.2.1 Insecticide Market Trends Analysis (2020-2032)

8.2.2 Insecticide Market Size Estimates And Forecasts To 2032 (USD Billion)

8.3 Fungicide & Bactericides

8.3.1 Fungicide & Bactericides Market Trends Analysis (2020-2032)

8.3.2 Fungicide & Bactericides Market Size Estimates And Forecasts To 2032 (USD Billion)

8.4 Herbicide

8.4.1 Herbicide Market Trends Analysis (2020-2032)

8.4.2 Herbicide Market Size Estimates And Forecasts To 2032 (USD Billion)

8.5 Others

8.5.1 Others Market Trends Analysis (2020-2032)

8.5.2 Others Market Size Estimates And Forecasts To 2032 (USD Billion)

9. Crop Protection Chemicals Market Segmentation, By Crop Type

9.1 Chapter Overview

9.2 Cereals and Grains

9.2.1 Cereals and Grains Market Trends Analysis (2020-2032)

9.2.2 Cereals and Grains Market Size Estimates And Forecasts To 2032 (USD Billion)

9.3 Fruits and Vegetables

9.3.1 Fruits and Vegetables Market Trends Analysis (2020-2032)

9.3.2 Fruits and Vegetables Market Size Estimates And Forecasts To 2032 (USD Billion)

9.4 Oilseeds & Pulses

9.4.1 Oilseeds & Pulses Market Trends Analysis (2020-2032)

9.4.2 Oilseeds & Pulses Market Size Estimates And Forecasts To 2032 (USD Billion)

9.5 Others

9.5.1 Others Market Trends Analysis (2020-2032)

9.5.2 Others Market Size Estimates And Forecasts To 2032 (USD Billion)

10. Crop Protection Chemicals Market Segmentation, By Form

10.1 Chapter Overview

10.2 Liquid

10.2.1 Liquid Market Trends Analysis (2020-2032)

10.2.2 Liquid Market Size Estimates And Forecasts To 2032 (USD Billion)

10.3 Dry

10.3.1 Dry Market Trends Analysis (2020-2032)

10.3.2 Dry Market Size Estimates And Forecasts To 2032 (USD Billion)

11. Crop Protection Chemicals Market Segmentation, By Mode of Application

11.1 Chapter Overview

11.2 Seed Treatment

11.2.1 Seed Treatment Market Trends Analysis (2020-2032)

11.2.2 Seed Treatment Market Size Estimates And Forecasts To 2032 (USD Billion)

11.3 Soil Treatment

11.3.1 Soil Treatment Market Trends Analysis (2020-2032)

11.3.2 Soil Treatment Market Size Estimates And Forecasts To 2032 (USD Billion)

11.4 Foliar Spray

11.4.1 Foliar Spray Market Trends Analysis (2020-2032)

11.4.2 Foliar Spray Market Size Estimates And Forecasts To 2032 (USD Billion)

11.5 Others

11.5.1 Others Market Trends Analysis (2020-2032)

11.5.2 Others Market Size Estimates And Forecasts To 2032 (USD Billion)

12. Regional Analysis

12.1 Chapter Overview

12.2 North America

12.2.1 Trends Analysis

12.2.2 North America Crop Protection Chemicals Market Estimates And Forecasts, By Country (2020-2032) (USD Billion)

12.2.3 North America Crop Protection Chemicals Market Estimates And Forecasts, By Source (2020-2032) (USD Billion)

12.2.4 North America Crop Protection Chemicals Market Estimates And Forecasts, By Product Type (2020-2032) (USD Billion)

12.2.5 North America Crop Protection Chemicals Market Estimates And Forecasts, By Crop Type (2020-2032) (USD Billion)

12.2.6 North America Crop Protection Chemicals Market Estimates And Forecasts, By Form (2020-2032) (USD Billion)

12.2.7 North America Crop Protection Chemicals Market Estimates And Forecasts, By Mode of Application (2020-2032) (USD Billion)

12.2.8 USA

12.2.8.1 USA Crop Protection Chemicals Market Estimates And Forecasts, By Source (2020-2032) (USD Billion)

12.2.8.2 USA Crop Protection Chemicals Market Estimates And Forecasts, By Product Type (2020-2032) (USD Billion)

12.2.8.3 USA Crop Protection Chemicals Market Estimates And Forecasts, By Crop Type (2020-2032) (USD Billion)

12.2.8.4 USA Crop Protection Chemicals Market Estimates And Forecasts, By Form (2020-2032) (USD Billion)

12.2.8.5 USA Crop Protection Chemicals Market Estimates And Forecasts, By Mode of Application (2020-2032) (USD Billion)

12.2.9 Canada

12.2.9.1 Canada Crop Protection Chemicals Market Estimates And Forecasts, By Source (2020-2032) (USD Billion)

12.2.9.2 Canada Crop Protection Chemicals Market Estimates And Forecasts, By Product Type (2020-2032) (USD Billion)

12.2.9.3 Canada Crop Protection Chemicals Market Estimates And Forecasts, By Crop Type (2020-2032) (USD Billion)

12.2.9.4 Canada Crop Protection Chemicals Market Estimates And Forecasts, By Form (2020-2032) (USD Billion)

12.2.9.5 Canada Crop Protection Chemicals Market Estimates And Forecasts, By Mode of Application (2020-2032) (USD Billion)

12.2.10 Mexico

12.2.10.1 Mexico Crop Protection Chemicals Market Estimates And Forecasts, By Source (2020-2032) (USD Billion)

12.2.10.2 Mexico Crop Protection Chemicals Market Estimates And Forecasts, By Product Type (2020-2032) (USD Billion)

12.2.10.3 Mexico Crop Protection Chemicals Market Estimates And Forecasts, By Crop Type (2020-2032) (USD Billion)

12.2.10.4 Mexico Crop Protection Chemicals Market Estimates And Forecasts, By Form (2020-2032) (USD Billion)

12.2.10.5 Mexico Crop Protection Chemicals Market Estimates And Forecasts, By Mode of Application (2020-2032) (USD Billion)

12.3 Europe

12.3.1 Eastern Europe

12.3.1.1 Trends Analysis

12.3.1.2 Eastern Europe Crop Protection Chemicals Market Estimates And Forecasts, By Country (2020-2032) (USD Billion)

12.3.1.3 Eastern Europe Crop Protection Chemicals Market Estimates And Forecasts, By Source (2020-2032) (USD Billion)

12.3.1.4 Eastern Europe Crop Protection Chemicals Market Estimates And Forecasts, By Product Type (2020-2032) (USD Billion)

12.3.1.5 Eastern Europe Crop Protection Chemicals Market Estimates And Forecasts, By Crop Type (2020-2032) (USD Billion)

12.3.1.6 Eastern Europe Crop Protection Chemicals Market Estimates And Forecasts, By Form (2020-2032) (USD Billion)

12.3.1.7 Eastern Europe Crop Protection Chemicals Market Estimates And Forecasts, By Mode of Application (2020-2032) (USD Billion)

12.3.1.8 Poland

12.3.1.8.1 Poland Crop Protection Chemicals Market Estimates And Forecasts, By Source (2020-2032) (USD Billion)

12.3.1.8.2 Poland Crop Protection Chemicals Market Estimates And Forecasts, By Product Type (2020-2032) (USD Billion)

12.3.1.8.3 Poland Crop Protection Chemicals Market Estimates And Forecasts, By Crop Type (2020-2032) (USD Billion)

12.3.1.8.4 Poland Crop Protection Chemicals Market Estimates And Forecasts, By Form (2020-2032) (USD Billion)

12.3.1.8.5 Poland Crop Protection Chemicals Market Estimates And Forecasts, By Mode of Application (2020-2032) (USD Billion)

12.3.1.9 Romania

12.3.1.9.1 Romania Crop Protection Chemicals Market Estimates And Forecasts, By Source (2020-2032) (USD Billion)

12.3.1.9.2 Romania Crop Protection Chemicals Market Estimates And Forecasts, By Product Type (2020-2032) (USD Billion)

12.3.1.9.3 Romania Crop Protection Chemicals Market Estimates And Forecasts, By Crop Type (2020-2032) (USD Billion)

12.3.1.9.4 Romania Crop Protection Chemicals Market Estimates And Forecasts, By Form (2020-2032) (USD Billion)

12.3.1.9.5 Romania Crop Protection Chemicals Market Estimates And Forecasts, By Mode of Application (2020-2032) (USD Billion)

12.3.1.10 Hungary

12.3.1.10.1 Hungary Crop Protection Chemicals Market Estimates And Forecasts, By Source (2020-2032) (USD Billion)

12.3.1.10.2 Hungary Crop Protection Chemicals Market Estimates And Forecasts, By Product Type (2020-2032) (USD Billion)

12.3.1.10.3 Hungary Crop Protection Chemicals Market Estimates And Forecasts, By Crop Type (2020-2032) (USD Billion)

12.3.1.10.4 Hungary Crop Protection Chemicals Market Estimates And Forecasts, By Form (2020-2032) (USD Billion)

12.3.1.10.5 Hungary Crop Protection Chemicals Market Estimates And Forecasts, By Mode of Application (2020-2032) (USD Billion)

12.3.1.11 Turkey

12.3.1.11.1 Turkey Crop Protection Chemicals Market Estimates And Forecasts, By Source (2020-2032) (USD Billion)

12.3.1.11.2 Turkey Crop Protection Chemicals Market Estimates And Forecasts, By Product Type (2020-2032) (USD Billion)

12.3.1.11.3 Turkey Crop Protection Chemicals Market Estimates And Forecasts, By Crop Type (2020-2032) (USD Billion)

12.3.1.11.4 Turkey Crop Protection Chemicals Market Estimates And Forecasts, By Form (2020-2032) (USD Billion)

12.3.1.11.5 Turkey Crop Protection Chemicals Market Estimates And Forecasts, By Mode of Application (2020-2032) (USD Billion)

12.3.1.12 Rest Of Eastern Europe

12.3.1.12.1 Rest Of Eastern Europe Crop Protection Chemicals Market Estimates And Forecasts, By Source (2020-2032) (USD Billion)

12.3.1.12.2 Rest Of Eastern Europe Crop Protection Chemicals Market Estimates And Forecasts, By Product Type (2020-2032) (USD Billion)

12.3.1.12.3 Rest Of Eastern Europe Crop Protection Chemicals Market Estimates And Forecasts, By Crop Type (2020-2032) (USD Billion)

12.3.1.12.4 Rest Of Eastern Europe Crop Protection Chemicals Market Estimates And Forecasts, By Form (2020-2032) (USD Billion)

12.3.1.12.5 Rest Of Eastern Europe Crop Protection Chemicals Market Estimates And Forecasts, By Mode of Application (2020-2032) (USD Billion)

12.3.2 Western Europe

12.3.2.1 Trends Analysis

12.3.2.2 Western Europe Crop Protection Chemicals Market Estimates And Forecasts, By Country (2020-2032) (USD Billion)

12.3.2.3 Western Europe Crop Protection Chemicals Market Estimates And Forecasts, By Source (2020-2032) (USD Billion)

12.3.2.4 Western Europe Crop Protection Chemicals Market Estimates And Forecasts, By Product Type (2020-2032) (USD Billion)

12.3.2.5 Western Europe Crop Protection Chemicals Market Estimates And Forecasts, By Crop Type (2020-2032) (USD Billion)

12.3.2.6 Western Europe Crop Protection Chemicals Market Estimates And Forecasts, By Form (2020-2032) (USD Billion)

12.3.2.7 Western Europe Crop Protection Chemicals Market Estimates And Forecasts, By Mode of Application (2020-2032) (USD Billion)

12.3.2.8 Germany

12.3.2.8.1 Germany Crop Protection Chemicals Market Estimates And Forecasts, By Source (2020-2032) (USD Billion)

12.3.2.8.2 Germany Crop Protection Chemicals Market Estimates And Forecasts, By Product Type (2020-2032) (USD Billion)

12.3.2.8.3 Germany Crop Protection Chemicals Market Estimates And Forecasts, By Crop Type (2020-2032) (USD Billion)

12.3.2.8.4 Germany Crop Protection Chemicals Market Estimates And Forecasts, By Form (2020-2032) (USD Billion)

12.3.2.8.5 Germany Crop Protection Chemicals Market Estimates And Forecasts, By Mode of Application (2020-2032) (USD Billion)

12.3.2.9 France

12.3.2.9.1 France Crop Protection Chemicals Market Estimates And Forecasts, By Source (2020-2032) (USD Billion)

12.3.2.9.2 France Crop Protection Chemicals Market Estimates And Forecasts, By Product Type (2020-2032) (USD Billion)

12.3.2.9.3 France Crop Protection Chemicals Market Estimates And Forecasts, By Crop Type (2020-2032) (USD Billion)

12.3.2.9.4 France Crop Protection Chemicals Market Estimates And Forecasts, By Form (2020-2032) (USD Billion)

12.3.2.9.5 France Crop Protection Chemicals Market Estimates And Forecasts, By Mode of Application (2020-2032) (USD Billion)

12.3.2.10 UK

12.3.2.10.1 UK Crop Protection Chemicals Market Estimates And Forecasts, By Source (2020-2032) (USD Billion)

12.3.2.10.2 UK Crop Protection Chemicals Market Estimates And Forecasts, By Product Type (2020-2032) (USD Billion)

12.3.2.10.3 UK Crop Protection Chemicals Market Estimates And Forecasts, By Crop Type (2020-2032) (USD Billion)

12.3.2.10.4 UK Crop Protection Chemicals Market Estimates And Forecasts, By Form (2020-2032) (USD Billion)

12.3.2.10.5 UK Crop Protection Chemicals Market Estimates And Forecasts, By Mode of Application (2020-2032) (USD Billion)

12.3.2.11 Italy

12.3.2.11.1 Italy Crop Protection Chemicals Market Estimates And Forecasts, By Source (2020-2032) (USD Billion)

12.3.2.11.2 Italy Crop Protection Chemicals Market Estimates And Forecasts, By Product Type (2020-2032) (USD Billion)

12.3.2.11.3 Italy Crop Protection Chemicals Market Estimates And Forecasts, By Crop Type (2020-2032) (USD Billion)

12.3.2.11.4 Italy Crop Protection Chemicals Market Estimates And Forecasts, By Form (2020-2032) (USD Billion)

12.3.2.11.5 Italy Crop Protection Chemicals Market Estimates And Forecasts, By Mode of Application (2020-2032) (USD Billion)

12.3.2.12 Spain

12.3.2.12.1 Spain Crop Protection Chemicals Market Estimates And Forecasts, By Source (2020-2032) (USD Billion)

12.3.2.12.2 Spain Crop Protection Chemicals Market Estimates And Forecasts, By Product Type (2020-2032) (USD Billion)

12.3.2.12.3 Spain Crop Protection Chemicals Market Estimates And Forecasts, By Crop Type (2020-2032) (USD Billion)

12.3.2.12.4 Spain Crop Protection Chemicals Market Estimates And Forecasts, By Form (2020-2032) (USD Billion)

12.3.2.12.5 Spain Crop Protection Chemicals Market Estimates And Forecasts, By Mode of Application (2020-2032) (USD Billion)

12.3.2.13 Netherlands

12.3.2.13.1 Netherlands Crop Protection Chemicals Market Estimates And Forecasts, By Source (2020-2032) (USD Billion)

12.3.2.13.2 Netherlands Crop Protection Chemicals Market Estimates And Forecasts, By Product Type (2020-2032) (USD Billion)

12.3.2.13.3 Netherlands Crop Protection Chemicals Market Estimates And Forecasts, By Crop Type (2020-2032) (USD Billion)

12.3.2.13.4 Netherlands Crop Protection Chemicals Market Estimates And Forecasts, By Form (2020-2032) (USD Billion)

12.3.2.13.5 Netherlands Crop Protection Chemicals Market Estimates And Forecasts, By Mode of Application (2020-2032) (USD Billion)

12.3.2.14 Switzerland

12.3.2.14.1 Switzerland Crop Protection Chemicals Market Estimates And Forecasts, By Source (2020-2032) (USD Billion)

12.3.2.14.2 Switzerland Crop Protection Chemicals Market Estimates And Forecasts, By Product Type (2020-2032) (USD Billion)

12.3.2.14.3 Switzerland Crop Protection Chemicals Market Estimates And Forecasts, By Crop Type (2020-2032) (USD Billion)

12.3.2.14.4 Switzerland Crop Protection Chemicals Market Estimates And Forecasts, By Form (2020-2032) (USD Billion)

12.3.2.12.5 Switzerland Crop Protection Chemicals Market Estimates And Forecasts, By Mode of Application (2020-2032) (USD Billion)

12.3.2.15 Austria

12.3.2.15.1 Austria Crop Protection Chemicals Market Estimates And Forecasts, By Source (2020-2032) (USD Billion)

12.3.2.15.2 Austria Crop Protection Chemicals Market Estimates And Forecasts, By Product Type (2020-2032) (USD Billion)

12.3.2.15.3 Austria Crop Protection Chemicals Market Estimates And Forecasts, By Crop Type (2020-2032) (USD Billion)

12.3.2.15.4 Austria Crop Protection Chemicals Market Estimates And Forecasts, By Form (2020-2032) (USD Billion)

12.3.2.15.5 Austria Crop Protection Chemicals Market Estimates And Forecasts, By Mode of Application (2020-2032) (USD Billion)

12.3.2.16 Rest Of Western Europe

12.3.2.16.1 Rest Of Western Europe Crop Protection Chemicals Market Estimates And Forecasts, By Source (2020-2032) (USD Billion)

12.3.2.16.2 Rest Of Western Europe Crop Protection Chemicals Market Estimates And Forecasts, By Product Type (2020-2032) (USD Billion)

12.3.2.16.3 Rest Of Western Europe Crop Protection Chemicals Market Estimates And Forecasts, By Crop Type (2020-2032) (USD Billion)

12.3.2.16.4 Rest Of Western Europe Crop Protection Chemicals Market Estimates And Forecasts, By Form (2020-2032) (USD Billion)

12.3.2.16.5 Rest Of Western Europe Crop Protection Chemicals Market Estimates And Forecasts, By Mode of Application (2020-2032) (USD Billion)

12.4 Asia Pacific

12.4.1 Trends Analysis

12.4.2 Asia Pacific Crop Protection Chemicals Market Estimates And Forecasts, By Country (2020-2032) (USD Billion)

12.4.3 Asia Pacific Crop Protection Chemicals Market Estimates And Forecasts, By Source (2020-2032) (USD Billion)

12.4.4 Asia Pacific Crop Protection Chemicals Market Estimates And Forecasts, By Product Type (2020-2032) (USD Billion)

12.4.5 Asia Pacific Crop Protection Chemicals Market Estimates And Forecasts, By Crop Type (2020-2032) (USD Billion)

12.4.6 Asia Pacific Crop Protection Chemicals Market Estimates And Forecasts, By Form (2020-2032) (USD Billion)

12.4.7 Asia Pacific Crop Protection Chemicals Market Estimates And Forecasts, By Mode of Application (2020-2032) (USD Billion)

12.4.8 China

12.4.8.1 China Crop Protection Chemicals Market Estimates And Forecasts, By Source (2020-2032) (USD Billion)

12.4.8.2 China Crop Protection Chemicals Market Estimates And Forecasts, By Product Type (2020-2032) (USD Billion)

12.4.8.3 China Crop Protection Chemicals Market Estimates And Forecasts, By Crop Type (2020-2032) (USD Billion)

12.4.8.4 China Crop Protection Chemicals Market Estimates And Forecasts, By Form (2020-2032) (USD Billion)

12.4.8.5 China Crop Protection Chemicals Market Estimates And Forecasts, By Mode of Application (2020-2032) (USD Billion)

12.4.9 India

12.4.9.1 India Crop Protection Chemicals Market Estimates And Forecasts, By Source (2020-2032) (USD Billion)

12.4.9.2 India Crop Protection Chemicals Market Estimates And Forecasts, By Product Type (2020-2032) (USD Billion)

12.4.9.3 India Crop Protection Chemicals Market Estimates And Forecasts, By Crop Type (2020-2032) (USD Billion)

12.4.9.4 India Crop Protection Chemicals Market Estimates And Forecasts, By Form (2020-2032) (USD Billion)

12.4.9.5 India Crop Protection Chemicals Market Estimates And Forecasts, By Mode of Application (2020-2032) (USD Billion)

12.4.10 Japan

12.4.10.1 Japan Crop Protection Chemicals Market Estimates And Forecasts, By Source (2020-2032) (USD Billion)

12.4.10.2 Japan Crop Protection Chemicals Market Estimates And Forecasts, By Product Type (2020-2032) (USD Billion)

12.4.10.3 Japan Crop Protection Chemicals Market Estimates And Forecasts, By Crop Type (2020-2032) (USD Billion)

12.4.10.4 Japan Crop Protection Chemicals Market Estimates And Forecasts, By Form (2020-2032) (USD Billion)

12.4.10.5 Japan Crop Protection Chemicals Market Estimates And Forecasts, By Mode of Application (2020-2032) (USD Billion)

12.4.11 South Korea

12.4.11.1 South Korea Crop Protection Chemicals Market Estimates And Forecasts, By Source (2020-2032) (USD Billion)

12.4.11.2 South Korea Crop Protection Chemicals Market Estimates And Forecasts, By Product Type (2020-2032) (USD Billion)

12.4.11.3 South Korea Crop Protection Chemicals Market Estimates And Forecasts, By Crop Type (2020-2032) (USD Billion)

12.4.11.4 South Korea Crop Protection Chemicals Market Estimates And Forecasts, By Form (2020-2032) (USD Billion)

12.4.11.5 South Korea Crop Protection Chemicals Market Estimates And Forecasts, By Mode of Application (2020-2032) (USD Billion)

12.4.12 Vietnam

12.4.12.1 Vietnam Crop Protection Chemicals Market Estimates And Forecasts, By Source (2020-2032) (USD Billion)

12.4.12.2 Vietnam Crop Protection Chemicals Market Estimates And Forecasts, By Product Type (2020-2032) (USD Billion)

12.4.12.3 Vietnam Crop Protection Chemicals Market Estimates And Forecasts, By Crop Type (2020-2032) (USD Billion)

12.4.12.4 Vietnam Crop Protection Chemicals Market Estimates And Forecasts, By Form (2020-2032) (USD Billion)

12.4.12.5 Vietnam Crop Protection Chemicals Market Estimates And Forecasts, By Mode of Application (2020-2032) (USD Billion)

12.4.13 Singapore

12.4.13.1 Singapore Crop Protection Chemicals Market Estimates And Forecasts, By Source (2020-2032) (USD Billion)

12.4.13.2 Singapore Crop Protection Chemicals Market Estimates And Forecasts, By Product Type (2020-2032) (USD Billion)

12.4.13.3 Singapore Crop Protection Chemicals Market Estimates And Forecasts, By Crop Type (2020-2032) (USD Billion)

12.4.13.4 Singapore Crop Protection Chemicals Market Estimates And Forecasts, By Form (2020-2032) (USD Billion)

12.4.13.5 Singapore Crop Protection Chemicals Market Estimates And Forecasts, By Mode of Application (2020-2032) (USD Billion)

12.4.14 Australia

12.4.14.1 Australia Crop Protection Chemicals Market Estimates And Forecasts, By Source (2020-2032) (USD Billion)

12.4.14.2 Australia Crop Protection Chemicals Market Estimates And Forecasts, By Product Type (2020-2032) (USD Billion)

12.4.14.3 Australia Crop Protection Chemicals Market Estimates And Forecasts, By Crop Type (2020-2032) (USD Billion)

12.4.14.4 Australia Crop Protection Chemicals Market Estimates And Forecasts, By Form (2020-2032) (USD Billion)

12.4.14.5 Australia Crop Protection Chemicals Market Estimates And Forecasts, By Mode of Application (2020-2032) (USD Billion)

12.4.15 Rest Of Asia Pacific

12.4.15.1 Rest Of Asia Pacific Crop Protection Chemicals Market Estimates And Forecasts, By Source (2020-2032) (USD Billion)

12.4.15.2 Rest Of Asia Pacific Crop Protection Chemicals Market Estimates And Forecasts, By Product Type (2020-2032) (USD Billion)

12.4.15.3 Rest Of Asia Pacific Crop Protection Chemicals Market Estimates And Forecasts, By Crop Type (2020-2032) (USD Billion)

12.4.15.4 Rest Of Asia Pacific Crop Protection Chemicals Market Estimates And Forecasts, By Form (2020-2032) (USD Billion)

12.4.15.5 Rest Of Asia Pacific Crop Protection Chemicals Market Estimates And Forecasts, By Mode of Application (2020-2032) (USD Billion)

12.5 Middle East And Africa

12.5.1 Middle East

12.5.1.1 Trends Analysis

12.5.1.2 Middle East Crop Protection Chemicals Market Estimates And Forecasts, By Country (2020-2032) (USD Billion)

12.5.1.3 Middle East Crop Protection Chemicals Market Estimates And Forecasts, By Source (2020-2032) (USD Billion)

12.5.1.4 Middle East Crop Protection Chemicals Market Estimates And Forecasts, By Product Type (2020-2032) (USD Billion)

12.5.1.5 Middle East Crop Protection Chemicals Market Estimates And Forecasts, By Crop Type (2020-2032) (USD Billion)

12.5.1.6 Middle East Crop Protection Chemicals Market Estimates And Forecasts, By Form (2020-2032) (USD Billion)

12.5.1.7 Middle East Crop Protection Chemicals Market Estimates And Forecasts, By Mode of Application (2020-2032) (USD Billion)

12.5.1.8 UAE

12.5.1.8.1 UAE Crop Protection Chemicals Market Estimates And Forecasts, By Source (2020-2032) (USD Billion)

12.5.1.8.2 UAE Crop Protection Chemicals Market Estimates And Forecasts, By Product Type (2020-2032) (USD Billion)

12.5.1.8.3 UAE Crop Protection Chemicals Market Estimates And Forecasts, By Crop Type (2020-2032) (USD Billion)

12.5.1.8.4 UAE Crop Protection Chemicals Market Estimates And Forecasts, By Form (2020-2032) (USD Billion)

12.5.1.8.5 UAE Crop Protection Chemicals Market Estimates And Forecasts, By Mode of Application (2020-2032) (USD Billion)

12.5.1.9 Egypt

12.5.1.9.1 Egypt Crop Protection Chemicals Market Estimates And Forecasts, By Source (2020-2032) (USD Billion)

12.5.1.9.2 Egypt Crop Protection Chemicals Market Estimates And Forecasts, By Product Type (2020-2032) (USD Billion)

12.5.1.9.3 Egypt Crop Protection Chemicals Market Estimates And Forecasts, By Crop Type (2020-2032) (USD Billion)

12.5.1.9.4 Egypt Crop Protection Chemicals Market Estimates And Forecasts, By Form (2020-2032) (USD Billion)

12.5.1.9.5 Egypt Crop Protection Chemicals Market Estimates And Forecasts, By Mode of Application (2020-2032) (USD Billion)

12.5.1.10 Saudi Arabia

12.5.1.10.1 Saudi Arabia Crop Protection Chemicals Market Estimates And Forecasts, By Source (2020-2032) (USD Billion)

12.5.1.10.2 Saudi Arabia Crop Protection Chemicals Market Estimates And Forecasts, By Product Type (2020-2032) (USD Billion)

12.5.1.10.3 Saudi Arabia Crop Protection Chemicals Market Estimates And Forecasts, By Crop Type (2020-2032) (USD Billion)

12.5.1.10.4 Saudi Arabia Crop Protection Chemicals Market Estimates And Forecasts, By Form (2020-2032) (USD Billion)

12.5.1.10.5 Saudi Arabia Crop Protection Chemicals Market Estimates And Forecasts, By Mode of Application (2020-2032) (USD Billion)

12.5.1.11 Qatar

12.5.1.11.1 Qatar Crop Protection Chemicals Market Estimates And Forecasts, By Source (2020-2032) (USD Billion)

12.5.1.11.2 Qatar Crop Protection Chemicals Market Estimates And Forecasts, By Product Type (2020-2032) (USD Billion)

12.5.1.11.3 Qatar Crop Protection Chemicals Market Estimates And Forecasts, By Crop Type (2020-2032) (USD Billion)

12.5.1.11.4 Qatar Crop Protection Chemicals Market Estimates And Forecasts, By Form (2020-2032) (USD Billion)

12.5.1.11.5 Qatar Crop Protection Chemicals Market Estimates And Forecasts, By Mode of Application (2020-2032) (USD Billion)

12.5.1.12 Rest Of Middle East

12.5.1.12.1 Rest Of Middle East Crop Protection Chemicals Market Estimates And Forecasts, By Source (2020-2032) (USD Billion)

12.5.1.12.2 Rest Of Middle East Crop Protection Chemicals Market Estimates And Forecasts, By Product Type (2020-2032) (USD Billion)

12.5.1.12.3 Rest Of Middle East Crop Protection Chemicals Market Estimates And Forecasts, By Crop Type (2020-2032) (USD Billion)

12.5.1.12.4 Rest Of Middle East Crop Protection Chemicals Market Estimates And Forecasts, By Form (2020-2032) (USD Billion)

12.5.1.12.5 Rest Of Middle East Crop Protection Chemicals Market Estimates And Forecasts, By Mode of Application (2020-2032) (USD Billion)

12.5.2 Africa

12.5.2.1 Trends Analysis

12.5.2.2 Africa Crop Protection Chemicals Market Estimates And Forecasts, By Country (2020-2032) (USD Billion)

12.5.2.3 Africa Crop Protection Chemicals Market Estimates And Forecasts, By Source (2020-2032) (USD Billion)

12.5.2.4 Africa Crop Protection Chemicals Market Estimates And Forecasts, By Product Type (2020-2032) (USD Billion)

12.5.2.5 Africa Crop Protection Chemicals Market Estimates And Forecasts, By Crop Type (2020-2032) (USD Billion)

12.5.2.6 Africa Crop Protection Chemicals Market Estimates And Forecasts, By Form (2020-2032) (USD Billion)

12.5.2.7 Africa Crop Protection Chemicals Market Estimates And Forecasts, By Mode of Application (2020-2032) (USD Billion)

12.5.2.8 South Africa

12.5.2.8.1 South Africa Crop Protection Chemicals Market Estimates And Forecasts, By Source (2020-2032) (USD Billion)

12.5.2.8.2 South Africa Crop Protection Chemicals Market Estimates And Forecasts, By Product Type (2020-2032) (USD Billion)

12.5.2.8.3 South Africa Crop Protection Chemicals Market Estimates And Forecasts, By Crop Type (2020-2032) (USD Billion)

12.5.2.8.4 South Africa Crop Protection Chemicals Market Estimates And Forecasts, By Form (2020-2032) (USD Billion)

12.5.2.8.5 South Africa Crop Protection Chemicals Market Estimates And Forecasts, By Mode of Application (2020-2032) (USD Billion)

12.5.2.9 Nigeria

12.5.2.9.1 Nigeria Crop Protection Chemicals Market Estimates And Forecasts, By Source (2020-2032) (USD Billion)

12.5.2.9.2 Nigeria Crop Protection Chemicals Market Estimates And Forecasts, By Product Type (2020-2032) (USD Billion)

12.5.2.9.3 Nigeria Crop Protection Chemicals Market Estimates And Forecasts, By Crop Type (2020-2032) (USD Billion)

12.5.2.9.4 Nigeria Crop Protection Chemicals Market Estimates And Forecasts, By Form (2020-2032) (USD Billion)

12.5.2.9.5 Nigeria Crop Protection Chemicals Market Estimates And Forecasts, By Mode of Application (2020-2032) (USD Billion)

12.5.2.10 Rest Of Africa

12.5.2.10.1 Rest Of Africa Crop Protection Chemicals Market Estimates And Forecasts, By Source (2020-2032) (USD Billion)

12.5.2.10.2 Rest Of Africa Crop Protection Chemicals Market Estimates And Forecasts, By Product Type (2020-2032) (USD Billion)

12.5.2.10.3 Rest Of Africa Crop Protection Chemicals Market Estimates And Forecasts, By Crop Type (2020-2032) (USD Billion)

12.5.2.10.4 Rest Of Africa Crop Protection Chemicals Market Estimates And Forecasts, By Form (2020-2032) (USD Billion)

12.5.2.10.5 Rest Of Africa Crop Protection Chemicals Market Estimates And Forecasts, By Mode of Application (2020-2032) (USD Billion)

12.6 Latin America

12.6.1 Trends Analysis

12.6.2 Latin America Crop Protection Chemicals Market Estimates And Forecasts, By Country (2020-2032) (USD Billion)

12.6.3 Latin America Crop Protection Chemicals Market Estimates And Forecasts, By Source (2020-2032) (USD Billion)

12.6.4 Latin America Crop Protection Chemicals Market Estimates And Forecasts, By Product Type (2020-2032) (USD Billion)

12.6.5 Latin America Crop Protection Chemicals Market Estimates And Forecasts, By Crop Type (2020-2032) (USD Billion)

12.6.6 Latin America Crop Protection Chemicals Market Estimates And Forecasts, By Form (2020-2032) (USD Billion)

12.6.7 Latin America Crop Protection Chemicals Market Estimates And Forecasts, By Mode of Application (2020-2032) (USD Billion)

12.6.8 Brazil

12.6.8.1 Brazil Crop Protection Chemicals Market Estimates And Forecasts, By Source (2020-2032) (USD Billion)

12.6.8.2 Brazil Crop Protection Chemicals Market Estimates And Forecasts, By Product Type (2020-2032) (USD Billion)

12.6.8.3 Brazil Crop Protection Chemicals Market Estimates And Forecasts, By Crop Type (2020-2032) (USD Billion)

12.6.8.4 Brazil Crop Protection Chemicals Market Estimates And Forecasts, By Form (2020-2032) (USD Billion)

12.6.8.5 Brazil Crop Protection Chemicals Market Estimates And Forecasts, By Mode of Application (2020-2032) (USD Billion)

12.6.9 Argentina

12.6.9.1 Argentina Crop Protection Chemicals Market Estimates And Forecasts, By Source (2020-2032) (USD Billion)

12.6.9.2 Argentina Crop Protection Chemicals Market Estimates And Forecasts, By Product Type (2020-2032) (USD Billion)

12.6.9.3 Argentina Crop Protection Chemicals Market Estimates And Forecasts, By Crop Type (2020-2032) (USD Billion)

12.6.9.4 Argentina Crop Protection Chemicals Market Estimates And Forecasts, By Form (2020-2032) (USD Billion)

12.6.9.5 Argentina Crop Protection Chemicals Market Estimates And Forecasts, By Mode of Application (2020-2032) (USD Billion)

12.6.10 Colombia

12.6.10.1 Colombia Crop Protection Chemicals Market Estimates And Forecasts, By Source (2020-2032) (USD Billion)

12.6.10.2 Colombia Crop Protection Chemicals Market Estimates And Forecasts, By Product Type (2020-2032) (USD Billion)

12.6.10.3 Colombia Crop Protection Chemicals Market Estimates And Forecasts, By Crop Type (2020-2032) (USD Billion)

12.6.10.4 Colombia Crop Protection Chemicals Market Estimates And Forecasts, By Form (2020-2032) (USD Billion)

12.6.10.5 Colombia Crop Protection Chemicals Market Estimates And Forecasts, By Mode of Application (2020-2032) (USD Billion)

12.6.11 Rest Of Latin America

12.6.11.1 Rest Of Latin America Crop Protection Chemicals Market Estimates And Forecasts, By Source (2020-2032) (USD Billion)

12.6.11.2 Rest Of Latin America Crop Protection Chemicals Market Estimates And Forecasts, By Product Type (2020-2032) (USD Billion)

12.6.11.3 Rest Of Latin America Crop Protection Chemicals Market Estimates And Forecasts, By Crop Type (2020-2032) (USD Billion)

12.6.11.4 Rest Of Latin America Crop Protection Chemicals Market Estimates And Forecasts, By Form (2020-2032) (USD Billion)

12.6.11.5 Rest Of Latin America Crop Protection Chemicals Market Estimates And Forecasts, By Mode of Application (2020-2032) (USD Billion)

13. Company Profiles

     13.1 BASF SE

13.1.1 Company Overview

13.1.2 Financial

13.1.3 Products/ Services Offered

13.1.4 SWOT Analysis

    13.2 Bayer AG (Bayer CropScience)

13.2.1 Company Overview

13.2.2 Financial

13.2.3 Products/ Services Offered

13.2.4 SWOT Analysis

   13.3 Syngenta Group

13.3.1 Company Overview

13.3.2 Financial

13.3.3 Products/ Services Offered

13.3.4 SWOT Analysis

  13.4 Corteva Agriscience

13.4.1 Company Overview

13.4.2 Financial

13.4.3 Products/ Services Offered

13.4.4 SWOT Analysis

  13.5 FMC Corporation

13.5.1 Company Overview

13.5.2 Financial

13.5.3 Products/ Services Offered

13.5.4 SWOT Analysis

  13.6 UPL Limited

13.6.1 Company Overview

13.6.2 Financial

13.6.3 Products/ Services Offered

13.6.4 SWOT Analysis

 13.7 Sumitomo Chemical Co., Ltd.

13.7.1 Company Overview

13.7.2 Financial

13.7.3 Products/ Services Offered

13.7.4 SWOT Analysis

 13.8 Nufarm Ltd.

13.8.1 Company Overview

13.8.2 Financial

13.8.3 Products/ Services Offered

13.8.4 SWOT Analysis

 13.9 American Vanguard Corporation

13.9.1 Company Overview

13.9.2 Financial

13.9.3 Products/ Services Offered

13.9.4 SWOT Analysis

  13.10 ADAMA Agricultural Solutions Ltd.

13.10.1 Company Overview

13.10.2 Financial

13.10.3 Products/ Services Offered

13.10.4 SWOT Analysis

14. Use Cases and Best Practices

15. Conclusion

An accurate research report requires proper strategizing as well as implementation. There are multiple factors involved in the completion of good and accurate research report and selecting the best methodology to compete the research is the toughest part. Since the research reports we provide play a crucial role in any company’s decision-making process, therefore we at SNS Insider always believe that we should choose the best method which gives us results closer to reality. This allows us to reach at a stage wherein we can provide our clients best and accurate investment to output ratio.

Each report that we prepare takes a timeframe of 350-400 business hours for production. Starting from the selection of titles through a couple of in-depth brain storming session to the final QC process before uploading our titles on our website we dedicate around 350 working hours. The titles are selected based on their current market cap and the foreseen CAGR and growth.


The 5 steps process:

Step 1: Secondary Research:

Secondary Research or Desk Research is as the name suggests is a research process wherein, we collect data through the readily available information. In this process we use various paid and unpaid databases which our team has access to and gather data through the same. This includes examining of listed companies’ annual reports, Journals, SEC filling etc. Apart from this our team has access to various associations across the globe across different industries. Lastly, we have exchange relationships with various university as well as individual libraries.

Secondary Research

Step 2: Primary Research

When we talk about primary research, it is a type of study in which the researchers collect relevant data samples directly, rather than relying on previously collected data.  This type of research is focused on gaining content specific facts that can be sued to solve specific problems. Since the collected data is fresh and first hand therefore it makes the study more accurate and genuine.

We at SNS Insider have divided Primary Research into 2 parts.

Part 1 wherein we interview the KOLs of major players as well as the upcoming ones across various geographic regions. This allows us to have their view over the market scenario and acts as an important tool to come closer to the accurate market numbers. As many as 45 paid and unpaid primary interviews are taken from both the demand and supply side of the industry to make sure we land at an accurate judgement and analysis of the market.

This step involves the triangulation of data wherein our team analyses the interview transcripts, online survey responses and observation of on filed participants. The below mentioned chart should give a better understanding of the part 1 of the primary interview.

Primary Research

Part 2: In this part of primary research the data collected via secondary research and the part 1 of the primary research is validated with the interviews from individual consultants and subject matter experts.

Consultants are those set of people who have at least 12 years of experience and expertise within the industry whereas Subject Matter Experts are those with at least 15 years of experience behind their back within the same space. The data with the help of two main processes i.e., FGDs (Focused Group Discussions) and IDs (Individual Discussions). This gives us a 3rd party nonbiased primary view of the market scenario making it a more dependable one while collation of the data pointers.

Step 3: Data Bank Validation

Once all the information is collected via primary and secondary sources, we run that information for data validation. At our intelligence centre our research heads track a lot of information related to the market which includes the quarterly reports, the daily stock prices, and other relevant information. Our data bank server gets updated every fortnight and that is how the information which we collected using our primary and secondary information is revalidated in real time.

Data Bank Validation

Step 4: QA/QC Process

After all the data collection and validation our team does a final level of quality check and quality assurance to get rid of any unwanted or undesired mistakes. This might include but not limited to getting rid of the any typos, duplication of numbers or missing of any important information. The people involved in this process include technical content writers, research heads and graphics people. Once this process is completed the title gets uploader on our platform for our clients to read it.

Step 5: Final QC/QA Process:

This is the last process and comes when the client has ordered the study. In this process a final QA/QC is done before the study is emailed to the client. Since we believe in giving our clients a good experience of our research studies, therefore, to make sure that we do not lack at our end in any way humanly possible we do a final round of quality check and then dispatch the study to the client.

Key Segments:

By Source

  • Synthetic

  • Bio-based

By Product Type

  • Insecticide

  • Fungicide & Bactericides

  • Herbicide

  • Others

By Crop Type

  • Cereals & Grains

  • Fruits & Vegetables

  • Oilseeds & Pulses

  • Others

By Form

  • Liquid

  • Dry

By Mode of Application

  • Seed Treatment

  • Soil Treatment

  • Foliar Spray

  • Others

Request for Segment Customization as per your Business Requirement: Segment Customization Request

Regional Coverage:

North America

  • US

  • Canada

  • Mexico

Europe

  • Eastern Europe

    • Poland

    • Romania

    • Hungary

    • Turkey

    • Rest of Eastern Europe

  • Western Europe

    • Germany

    • France

    • UK

    • Italy

    • Spain

    • Netherlands

    • Switzerland

    • Austria

    • Rest of Western Europe

Asia Pacific

  • China

  • India

  • Japan

  • South Korea

  • Vietnam

  • Singapore

  • Australia

  • Rest of Asia Pacific

Middle East & Africa

  • Middle East

    • UAE

    • Egypt

    • Saudi Arabia

    • Qatar

    • Rest of Middle East

  • Africa

    • Nigeria

    • South Africa

    • Rest of Africa

Latin America

  • Brazil

  • Argentina

  • Colombia

  • Rest of Latin America

Request for Country Level Research Report: Country Level Customization Request

Available Customization

With the given market data, SNS Insider offers customization as per the company’s specific needs. The following customization options are available for the report:

  • Detailed Volume Analysis

  • Criss-Cross segment analysis (e.g. Product X Application)

  • Competitive Product Benchmarking

  • Geographic Analysis

  • Additional countries in any of the regions

  • Customized Data Representation

  • Detailed analysis and profiling of additional market players


  •            5000 (33% Discount)


  •            8950 (40% Discount)


  •            3050 (23% Discount)

Start a Conversation

Hi! Click one of our member below to chat on Phone