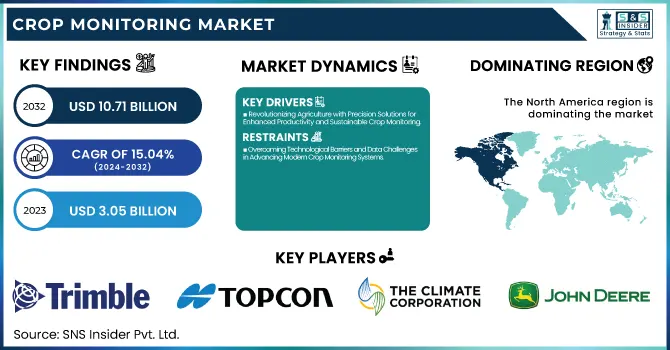
The Crop Monitoring Market Size was valued at USD 3.05 billion in 2023 and is expected to reach USD 10.71 billion by 2032, growing at a CAGR of 15.04% over the forecast period 2024-2032. Crop monitoring is an overall area where the market is changing at a fast pace, thanks to the innovative progress across various parameters. Adoption and Usage Metrics show deploying more sensors, drones, and precision farming tools to improve crop health monitoring. Data and Connectivity Metrics Centers land all the IoT data on a seamless cloud integration platform and facilitate near real-time data abstracted away from the IoT by using cloud computing capabilities for decision-making.
To Get more information on Crop Monitoring Market - Request Free Sample Report
Measuring Farmer Engagement and Satisfaction stresses training, ease of use, and customer service to drive adoption On the other hand, the Operational Efficiency Metrics tracks improvements in coverage in the field, response times to alerts, and predictive analytics for yield management. All of these are contributing towards improved productivity, resource use efficiency, and sustainable agricultural practices.
Key Drivers:
Revolutionizing Agriculture with Precision Solutions for Enhanced Productivity and Sustainable Crop Monitoring
Inspired by the various aspects of modern agriculture, the impenetrable drivers of the crop monitoring market. The growing need for precision farming solutions that can improve productivity and resource utilization is one of the major factors driving the market. As the population increases and food security more critical, farmers more and more are adopting modern monitoring systems to maximize growth, soil health, and water utilization efficiency. Furthermore, the increasing convergence of IoT, AI, and remote sensing technologies has transformed crop monitoring through real-time data availability and actionable insights. Drones, GPS systems, and automated sensors provide farmers with the data necessary to minimize expenses and maximize yield based on information-driven decision-making. Furthermore, market growth is also driven by government initiatives that promote smart farming practices and sustainable concentration of agriculture.
Restrain:
Overcoming Technological Barriers and Data Challenges in Advancing Modern Crop Monitoring Systems
A major obstacle is integrating different technologies such as sensors, drones, and data analytics platforms into traditional farming practices. Farmers especially in developing areas of the world may not have the technical know-how to operate and manage these systems properly. This lack of information can be a bottleneck slowing the adoption rate and therefore market growth. Data management problems are also a huge challenge. Crop monitoring systems create massive amounts of data that need to be stored, analyzed, and interpreted effectively. These solutions would lose their significance as insights cannot be extracted without proper data management tools in place.
Opportunity:
Unlocking Growth Opportunities in Crop Monitoring with Automation Digital Tech and Precision Farming
The growth opportunities in this market are immense, especially with more and more farmers starting to automate their farming with robots. Autonomous tractors, robotic harvesters, and automated irrigation technologies are finding a footing with large-scale commercial and industrial farming. The growing dependence on paleoclimate for settlement plans also opens up fresh new options in precision farming via satellite imagery, climate forecasting tools, and advanced analytics. Farmers in emerging markets within developing regions also present growth opportunities as the need for efficient solutions to address climate change, erratic weather and a lack of resources affords them opportunities. The agricultural industry is being transformed through digital tech, and so it is likely that the crop monitoring market will continue to grow.
Challenges:
Addressing Infrastructure Gaps and Environmental Challenges to Enhance Crop Monitoring System Efficiency
The other major challenge is the lack of infrastructure in remote and rural farming areas. The efficiency of these remote monitoring systems may be inhibited by poor connectivity and/or the limited ability to visually transmit data in real time that are only available on digital networks. On top of that, environmental uncertainties like unpredictable weather, soil variability, and pest infestations further limit the potential of monitoring tools. Such reasons result in inconsistencies in data collection, thereby lowering the dependability of the insights provided by the crop monitoring systems. Addressing these hurdles will demand higher levels of investment to educate farmers, better solutions for connectivity, and a more resilient system against environmental uncertainties.
By Offering
Hardware dominated the crop monitoring market with a 52.8% share in 2023 and is projected to grow at the fastest CAGR from 2024 to 2032. The increase is attributed to the growing uptake of high-tech equipment including sensors, drones, GPS devices, and automated irrigation systems that improve precision agriculture. Using these hardware options, farmers can monitor the productivity of soil, the health of their crops, and weather patterns, all in real-time, guiding their decisions with facts. Moreover, the rise of IoT devices and remote sensing technologies enabled more precise and efficient crop monitoring tools. This increasing demand for capable and long-lasting hardware is also fueled by the use of automation and robotics in large-scale farms, with farms now operating enormous acreages. With the progress of digital transformation over the years and the availability of optimal hardware solutions, it is anticipated that the farming sector will improve productivity and efficient resource utilization, additionally with better harvest efficiency.
By Technology
Sensing & Imagery held the majority share of 44.8% in 2023 propelled by the growing utilization of remote sensing technologies, drones, and satellite imagery. They offer accurate information such as the state of crops or soil, and also the environment, that can be used to take action as necessary promptly. The decision-making process majorly benefits from the ability to collect real-time field data, thus sensing & imagery have become the go-to solution for precision farming practices.
Automation and Robotics are expected to grow at the fastest CAGR from 2024 to 2032. Increasing the adoption of autonomous tractors, robotic harvesters, and automated irrigation systems is forever changing the landscape of industrial farms. It eliminates reliance on labor to a great extent, facilitates faster operations, and improves productivity. Advancements in automation will continue to spur adoption into precision agriculture, where the field is forecast to see robust growth in the next few years.
By Farm Type
In 2023, the crop monitoring market was dominated by medium-sized farms, accounting for 38.7% of the total market share as the adoption of precision farming technologies continues to grow within this segment. Medium to large-scale farmers are now adopting advanced monitoring devices to gain insights leading to better resource efficiency, higher productivity, and reduced crop loss. These farms are adopting sensors, drones, and data analytics platforms to make better decisions and reach higher yields.
Due to growing size, large farms have been projected to grow at the fastest CAGR from 2024 to 2032. This increase is fuelled by the enhanced adoption of automation, robots, and smart IoT-based solutions in the large-scale agricultural industry. Large farms in the field might need complex monitoring systems to measure a huge amount of land successfully. As these farms center around large-scale production, and reduce risk to operational conservancy and sustainability, the demand for high-performance hardware and data-driven insights increases simultaneously.
By Application
The crop monitoring market based on type was dominated by crop scouting and monitoring and it accounted for a share of 24.9% share in 2023, and this is due to the increased demand for real-time field information growing over time. Crop scouting solutions are gaining popularity among farmers, as they help monitor and detect pests, diseases, and nutrient deficiencies early. Disruptive technologies in farm management receive good news from drones and sensors to satellite imagery to ensure crop health monitoring for timely intervention which in turn, results in productivity and loss reduction.
Yield mapping and monitoring is projected to have the highest CAGR from 2024 to 2032. The increasing preference for GPS-based mapping tools and the data analytics solutions that enable farmers to analyze yield variability for a zone within the field is anticipated to bolster this growth. This information can help farmers make better use of their resources, leading to more optimal farm efficiency, and maximizing output from their crops.
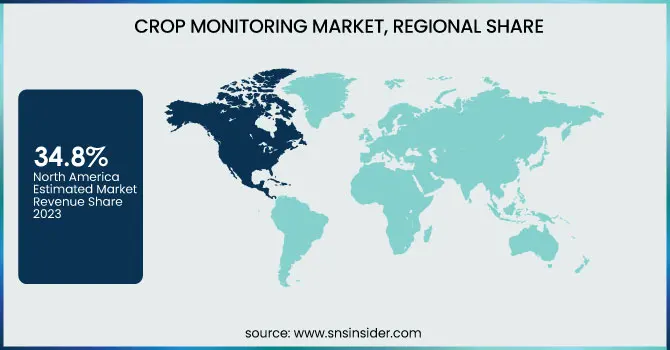
In 2023, North America led the crop monitoring market, accounting for a 34.8% share, owing to the high adoption of precision farming technologies and well-established agricultural infrastructure. Market growth has been spurred on by progressive farming practices as well as investments in smart agriculture solutions within the region. As an example, the crop monitoring systems of AgEagle Aerial Systems, Precision Hawk, etc. have been increasingly adopted in the United States, bringing useful data about a field for farmers in real time via drones. Moreover, the increasing emphasis on sustainable agriculture in Canada is supporting the adoption of IoT-based sensors and weather monitoring systems to achieve desired productivity with minimum environmental impact.
Asia Pacific is expected to grow at the fastest CAGR from 2024 to 2032, owing to growing food consumption, increasing pace of agricultural activities, and a surge of government projects for smart farming. So, countries such as India and China are increasingly embracing precision agriculture solutions to enhance crop yields as well as meet food security challenges. As an example, in China XAG is using drones and automation for precise pesticide spraying and mapping fields. Likewise, in India, companies such as Fasal and DeHaat have started providing farmers with data-driven insights so that they can make informed decisions to ensure those crops remain healthy and productive.
Get Customized Report as per Your Business Requirement - Enquiry Now
Some of the major players in the Crop Monitoring Market are:
Trimble (Guidance Control, Crop Monitoring Software)
Topcon Corporation (GNSS Receivers, Crop Sensors)
The Climate Corporation (Climate FieldView, Seed Advisor)
CropX Technologies (Soil Sensor, Irrigation Optimization Platform)
Yara International (AtFarm, YaraIrix)
Stenon (Real-Time Soil Analysis Sensor, Soil Health Monitoring System)
Instacrops (InstaFrost, InstaWeather)
EOS Data Analytics (EOSDA Crop Monitoring, EOS SAT-1)
Solinftec (Alice AI Assistant, Solix Ag Robotics)
Crop Analytica (IoT-Based Agriculture Monitoring System, AI-Driven Analytics Platform)
Pixxel (Hyperspectral Imaging Satellites, Satellite Data Analytics Platform)
NatureMetrics (Environmental DNA Monitoring, Biodiversity Assessment Tools)
John Deere (See & Spray Technology, Operations Center)
Ag Leader Technology (InCommand Displays, AgFiniti Cloud Platform)
Raven Industries (Viper 4+ Field Computer, Slingshot Data Management System)
In February 2025, Topcon Agriculture partnered with Bonsai Robotics to enhance precision farming for permanent crops by integrating autonomous navigation and smart implement controls, improving efficiency and sustainability.
In January 2025, Pixxel is set to launch India's first private satellite network, aiming to tap into the USD 19 billion satellite data services market. The company's hyperspectral imaging satellites will enhance Earth monitoring for sectors like agriculture, defense, and infrastructure.
| Report Attributes | Details |
|---|---|
| Market Size in 2023 | USD 3.05 Billion |
| Market Size by 2032 | USD 10.71 Billion |
| CAGR | CAGR of 15.04% From 2024 to 2032 |
| Base Year | 2023 |
| Forecast Period | 2024-2032 |
| Historical Data | 2020-2022 |
| Report Scope & Coverage | Market Size, Segments Analysis, Competitive Landscape, Regional Analysis, DROC & SWOT Analysis, Forecast Outlook |
| Key Segments | • By Offering (Hardware, Software, Services) • By Technology (Sensing and Imagery, Variable Rate Technology, Automation and Robotics) • By Farm Type (Small, Medium, Large) • By Application (Field mapping, Crop scouting and monitoring, Soil monitoring, Yield mapping and monitoring, Variable rate application, Weather tracking and forecasting, Others) |
| Regional Analysis/Coverage | North America (US, Canada, Mexico), Europe (Eastern Europe [Poland, Romania, Hungary, Turkey, Rest of Eastern Europe] Western Europe] Germany, France, UK, Italy, Spain, Netherlands, Switzerland, Austria, Rest of Western Europe]), Asia Pacific (China, India, Japan, South Korea, Vietnam, Singapore, Australia, Rest of Asia Pacific), Middle East & Africa (Middle East [UAE, Egypt, Saudi Arabia, Qatar, Rest of Middle East], Africa [Nigeria, South Africa, Rest of Africa], Latin America (Brazil, Argentina, Colombia, Rest of Latin America) |
| Company Profiles | Trimble, Topcon Corporation, The Climate Corporation, CropX Technologies, Yara International, Stenon, Instacrops, EOS Data Analytics, Solinftec, Crop Analytica, Pixxel, NatureMetrics, John Deere, Ag Leader Technology, Raven Industries. |
Ans: The Crop Monitoring Market is expected to grow at a CAGR of 15.04% during 2024-2032.
Ans: Crop Monitoring Market size was USD 3.05 billion in 2023 and is expected to Reach USD 10.71 billion by 2032.
Ans: The major growth factor of the crop monitoring market is the increasing adoption of precision farming technologies to enhance crop productivity, optimize resource usage, and improve decision-making through real-time data insights.
Ans: The Medium segment dominated the Crop Monitoring Market in 2023.
Ans: North America dominated the Crop Monitoring Market in 2023.
1. Introduction
1.1 Market Definition
1.2 Scope (Inclusion and Exclusions)
1.3 Research Assumptions
2. Executive Summary
2.1 Market Overview
2.2 Regional Synopsis
2.3 Competitive Summary
3. Research Methodology
3.1 Top-Down Approach
3.2 Bottom-up Approach
3.3. Data Validation
3.4 Primary Interviews
4. Market Dynamics Impact Analysis
4.1 Market Driving Factors Analysis
4.1.1 Drivers
4.1.2 Restraints
4.1.3 Opportunity
4.1.4 Challenges
4.2 PESTLE Analysis
4.3 Porter’s Five Forces Model
5. Statistical Insights and Trends Reporting
5.1 Adoption and Usage Metrics
5.2 Data and Connectivity Metrics
5.3 Farmer Engagement and Satisfaction Metrics
5.4 Operational Efficiency Metrics
6. Competitive Landscape
6.1 List of Major Companies, By Region
6.2 Market Share Analysis, By Region
6.3 Product Benchmarking
6.3.1 Product specifications and features
6.3.2 Pricing
6.4 Strategic Initiatives
6.4.1 Marketing and promotional activities
6.4.2 Distribution and Supply Chain Strategies
6.4.3 Expansion plans and new product launches
6.4.4 Strategic partnerships and collaborations
6.5 Technological Advancements
6.6 Market Positioning and Branding
7. Crop Monitoring Market Segmentation, By Offering
7.1 Chapter Overview
7.2 Hardware
7.2.1 Hardware Market Trends Analysis (2020-2032)
7.2.2 Hardware Market Size Estimates and Forecasts to 2032 (USD Billion)
7.3 Software
7.3.1 Software Market Trends Analysis (2020-2032)
7.3.2 Software Market Size Estimates and Forecasts to 2032 (USD Billion)
7.4 Services
7.4.1 Services Market Trends Analysis (2020-2032)
7.4.2 Services Market Size Estimates and Forecasts to 2032 (USD Billion)
8. Crop Monitoring Market Segmentation, By Technology
8.1 Chapter Overview
8.2 Sensing and Imagery
8.2.1 Sensing and Imagery Market Trends Analysis (2020-2032)
8.2.2 Sensing and Imagery Market Size Estimates and Forecasts to 2032 (USD Billion)
8.3 Variable Rate Technology
8.3.1 Variable Rate Technology Market Trends Analysis (2020-2032)
8.3.2 Variable Rate Technology Market Size Estimates and Forecasts to 2032 (USD Billion)
8.4 Automation and Robotics
8.4.1 Automation and Robotics Market Trends Analysis (2020-2032)
8.4.2 Automation and Robotics Market Size Estimates and Forecasts to 2032 (USD Billion)
9. Crop Monitoring Market Segmentation, By Farm Type
9.1 Chapter Overview
9.2 Small
9.2.1 Small Market Trends Analysis (2020-2032)
9.2.2 Small Market Size Estimates and Forecasts to 2032 (USD Billion)
9.3 Medium
9.3.1 Medium Market Trends Analysis (2020-2032)
9.3.2 Medium Market Size Estimates and Forecasts to 2032 (USD Billion)
9.4 Large
9.4.1 Large Market Trends Analysis (2020-2032)
9.4.2 Large Market Size Estimates and Forecasts to 2032 (USD Billion)
10. Crop Monitoring Market Segmentation, By Application
10.1 Chapter Overview
10.2 Field mapping
10.2.1 Field mapping Market Trends Analysis (2020-2032)
10.2.2 Field mapping Market Size Estimates and Forecasts to 2032 (USD Billion)
10.3 Crop scouting and monitoring
10.3.1 Crop scouting and monitoring Market Trends Analysis (2020-2032)
10.3.2 Crop scouting and monitoring Market Size Estimates and Forecasts to 2032 (USD Billion)
10.4 Soil monitoring
10.4.1 Soil monitoring Market Trends Analysis (2020-2032)
10.4.2 Soil monitoring Market Size Estimates and Forecasts to 2032 (USD Billion)
10.5 Yield mapping and monitoring
10.5.1 Yield mapping and monitoring Market Trends Analysis (2020-2032)
10.5.2 Yield mapping and monitoring Market Size Estimates and Forecasts to 2032 (USD Billion)
10.6 Variable rate application
10.6.1 Variable rate application Market Trends Analysis (2020-2032)
10.6.2 Variable rate application Market Size Estimates and Forecasts to 2032 (USD Billion)
10.7 Weather tracking and forecasting
10.7.1 Weather tracking and forecasting Market Trends Analysis (2020-2032)
10.7.2 Weather tracking and forecasting Market Size Estimates and Forecasts to 2032 (USD Billion)
10.8 Others
10.8.1 Others Market Trends Analysis (2020-2032)
10.8.2 Others Market Size Estimates and Forecasts to 2032 (USD Billion)
11. Regional Analysis
11.1 Chapter Overview
11.2 North America
11.2.1 Trends Analysis
11.2.2 North America Crop Monitoring Market Estimates and Forecasts, by Country (2020-2032) (USD Billion)
11.2.3 North America Crop Monitoring Market Estimates and Forecasts, By Offering (2020-2032) (USD Billion)
11.2.4 North America Crop Monitoring Market Estimates and Forecasts, By Technology (2020-2032) (USD Billion)
11.2.5 North America Crop Monitoring Market Estimates and Forecasts, By Farm Type (2020-2032) (USD Billion)
11.2.6 North America Crop Monitoring Market Estimates and Forecasts, By Application (2020-2032) (USD Billion)
11.2.7 USA
11.2.7.1 USA Crop Monitoring Market Estimates and Forecasts, By Offering (2020-2032) (USD Billion)
11.2.7.2 USA Crop Monitoring Market Estimates and Forecasts, By Technology (2020-2032) (USD Billion)
11.2.7.3 USA Crop Monitoring Market Estimates and Forecasts, By Farm Type (2020-2032) (USD Billion)
11.2.7.4 USA Crop Monitoring Market Estimates and Forecasts, By Application (2020-2032) (USD Billion)
11.2.8 Canada
11.2.8.1 Canada Crop Monitoring Market Estimates and Forecasts, By Offering (2020-2032) (USD Billion)
11.2.8.2 Canada Crop Monitoring Market Estimates and Forecasts, By Technology (2020-2032) (USD Billion)
11.2.8.3 Canada Crop Monitoring Market Estimates and Forecasts, By Farm Type (2020-2032) (USD Billion)
11.2.8.4 Canada Crop Monitoring Market Estimates and Forecasts, By Application (2020-2032) (USD Billion)
11.2.9 Mexico
11.2.9.1 Mexico Crop Monitoring Market Estimates and Forecasts, By Offering (2020-2032) (USD Billion)
11.2.9.2 Mexico Crop Monitoring Market Estimates and Forecasts, By Technology (2020-2032) (USD Billion)
11.2.9.3 Mexico Crop Monitoring Market Estimates and Forecasts, By Farm Type (2020-2032) (USD Billion)
11.2.9.4 Mexico Crop Monitoring Market Estimates and Forecasts, By Application (2020-2032) (USD Billion)
11.3 Europe
11.3.1 Eastern Europe
11.3.1.1 Trends Analysis
11.3.1.2 Eastern Europe Crop Monitoring Market Estimates and Forecasts, by Country (2020-2032) (USD Billion)
11.3.1.3 Eastern Europe Crop Monitoring Market Estimates and Forecasts, By Offering (2020-2032) (USD Billion)
11.3.1.4 Eastern Europe Crop Monitoring Market Estimates and Forecasts, By Technology (2020-2032) (USD Billion)
11.3.1.5 Eastern Europe Crop Monitoring Market Estimates and Forecasts, By Farm Type (2020-2032) (USD Billion)
11.3.1.6 Eastern Europe Crop Monitoring Market Estimates and Forecasts, By Application (2020-2032) (USD Billion)
11.3.1.7 Poland
11.3.1.7.1 Poland Crop Monitoring Market Estimates and Forecasts, By Offering (2020-2032) (USD Billion)
11.3.1.7.2 Poland Crop Monitoring Market Estimates and Forecasts, By Technology (2020-2032) (USD Billion)
11.3.1.7.3 Poland Crop Monitoring Market Estimates and Forecasts, By Farm Type (2020-2032) (USD Billion)
11.3.1.7.4 Poland Crop Monitoring Market Estimates and Forecasts, By Application (2020-2032) (USD Billion)
11.3.1.8 Romania
11.3.1.8.1 Romania Crop Monitoring Market Estimates and Forecasts, By Offering (2020-2032) (USD Billion)
11.3.1.8.2 Romania Crop Monitoring Market Estimates and Forecasts, By Technology (2020-2032) (USD Billion)
11.3.1.8.3 Romania Crop Monitoring Market Estimates and Forecasts, By Farm Type (2020-2032) (USD Billion)
11.3.1.8.4 Romania Crop Monitoring Market Estimates and Forecasts, By Application (2020-2032) (USD Billion)
11.3.1.9 Hungary
11.3.1.9.1 Hungary Crop Monitoring Market Estimates and Forecasts, By Offering (2020-2032) (USD Billion)
11.3.1.9.2 Hungary Crop Monitoring Market Estimates and Forecasts, By Technology (2020-2032) (USD Billion)
11.3.1.9.3 Hungary Crop Monitoring Market Estimates and Forecasts, By Farm Type (2020-2032) (USD Billion)
11.3.1.9.4 Hungary Crop Monitoring Market Estimates and Forecasts, By Application (2020-2032) (USD Billion)
11.3.1.10 turkey
11.3.1.10.1 Turkey Crop Monitoring Market Estimates and Forecasts, By Offering (2020-2032) (USD Billion)
11.3.1.10.2 Turkey Crop Monitoring Market Estimates and Forecasts, By Technology (2020-2032) (USD Billion)
11.3.1.10.3 Turkey Crop Monitoring Market Estimates and Forecasts, By Farm Type (2020-2032) (USD Billion)
11.3.1.10.4 Turkey Crop Monitoring Market Estimates and Forecasts, By Application (2020-2032) (USD Billion)
11.3.1.11 Rest of Eastern Europe
11.3.1.11.1 Rest of Eastern Europe Crop Monitoring Market Estimates and Forecasts, By Offering (2020-2032) (USD Billion)
11.3.1.11.2 Rest of Eastern Europe Crop Monitoring Market Estimates and Forecasts, By Technology (2020-2032) (USD Billion)
11.3.1.11.3 Rest of Eastern Europe Crop Monitoring Market Estimates and Forecasts, By Farm Type (2020-2032) (USD Billion)
11.3.1.11.4 Rest of Eastern Europe Crop Monitoring Market Estimates and Forecasts, By Application (2020-2032) (USD Billion)
11.3.2 Western Europe
11.3.2.1 Trends Analysis
11.3.2.2 Western Europe Crop Monitoring Market Estimates and Forecasts, by Country (2020-2032) (USD Billion)
11.3.2.3 Western Europe Crop Monitoring Market Estimates and Forecasts, By Offering (2020-2032) (USD Billion)
11.3.2.4 Western Europe Crop Monitoring Market Estimates and Forecasts, By Technology (2020-2032) (USD Billion)
11.3.2.5 Western Europe Crop Monitoring Market Estimates and Forecasts, By Farm Type (2020-2032) (USD Billion)
11.3.2.6 Western Europe Crop Monitoring Market Estimates and Forecasts, By Application (2020-2032) (USD Billion)
11.3.2.7 Germany
11.3.2.7.1 Germany Crop Monitoring Market Estimates and Forecasts, By Offering (2020-2032) (USD Billion)
11.3.2.7.2 Germany Crop Monitoring Market Estimates and Forecasts, By Technology (2020-2032) (USD Billion)
11.3.2.7.3 Germany Crop Monitoring Market Estimates and Forecasts, By Farm Type (2020-2032) (USD Billion)
11.3.2.7.4 Germany Crop Monitoring Market Estimates and Forecasts, By Application (2020-2032) (USD Billion)
11.3.2.8 France
11.3.2.8.1 France Crop Monitoring Market Estimates and Forecasts, By Offering (2020-2032) (USD Billion)
11.3.2.8.2 France Crop Monitoring Market Estimates and Forecasts, By Technology (2020-2032) (USD Billion)
11.3.2.8.3 France Crop Monitoring Market Estimates and Forecasts, By Farm Type (2020-2032) (USD Billion)
11.3.2.8.4 France Crop Monitoring Market Estimates and Forecasts, By Application (2020-2032) (USD Billion)
11.3.2.9 UK
11.3.2.9.1 UK Crop Monitoring Market Estimates and Forecasts, By Offering (2020-2032) (USD Billion)
11.3.2.9.2 UK Crop Monitoring Market Estimates and Forecasts, By Technology (2020-2032) (USD Billion)
11.3.2.9.3 UK Crop Monitoring Market Estimates and Forecasts, By Farm Type (2020-2032) (USD Billion)
11.3.2.9.4 UK Crop Monitoring Market Estimates and Forecasts, By Application (2020-2032) (USD Billion)
11.3.2.10 Italy
11.3.2.10.1 Italy Crop Monitoring Market Estimates and Forecasts, By Offering (2020-2032) (USD Billion)
11.3.2.10.2 Italy Crop Monitoring Market Estimates and Forecasts, By Technology (2020-2032) (USD Billion)
11.3.2.10.3 Italy Crop Monitoring Market Estimates and Forecasts, By Farm Type (2020-2032) (USD Billion)
11.3.2.10.4 Italy Crop Monitoring Market Estimates and Forecasts, By Application (2020-2032) (USD Billion)
11.3.2.11 Spain
11.3.2.11.1 Spain Crop Monitoring Market Estimates and Forecasts, By Offering (2020-2032) (USD Billion)
11.3.2.11.2 Spain Crop Monitoring Market Estimates and Forecasts, By Technology (2020-2032) (USD Billion)
11.3.2.11.3 Spain Crop Monitoring Market Estimates and Forecasts, By Farm Type (2020-2032) (USD Billion)
11.3.2.11.4 Spain Crop Monitoring Market Estimates and Forecasts, By Application (2020-2032) (USD Billion)
11.3.2.12 Netherlands
11.3.2.12.1 Netherlands Crop Monitoring Market Estimates and Forecasts, By Offering (2020-2032) (USD Billion)
11.3.2.12.2 Netherlands Crop Monitoring Market Estimates and Forecasts, By Technology (2020-2032) (USD Billion)
11.3.2.12.3 Netherlands Crop Monitoring Market Estimates and Forecasts, By Farm Type (2020-2032) (USD Billion)
11.3.2.12.4 Netherlands Crop Monitoring Market Estimates and Forecasts, By Application (2020-2032) (USD Billion)
11.3.2.13 Switzerland
11.3.2.13.1 Switzerland Crop Monitoring Market Estimates and Forecasts, By Offering (2020-2032) (USD Billion)
11.3.2.13.2 Switzerland Crop Monitoring Market Estimates and Forecasts, By Technology (2020-2032) (USD Billion)
11.3.2.13.3 Switzerland Crop Monitoring Market Estimates and Forecasts, By Farm Type (2020-2032) (USD Billion)
11.3.2.13.4 Switzerland Crop Monitoring Market Estimates and Forecasts, By Application (2020-2032) (USD Billion)
11.3.2.14 Austria
11.3.2.14.1 Austria Crop Monitoring Market Estimates and Forecasts, By Offering (2020-2032) (USD Billion)
11.3.2.14.2 Austria Crop Monitoring Market Estimates and Forecasts, By Technology (2020-2032) (USD Billion)
11.3.2.14.3 Austria Crop Monitoring Market Estimates and Forecasts, By Farm Type (2020-2032) (USD Billion)
11.3.2.14.4 Austria Crop Monitoring Market Estimates and Forecasts, By Application (2020-2032) (USD Billion)
11.3.2.15 Rest of Western Europe
11.3.2.15.1 Rest of Western Europe Crop Monitoring Market Estimates and Forecasts, By Offering (2020-2032) (USD Billion)
11.3.2.15.2 Rest of Western Europe Crop Monitoring Market Estimates and Forecasts, By Technology (2020-2032) (USD Billion)
11.3.2.15.3 Rest of Western Europe Crop Monitoring Market Estimates and Forecasts, By Farm Type (2020-2032) (USD Billion)
11.3.2.15.4 Rest of Western Europe Crop Monitoring Market Estimates and Forecasts, By Application (2020-2032) (USD Billion)
11.4 Asia Pacific
11.4.1 Trends Analysis
11.4.2 Asia Pacific Crop Monitoring Market Estimates and Forecasts, by Country (2020-2032) (USD Billion)
11.4.3 Asia Pacific Crop Monitoring Market Estimates and Forecasts, By Offering (2020-2032) (USD Billion)
11.4.4 Asia Pacific Crop Monitoring Market Estimates and Forecasts, By Technology (2020-2032) (USD Billion)
11.4.5 Asia Pacific Crop Monitoring Market Estimates and Forecasts, By Farm Type (2020-2032) (USD Billion)
11.4.6 Asia Pacific Crop Monitoring Market Estimates and Forecasts, By Application (2020-2032) (USD Billion)
11.4.7 China
11.4.7.1 China Crop Monitoring Market Estimates and Forecasts, By Offering (2020-2032) (USD Billion)
11.4.7.2 China Crop Monitoring Market Estimates and Forecasts, By Technology (2020-2032) (USD Billion)
11.4.7.3 China Crop Monitoring Market Estimates and Forecasts, By Farm Type (2020-2032) (USD Billion)
11.4.7.4 China Crop Monitoring Market Estimates and Forecasts, By Application (2020-2032) (USD Billion)
11.4.8 India
11.4.8.1 India Crop Monitoring Market Estimates and Forecasts, By Offering (2020-2032) (USD Billion)
11.4.8.2 India Crop Monitoring Market Estimates and Forecasts, By Technology (2020-2032) (USD Billion)
11.4.8.3 India Crop Monitoring Market Estimates and Forecasts, By Farm Type (2020-2032) (USD Billion)
11.4.8.4 India Crop Monitoring Market Estimates and Forecasts, By Application (2020-2032) (USD Billion)
11.4.9 Japan
11.4.9.1 Japan Crop Monitoring Market Estimates and Forecasts, By Offering (2020-2032) (USD Billion)
11.4.9.2 Japan Crop Monitoring Market Estimates and Forecasts, By Technology (2020-2032) (USD Billion)
11.4.9.3 Japan Crop Monitoring Market Estimates and Forecasts, By Farm Type (2020-2032) (USD Billion)
11.4.9.4 Japan Crop Monitoring Market Estimates and Forecasts, By Application (2020-2032) (USD Billion)
11.4.10 South Korea
11.4.10.1 South Korea Crop Monitoring Market Estimates and Forecasts, By Offering (2020-2032) (USD Billion)
11.4.10.2 South Korea Crop Monitoring Market Estimates and Forecasts, By Technology (2020-2032) (USD Billion)
11.4.10.3 South Korea Crop Monitoring Market Estimates and Forecasts, By Farm Type (2020-2032) (USD Billion)
11.4.10.4 South Korea Crop Monitoring Market Estimates and Forecasts, By Application (2020-2032) (USD Billion)
11.4.11 Vietnam
11.4.11.1 Vietnam Crop Monitoring Market Estimates and Forecasts, By Offering (2020-2032) (USD Billion)
11.4.11.2 Vietnam Crop Monitoring Market Estimates and Forecasts, By Technology (2020-2032) (USD Billion)
11.4.11.3 Vietnam Crop Monitoring Market Estimates and Forecasts, By Farm Type (2020-2032) (USD Billion)
11.4.11.4 Vietnam Crop Monitoring Market Estimates and Forecasts, By Application (2020-2032) (USD Billion)
11.4.12 Singapore
11.4.12.1 Singapore Crop Monitoring Market Estimates and Forecasts, By Offering (2020-2032) (USD Billion)
11.4.12.2 Singapore Crop Monitoring Market Estimates and Forecasts, By Technology (2020-2032) (USD Billion)
11.4.12.3 Singapore Crop Monitoring Market Estimates and Forecasts, By Farm Type (2020-2032) (USD Billion)
11.4.12.4 Singapore Crop Monitoring Market Estimates and Forecasts, By Application (2020-2032) (USD Billion)
11.4.13 Australia
11.4.13.1 Australia Crop Monitoring Market Estimates and Forecasts, By Offering (2020-2032) (USD Billion)
11.4.13.2 Australia Crop Monitoring Market Estimates and Forecasts, By Technology (2020-2032) (USD Billion)
11.4.13.3 Australia Crop Monitoring Market Estimates and Forecasts, By Farm Type (2020-2032) (USD Billion)
11.4.13.4 Australia Crop Monitoring Market Estimates and Forecasts, By Application (2020-2032) (USD Billion)
11.4.14 Rest of Asia Pacific
11.4.14.1 Rest of Asia Pacific Crop Monitoring Market Estimates and Forecasts, By Offering (2020-2032) (USD Billion)
11.4.14.2 Rest of Asia Pacific Crop Monitoring Market Estimates and Forecasts, By Technology (2020-2032) (USD Billion)
11.4.14.3 Rest of Asia Pacific Crop Monitoring Market Estimates and Forecasts, By Farm Type (2020-2032) (USD Billion)
11.4.14.4 Rest of Asia Pacific Crop Monitoring Market Estimates and Forecasts, By Application (2020-2032) (USD Billion)
11.5 Middle East and Africa
11.5.1 Middle East
11.5.1.1 Trends Analysis
11.5.1.2 Middle East Crop Monitoring Market Estimates and Forecasts, by Country (2020-2032) (USD Billion)
11.5.1.3 Middle East Crop Monitoring Market Estimates and Forecasts, By Offering (2020-2032) (USD Billion)
11.5.1.4 Middle East Crop Monitoring Market Estimates and Forecasts, By Technology (2020-2032) (USD Billion)
11.5.1.5 Middle East Crop Monitoring Market Estimates and Forecasts, By Farm Type (2020-2032) (USD Billion)
11.5.1.6 Middle East Crop Monitoring Market Estimates and Forecasts, By Application (2020-2032) (USD Billion)
11.5.1.7 UAE
11.5.1.7.1 UAE Crop Monitoring Market Estimates and Forecasts, By Offering (2020-2032) (USD Billion)
11.5.1.7.2 UAE Crop Monitoring Market Estimates and Forecasts, By Technology (2020-2032) (USD Billion)
11.5.1.7.3 UAE Crop Monitoring Market Estimates and Forecasts, By Farm Type (2020-2032) (USD Billion)
11.5.1.7.4 UAE Crop Monitoring Market Estimates and Forecasts, By Application (2020-2032) (USD Billion)
11.5.1.8 Egypt
11.5.1.8.1 Egypt Crop Monitoring Market Estimates and Forecasts, By Offering (2020-2032) (USD Billion)
11.5.1.8.2 Egypt Crop Monitoring Market Estimates and Forecasts, By Technology (2020-2032) (USD Billion)
11.5.1.8.3 Egypt Crop Monitoring Market Estimates and Forecasts, By Farm Type (2020-2032) (USD Billion)
11.5.1.8.4 Egypt Crop Monitoring Market Estimates and Forecasts, By Application (2020-2032) (USD Billion)
11.5.1.9 Saudi Arabia
11.5.1.9.1 Saudi Arabia Crop Monitoring Market Estimates and Forecasts, By Offering (2020-2032) (USD Billion)
11.5.1.9.2 Saudi Arabia Crop Monitoring Market Estimates and Forecasts, By Technology (2020-2032) (USD Billion)
11.5.1.9.3 Saudi Arabia Crop Monitoring Market Estimates and Forecasts, By Farm Type (2020-2032) (USD Billion)
11.5.1.9.4 Saudi Arabia Crop Monitoring Market Estimates and Forecasts, By Application (2020-2032) (USD Billion)
11.5.1.10 Qatar
11.5.1.10.1 Qatar Crop Monitoring Market Estimates and Forecasts, By Offering (2020-2032) (USD Billion)
11.5.1.10.2 Qatar Crop Monitoring Market Estimates and Forecasts, By Technology (2020-2032) (USD Billion)
11.5.1.10.3 Qatar Crop Monitoring Market Estimates and Forecasts, By Farm Type (2020-2032) (USD Billion)
11.5.1.10.4 Qatar Crop Monitoring Market Estimates and Forecasts, By Application (2020-2032) (USD Billion)
11.5.1.11 Rest of Middle East
11.5.1.11.1 Rest of Middle East Crop Monitoring Market Estimates and Forecasts, By Offering (2020-2032) (USD Billion)
11.5.1.11.2 Rest of Middle East Crop Monitoring Market Estimates and Forecasts, By Technology (2020-2032) (USD Billion)
11.5.1.11.3 Rest of Middle East Crop Monitoring Market Estimates and Forecasts, By Farm Type (2020-2032) (USD Billion)
11.5.1.11.4 Rest of Middle East Crop Monitoring Market Estimates and Forecasts, By Application (2020-2032) (USD Billion)
11.5.2 Africa
11.5.2.1 Trends Analysis
11.5.2.2 Africa Crop Monitoring Market Estimates and Forecasts, by Country (2020-2032) (USD Billion)
11.5.2.3 Africa Crop Monitoring Market Estimates and Forecasts, By Offering (2020-2032) (USD Billion)
11.5.2.4 Africa Crop Monitoring Market Estimates and Forecasts, By Technology (2020-2032) (USD Billion)
11.5.2.5 Africa Crop Monitoring Market Estimates and Forecasts, By Farm Type (2020-2032) (USD Billion)
11.5.2.6 Africa Crop Monitoring Market Estimates and Forecasts, By Application (2020-2032) (USD Billion)
11.5.2.7 South Africa
11.5.2.7.1 South Africa Crop Monitoring Market Estimates and Forecasts, By Offering (2020-2032) (USD Billion)
11.5.2.7.2 South Africa Crop Monitoring Market Estimates and Forecasts, By Technology (2020-2032) (USD Billion)
11.5.2.7.3 South Africa Crop Monitoring Market Estimates and Forecasts, By Farm Type (2020-2032) (USD Billion)
11.5.2.7.4 South Africa Crop Monitoring Market Estimates and Forecasts, By Application (2020-2032) (USD Billion)
11.5.2.8 Nigeria
11.5.2.8.1 Nigeria Crop Monitoring Market Estimates and Forecasts, By Offering (2020-2032) (USD Billion)
11.5.2.8.2 Nigeria Crop Monitoring Market Estimates and Forecasts, By Technology (2020-2032) (USD Billion)
11.5.2.8.3 Nigeria Crop Monitoring Market Estimates and Forecasts, By Farm Type (2020-2032) (USD Billion)
11.5.2.8.4 Nigeria Crop Monitoring Market Estimates and Forecasts, By Application (2020-2032) (USD Billion)
11.5.2.9 Rest of Africa
11.5.2.9.1 Rest of Africa Crop Monitoring Market Estimates and Forecasts, By Offering (2020-2032) (USD Billion)
11.5.2.9.2 Rest of Africa Crop Monitoring Market Estimates and Forecasts, By Technology (2020-2032) (USD Billion)
11.5.2.9.3 Rest of Africa Crop Monitoring Market Estimates and Forecasts, By Farm Type (2020-2032) (USD Billion)
11.5.2.9.4 Rest of Africa Crop Monitoring Market Estimates and Forecasts, By Application (2020-2032) (USD Billion)
11.6 Latin America
11.6.1 Trends Analysis
11.6.2 Latin America Crop Monitoring Market Estimates and Forecasts, by Country (2020-2032) (USD Billion)
11.6.3 Latin America Crop Monitoring Market Estimates and Forecasts, By Offering (2020-2032) (USD Billion)
11.6.4 Latin America Crop Monitoring Market Estimates and Forecasts, By Technology (2020-2032) (USD Billion)
11.6.5 Latin America Crop Monitoring Market Estimates and Forecasts, By Farm Type (2020-2032) (USD Billion)
11.6.6 Latin America Crop Monitoring Market Estimates and Forecasts, By Application (2020-2032) (USD Billion)
11.6.7 Brazil
11.6.7.1 Brazil Crop Monitoring Market Estimates and Forecasts, By Offering (2020-2032) (USD Billion)
11.6.7.2 Brazil Crop Monitoring Market Estimates and Forecasts, By Technology (2020-2032) (USD Billion)
11.6.7.3 Brazil Crop Monitoring Market Estimates and Forecasts, By Farm Type (2020-2032) (USD Billion)
11.6.7.4 Brazil Crop Monitoring Market Estimates and Forecasts, By Application (2020-2032) (USD Billion)
11.6.8 Argentina
11.6.8.1 Argentina Crop Monitoring Market Estimates and Forecasts, By Offering (2020-2032) (USD Billion)
11.6.8.2 Argentina Crop Monitoring Market Estimates and Forecasts, By Technology (2020-2032) (USD Billion)
11.6.8.3 Argentina Crop Monitoring Market Estimates and Forecasts, By Farm Type (2020-2032) (USD Billion)
11.6.8.4 Argentina Crop Monitoring Market Estimates and Forecasts, By Application (2020-2032) (USD Billion)
11.6.9 Colombia
11.6.9.1 Colombia Crop Monitoring Market Estimates and Forecasts, By Offering (2020-2032) (USD Billion)
11.6.9.2 Colombia Crop Monitoring Market Estimates and Forecasts, By Technology (2020-2032) (USD Billion)
11.6.9.3 Colombia Crop Monitoring Market Estimates and Forecasts, By Farm Type (2020-2032) (USD Billion)
11.6.9.4 Colombia Crop Monitoring Market Estimates and Forecasts, By Application (2020-2032) (USD Billion)
11.6.10 Rest of Latin America
11.6.10.1 Rest of Latin America Crop Monitoring Market Estimates and Forecasts, By Offering (2020-2032) (USD Billion)
11.6.10.2 Rest of Latin America Crop Monitoring Market Estimates and Forecasts, By Technology (2020-2032) (USD Billion)
11.6.10.3 Rest of Latin America Crop Monitoring Market Estimates and Forecasts, By Farm Type (2020-2032) (USD Billion)
11.6.10.4 Rest of Latin America Crop Monitoring Market Estimates and Forecasts, By Application (2020-2032) (USD Billion)
12. Company Profiles
12.1 Trimble.
12.1.1 Company Overview
12.1.2 Financial
12.1.3 Products/ Services Offered
12.1.4 SWOT Analysis
12.2 Topcon Corporation
12.2.1 Company Overview
12.2.2 Financial
12.2.3 Products/ Services Offered
12.2.4 SWOT Analysis
12.3 The Climate Corporation.
12.3.1 Company Overview
12.3.2 Financial
12.3.3 Products/ Services Offered
12.3.4 SWOT Analysis
12.4 CropX Technologies.
12.4.1 Company Overview
12.4.2 Financial
12.4.3 Products/ Services Offered
12.4.4 SWOT Analysis
12.5 Yara International
12.5.1 Company Overview
12.5.2 Financial
12.5.3 Products/ Services Offered
12.5.4 SWOT Analysis
12.6 Stenon
12.6.1 Company Overview
12.6.2 Financial
12.6.3 Products/ Services Offered
12.6.4 SWOT Analysis
12.7 Instacrops
12.7.1 Company Overview
12.7.2 Financial
12.7.3 Products/ Services Offered
12.7.4 SWOT Analysis
12.8 EOS Data Analytics
12.8.1 Company Overview
12.8.2 Financial
12.8.3 Products/ Services Offered
12.8.4 SWOT Analysis
12.9 Solinftec
12.9.1 Company Overview
12.9.2 Financial
12.9.3 Products/ Services Offered
12.9.4 SWOT Analysis
12.10 Crop Analytica
12.10.1 Company Overview
12.10.2 Financial
12.10.3 Products/ Services Offered
12.10.4 SWOT Analysis
13. Use Cases and Best Practices
14. Conclusion
An accurate research report requires proper strategizing as well as implementation. There are multiple factors involved in the completion of good and accurate research report and selecting the best methodology to compete the research is the toughest part. Since the research reports we provide play a crucial role in any company’s decision-making process, therefore we at SNS Insider always believe that we should choose the best method which gives us results closer to reality. This allows us to reach at a stage wherein we can provide our clients best and accurate investment to output ratio.
Each report that we prepare takes a timeframe of 350-400 business hours for production. Starting from the selection of titles through a couple of in-depth brain storming session to the final QC process before uploading our titles on our website we dedicate around 350 working hours. The titles are selected based on their current market cap and the foreseen CAGR and growth.
The 5 steps process:
Step 1: Secondary Research:
Secondary Research or Desk Research is as the name suggests is a research process wherein, we collect data through the readily available information. In this process we use various paid and unpaid databases which our team has access to and gather data through the same. This includes examining of listed companies’ annual reports, Journals, SEC filling etc. Apart from this our team has access to various associations across the globe across different industries. Lastly, we have exchange relationships with various university as well as individual libraries.

Step 2: Primary Research
When we talk about primary research, it is a type of study in which the researchers collect relevant data samples directly, rather than relying on previously collected data. This type of research is focused on gaining content specific facts that can be sued to solve specific problems. Since the collected data is fresh and first hand therefore it makes the study more accurate and genuine.
We at SNS Insider have divided Primary Research into 2 parts.
Part 1 wherein we interview the KOLs of major players as well as the upcoming ones across various geographic regions. This allows us to have their view over the market scenario and acts as an important tool to come closer to the accurate market numbers. As many as 45 paid and unpaid primary interviews are taken from both the demand and supply side of the industry to make sure we land at an accurate judgement and analysis of the market.
This step involves the triangulation of data wherein our team analyses the interview transcripts, online survey responses and observation of on filed participants. The below mentioned chart should give a better understanding of the part 1 of the primary interview.

Part 2: In this part of primary research the data collected via secondary research and the part 1 of the primary research is validated with the interviews from individual consultants and subject matter experts.
Consultants are those set of people who have at least 12 years of experience and expertise within the industry whereas Subject Matter Experts are those with at least 15 years of experience behind their back within the same space. The data with the help of two main processes i.e., FGDs (Focused Group Discussions) and IDs (Individual Discussions). This gives us a 3rd party nonbiased primary view of the market scenario making it a more dependable one while collation of the data pointers.
Step 3: Data Bank Validation
Once all the information is collected via primary and secondary sources, we run that information for data validation. At our intelligence centre our research heads track a lot of information related to the market which includes the quarterly reports, the daily stock prices, and other relevant information. Our data bank server gets updated every fortnight and that is how the information which we collected using our primary and secondary information is revalidated in real time.

Step 4: QA/QC Process
After all the data collection and validation our team does a final level of quality check and quality assurance to get rid of any unwanted or undesired mistakes. This might include but not limited to getting rid of the any typos, duplication of numbers or missing of any important information. The people involved in this process include technical content writers, research heads and graphics people. Once this process is completed the title gets uploader on our platform for our clients to read it.
Step 5: Final QC/QA Process:
This is the last process and comes when the client has ordered the study. In this process a final QA/QC is done before the study is emailed to the client. Since we believe in giving our clients a good experience of our research studies, therefore, to make sure that we do not lack at our end in any way humanly possible we do a final round of quality check and then dispatch the study to the client.
By Offering
Hardware
Software
Services
By Technology
Sensing and Imagery
Automation and Robotics
By Farm Type
Small
Medium
Large
By Viewing Angle
Field mapping
Crop scouting and monitoring
Soil monitoring
Yield mapping and monitoring
Variable rate application
Weather tracking and forecasting
Others
Request for Segment Customization as per your Business Requirement: Segment Customization Request
Regional Coverage:
North America
US
Canada
Mexico
Europe
Eastern Europe
Poland
Romania
Hungary
Turkey
Rest of Eastern Europe
Western Europe
Germany
France
UK
Italy
Spain
Netherlands
Switzerland
Austria
Rest of Western Europe
Asia Pacific
China
India
Japan
South Korea
Vietnam
Singapore
Australia
Rest of Asia Pacific
Middle East & Africa
Middle East
UAE
Egypt
Saudi Arabia
Qatar
Rest of Middle East
Africa
Nigeria
South Africa
Rest of Africa
Latin America
Brazil
Argentina
Colombia
Rest of Latin America
Request for Country Level Research Report: Country Level Customization Request
Available Customization
With the given market data, SNS Insider offers customization as per the company’s specific needs. The following customization options are available for the report:
Detailed Volume Analysis
Criss-Cross segment analysis (e.g. Product X Application)
Competitive Product Benchmarking
Geographic Analysis
Additional countries in any of the regions
Customized Data Representation
Detailed analysis and profiling of additional market players
The Industrial Microscope Market Size was USD 2.90 billion in 2023 and will reach to USD 5.20 billion by 2032 and grow at a CAGR of 6.74% by 2024-2032.
The HVDC Capacitor market size was $ 6.80 Billion in 2023 & will reaching USD 22.47 billion till end of year2032 at CAGR about 14.23 % by 2024-2032
The Refrigeration Monitoring Market Size was valued at USD 8.38 Billion in 2023 and is expected to grow at 7.84% CAGR to reach USD 16.46 Billion by 2032.
The Facial Recognition Market Size was valued at USD 6.2 Billion in 2023 and is expecting to grow at a CAGR of 15.91% to reach USD 23.4 Billion by 2032.
The Gesture Recognition and touchless Sensing Market Size was valued at USD 19.4 billion in 2023 and is expected to reach USD 127.78 billion by 2032 and grow at a CAGR of 23.3 % over the forecast period 2024-2032.
The Vacuum Sensor Market Size was valued at USD 626.24 million in 2023 and is estimated to grow at a CAGR of 6.30% to reach USD 1084.7 million by 2032.

Hi! Click one of our member below to chat on Phone
© 2025 All Rights Reserved by SNS Insider Pvt Ltd


