image

Covered Stent Market Report Scope & Overview:

Covered Stent Market Revenue Analysis

Get More Information on Covered Stent Market - Request Sample Report

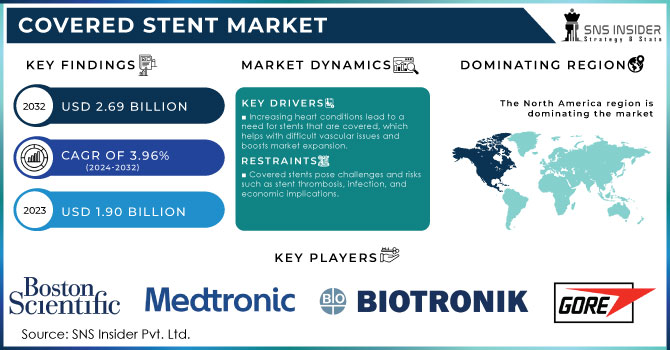
The Covered Stent Market size was valued at USD 1.90 billion in 2023 and is expected to reach USD 2.69 billion by 2032 and grow at a CAGR of 3.96% over the forecast period 2024-2032.

Advances in medical technology and rising demand for minimally invasive treatments are driving significant growth in the covered stent market. Stents covered with a graft material, known as covered stents, are created to treat challenging vascular issues like aneurysms, arteriovenous fistulas, and vascular leaks. These stents offer a special solution by providing both structural support and a barrier to stop blood from leaking through the vessel wall, thus improving the effectiveness of treatment. Covered stents have shown remarkable success rates in the field of endogenous laser therapy (EVLT) for varicose veins treatment. Usually, these procedures have a success rate of about 90% after one year, indicating effectiveness in relieving symptoms and closing veins. In the management of peripheral artery disease (PAD), covered stents are also utilized to treat blockages in the arteries of the legs. Typically, these stents have a patency rate of 70% to 80% after one year, showing a positive result in keeping the arteries open. Covered stents are utilized in endovascular aneurysm repair (EVAR) procedures for the treatment of abdominal aortic aneurysm (AAA). This method boasts a strong track record, achieving a 5-year survival rate of around 70% to 80%, with an aneurysm-linked death rate of roughly 1% to 2% during the same timeframe. The use of covered stents in treating coronary artery disease has demonstrated a lower incidence of restenosis in comparison to bare-metal stents, with a one-year patency rate of approximately 90%.

The increasing incidence of vascular diseases is a key factor driving the market for covered stents. Aging populations and increasingly inactive lifestyles are leading to a rise in the prevalence of conditions like aneurysms and peripheral artery disease. Covered stents are a valid choice for these patients, providing the advantages of stenting while also offering the extra safeguard of a graft to improve overall patient results. Moreover, progress in materials science and stent design is also aiding in the growth of the market. Advancements like drug-coated covered stents, releasing drugs to avoid restenosis, and bioresorbable stents, dissolving post-use, are revolutionizing vascular interventions.

Market Dynamics

Drivers

  • Increasing heart conditions lead to a need for stents that are covered, which helps with difficult vascular issues and boosts market expansion.

The rise in cardiovascular diseases like CAD, PAD, and aneurysms is a key factor driving the covered stent market. Cardiovascular diseases (CVDs) are one of the top reasons for illness and death on a global scale, resulting in a considerable need for successful treatment choices. Covered stents are especially useful for treating complicated vascular conditions that traditional stents may not be able to treat effectively. For instance, they are utilized in the treatment of chronic total occlusions (CTOs) and in the restoration of aneurysms. The increasing prevalence of these diseases caused by reasons such as older populations, inactive habits, and elevated levels of diabetes and hypertension leads to a demand for advanced medical options like stents that are covered. Furthermore, with the enhancement of knowledge about cardiovascular health and advancements in diagnostic technology, there is a growing number of people receiving CVD diagnoses, leading to a higher need for covered stents. The increasing emphasis on early identification and preventative treatment is also fueling the increasing demand for stenting procedures, driving market expansion.

  • Increasing need for covered stents fueled by the rise in minimally invasive surgical methods.

The movement towards less invasive methods in healthcare is a major factor influencing the covered stent market. Minimally invasive surgeries have various benefits compared to traditional open surgeries, such as quicker recovery periods, decreased infection risks, and reduced postoperative pain levels. Covered stents are included in this pattern, as they can be inserted using catheter-based methods that don't involve extensive cuts. This method provides advantages to patients by shortening recovery times and hospital stays, while also enabling healthcare providers to carry out procedures more accurately and with reduced risk. The growing demand for covered stents is fueled by the rising popularity of minimally invasive techniques among patients and healthcare providers. The covered stent market is projected to expand as more medical centers incorporate these methods and technologies.

Restraints

  • Covered stents pose challenges and risks such as stent thrombosis, infection, and economic implications.

Although covered stents have advantages, they do come with potential risks. Possible issues and negative outcomes linked to covered stents include stent thrombosis, infection, and bleeding. Although improvements in stent technology have decreased these dangers, they have not eradicated them. The chance of experiencing these difficulties may dissuade certain patients and healthcare professionals from choosing covered stents. Furthermore, the expense of managing and treating complications increases the total cost of the procedure, posing a potential worry for patients and healthcare systems alike. The market's growth may be hindered by complications, restricting the use of covered stents in specific patient groups or clinical situations.

  • Challenges and Consequences of Regulatory Obstacles in Approval of Covered Stents for Market Growth.

The process for approving covered stents can be intricate and prolonged. Manufacturers have to go through strict regulatory demands to secure approval for new stent designs and technologies. This procedure requires thorough clinical trials, submission of data, and adherence to safety regulations. Obtaining regulatory approval can cause a delay in bringing newly covered stent products to the market due to the time and resources involved. Furthermore, differing regulatory standards in various regions can make the global market strategy for covered stent producers more complex. These obstacles related to regulations and approvals may impede the expansion of the market by delaying innovation and restricting access to new covered stent technologies.

Market Segmentation Analysis
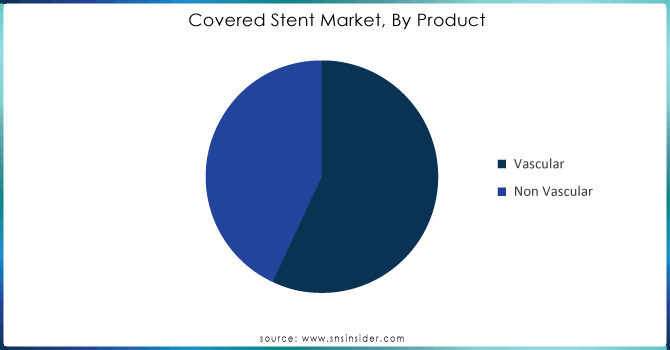
By Product

The vascular stent dominated in 2023 with a market share of 60%. Vascular stents are created to provide assistance to blood vessels and are mainly utilized in treating cardiovascular conditions. They play a crucial role in operations like angioplasty by assisting in maintaining the openness of arteries following their expansion. The growing occurrence of coronary artery diseases, peripheral artery diseases, and other vascular conditions is the main reason for the rising need for vascular stents. The growth of this sector has been further supported by technological advancements like drug-eluting stents that release medication to prevent restenosis.

The non-vascular stents are the fastest-growing segment during the forecast period 2024-2032. Non-vascular stents are utilized in various procedures beyond the vascular system, such as gastrointestinal, urological, and respiratory applications. They play a vital role in conditions like esophageal strictures, ureteral obstructions, and airway stenosis. Advancements in material science and stent design have boosted growth in this sector, leading to the increased use of non-vascular stents and better patient results.

Covered-Stent-Market-By-Product.

Need any customization research on Covered Stent Market - Enquiry Now

By End User

Hospitals held a market share of around 55% in 2023. Hospitals play a significant role in the covered stent market as they frequently utilize advanced medical devices to treat various cardiovascular conditions. The range of services they provide, such as emergency care, surgical procedures, and complex interventional therapies, leads to a strong demand for covered stents. Specialized departments and advanced technology help reinforce this dominance. Hospitals can deal with complex cases that necessitate advanced stent technology, playing a crucial role in market share.

Ambulatory care centers (ACCs) are expected to remain the fastest-growing segment during the forecast period. ACCs are becoming more popular because of their capability to offer effective, affordable care and their emphasis on procedures done on an outpatient basis. The increase in outpatient care for various procedures, such as those requiring covered stents, is contributing to this trend. ACCs are more and more utilizing advanced stent technologies for patients who do not need long hospital stays, in line with a larger movement to decrease hospital admissions and lower healthcare expenses.

Regional Analysis

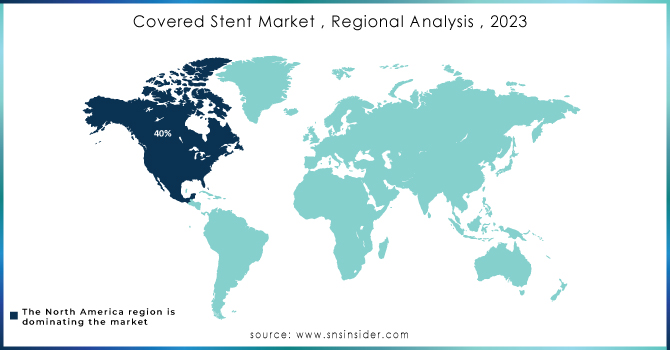
North America led the market in 2023 with a market share of over 40%. The main region dominating the covered stent market is North America due to its advanced healthcare system and widespread use of cutting-edge medical technology. The United States is known for its strong healthcare system and significant investments in research and development, leading to a great need for covered stents. The increasing incidence of heart-related illnesses and the rise in procedures like angioplasty and stent placements are also contributing to the growth of the market.

Asia Pacific is expected to grow at a faster rate during 2024-2032. Rapid economic growth and improving healthcare infrastructure are fueling the rapid expansion of the covered stents market in the Asia-Pacific region. Nations such as China and India are seeing a rise in cardiovascular diseases because of lifestyle modifications and aging populations, resulting in a higher need for sophisticated medical treatments. The area is experiencing accelerated market growth due to the increasing number of healthcare facilities and investments in medical technology.

Covered-Stent-Market--Regional-Analysis--2023

Key Players

The major key players in the market are Boston Scientific Corporation, Medtronic, Cook, W.L. Gore & Associates, B.Braun Systems Inc., Getinge, Biotronik, Terumo Corp, GE Healthcare, Abbott Labs, Koninklijke Philips N.V, Nihon Kohden Corporation, Baxter, Spacelabs Healthcare, & others

Recent Development

  • In January 2024, Boston Scientific introduced the Eluvia Drug-Eluting Stent System for the treatment of peripheral artery disease (PAD). The covered stent features a drug-eluting polymer that releases a drug designed to inhibit restenosis, thereby improving long-term outcomes for patients.

  • In June 2023, Medtronic launched the IN.PACT AV Luminate, a covered stent integrated with a drug-coated balloon system. This device is intended to treat complex vascular lesions and improve the patency of arteriovenous fistulas used in dialysis patients.

Covered Stent Market Report Scope:

Report Attributes Details
Market Size in 2023 USD 1.90 billion 
Market Size by 2032 USD 2.69 billion 
CAGR CAGR of 3.96% From 2024 to 2032
Base Year 2023
Forecast Period 2024-2032
Historical Data 2020-2022
Report Scope & Coverage Market Size, Segments Analysis, Competitive  Landscape, Regional Analysis, DROC & SWOT Analysis, Forecast Outlook
Key Segments • By Product Type (Vascular, Non-Vascular)
• By End User (Hospitals, Ambulatory Care Centers, Specialty Clinics)
Regional Analysis/Coverage North America (US, Canada, Mexico), Europe (Eastern Europe [Poland, Romania, Hungary, Turkey, Rest of Eastern Europe] Western Europe] Germany, France, UK, Italy, Spain, Netherlands, Switzerland, Austria, Rest of Western Europe]), Asia Pacific (China, India, Japan, South Korea, Vietnam, Singapore, Australia, Rest of Asia Pacific), Middle East & Africa (Middle East [UAE, Egypt, Saudi Arabia, Qatar, Rest of Middle East], Africa [Nigeria, South Africa, Rest of Africa], Latin America (Brazil, Argentina, Colombia, Rest of Latin America)
Company Profiles Boston Scientific Corporation, Medtronic, Cook, W.L. Gore & Associates, B.Braun Systems Inc., Getinge, Biotronik, Terumo Corp, GE Healthcare, Abbott Labs, Koninklijke Philips N.V, Nihon Kohden Corporation, Baxter, Spacelabs Healthcare
Key Drivers • Increasing heart conditions lead to a need for stents that are covered, which helps with difficult vascular issues and boosts market expansion.
• Increasing need for covered stents fueled by the rise in minimally invasive surgical methods.
RESTRAINTS • Covered stents pose challenges and risks such as stent thrombosis, infection, and economic implications.
• Challenges and Consequences of Regulatory Obstacles in Approval of Covered Stents for Market Growth.

Frequently Asked Questions

Ans:  The Covered Stent Market is expected to grow at a CAGR of 3.96% during 2024-2032.

Ans: Covered Stent Market size was USD 1.90 billion in 2023 and is expected to Reach USD 2.69 billion by 2032.

Ans: Increasing need for covered stents fueled by the rise in minimally invasive surgical methods.

Ans: The vascular stent segment dominated the Covered Stent Market.

Ans: North America dominated the Covered Stent Market in 2023.

Table of Content

1. Introduction

1.1 Market Definition

1.2 Scope (Inclusion and Exclusions)

1.3 Research Assumptions

2. Executive Summary

2.1 Market Overview

2.2 Regional Synopsis

2.3 Competitive Summary

3. Research Methodology

3.1 Top-Down Approach

3.2 Bottom-up Approach

3.3. Data Validation

3.4 Primary Interviews

4. Market Dynamics Impact Analysis

4.1 Market Driving Factors Analysis

4.1.2 Drivers

4.1.2 Restraints

4.1.3 Opportunities

4.1.4 Challenges

4.2 PESTLE Analysis

4.3 Porter’s Five Forces Model

5. Statistical Insights and Trends Reporting

5.1 Incidence and Prevalence (2023)

5.2 Prescription Trends, (2023), by Region

5.3 Device Volume, by Region (2020-2032)

5.4 Healthcare Spending, by Region, (Government, Commercial, Private, Out-of-Pocket), 2023

6. Competitive Landscape

6.1 List of Major Companies, By Region

6.2 Market Share Analysis, By Region

6.3 Product Benchmarking

6.3.1 Product specifications and features

6.3.2 Pricing

6.4 Strategic Initiatives

6.4.1 Marketing and promotional activities

6.4.2 Distribution and supply chain strategies

6.4.3 Expansion plans and new product launches

6.4.4 Strategic partnerships and collaborations

6.5 Technological Advancements

6.6 Market Positioning and Branding

7. Covered Stent Market Segmentation, by Product

7.1 Chapter Overview

7.2 Vascular Stent

7.2.1 Vascular Stent Market Trends Analysis (2020-2032)

7.2.2 Vascular Stent Market Size Estimates and Forecasts to 2032 (USD Billion)

7.3 Non-vascular Stent

7.3.1 Non-vascular Stent Market Trends Analysis (2020-2032)

7.3.2 Non-vascular Stent Market Size Estimates and Forecasts to 2032 (USD Billion)

8. Covered Stent Market Segmentation, by End User

8.1 Chapter Overview

8.2 Hospitals

8.2.1 Hospitals Market Trends Analysis (2020-2032)

8.2.2 Hospitals Market Size Estimates and Forecasts to 2032 (USD Billion)

8.3 Ambulatory Care Centers (ACS)

8.3.1 Ambulatory Care Centers (ACS) Market Trends Analysis (2020-2032)

8.3.2 Ambulatory Care Centers (ACS) Market Size Estimates and Forecasts to 2032 (USD Billion)

8.4 Specialty Clinics

8.4.1 Specialty Clinics Market Trends Analysis (2020-2032)

8.4.2 Specialty Clinics Market Size Estimates and Forecasts to 2032 (USD Billion)

9. Regional Analysis

9.1 Chapter Overview

9.2 North America

9.2.1 Trends Analysis

9.2.2 North America Covered Stent Market Estimates and Forecasts, by Country (2020-2032) (USD Billion)

9.2.3 North America Covered Stent Market Estimates and Forecasts, by Product (2020-2032) (USD Billion) 

9.2.4 North America Covered Stent Market Estimates and Forecasts, by End User (2020-2032) (USD Billion)

9.2.5 USA

9.2.5.1 USA Covered Stent Market Estimates and Forecasts, by Product (2020-2032) (USD Billion)

9.2.5.2 USA Covered Stent Market Estimates and Forecasts, by End User (2020-2032) (USD Billion)

9.2.6 Canada

9.2.6.1 Canada Covered Stent Market Estimates and Forecasts, by Product (2020-2032) (USD Billion)

9.2.6.2 Canada Covered Stent Market Estimates and Forecasts, by End User (2020-2032) (USD Billion)

9.2.7 Mexico

9.2.7.1 Mexico Covered Stent Market Estimates and Forecasts, by Product (2020-2032) (USD Billion)

9.2.7.2 Mexico Covered Stent Market Estimates and Forecasts, by End User (2020-2032) (USD Billion)

9.3 Europe

9.3.1 Eastern Europe

9.3.1.1 Trends Analysis

9.3.1.2 Eastern Europe Covered Stent Market Estimates and Forecasts, by Country (2020-2032) (USD Billion)

9.3.1.3 Eastern Europe Covered Stent Market Estimates and Forecasts, by Product (2020-2032) (USD Billion) 

9.3.1.4 Eastern Europe Covered Stent Market Estimates and Forecasts, by End User (2020-2032) (USD Billion)

9.3.1.5 Poland

9.3.1.5.1 Poland Covered Stent Market Estimates and Forecasts, by Product (2020-2032) (USD Billion)

9.3.1.5.2 Poland Covered Stent Market Estimates and Forecasts, by End User (2020-2032) (USD Billion)

9.3.1.6 Romania

9.3.1.6.1 Romania Covered Stent Market Estimates and Forecasts, by Product (2020-2032) (USD Billion)

9.3.1.6.2 Romania Covered Stent Market Estimates and Forecasts, by End User (2020-2032) (USD Billion)

9.3.1.7 Hungary

9.3.1.7.1 Hungary Covered Stent Market Estimates and Forecasts, by Product (2020-2032) (USD Billion)

9.3.1.7.2 Hungary Covered Stent Market Estimates and Forecasts, by End User (2020-2032) (USD Billion)

9.3.1.8 Turkey

9.3.1.8.1 Turkey Covered Stent Market Estimates and Forecasts, by Product (2020-2032) (USD Billion)

9.3.1.8.2 Turkey Covered Stent Market Estimates and Forecasts, by End User (2020-2032) (USD Billion)

9.3.1.9 Rest of Eastern Europe

9.3.1.9.1 Rest of Eastern Europe Covered Stent Market Estimates and Forecasts, by Product (2020-2032) (USD Billion)

9.3.1.9.2 Rest of Eastern Europe Covered Stent Market Estimates and Forecasts, by End User (2020-2032) (USD Billion)

9.3.2 Western Europe

9.3.2.1 Trends Analysis

9.3.2.2 Western Europe Covered Stent Market Estimates and Forecasts, by Country (2020-2032) (USD Billion)

9.3.2.3 Western Europe Covered Stent Market Estimates and Forecasts, by Product (2020-2032) (USD Billion) 

9.3.2.4 Western Europe Covered Stent Market Estimates and Forecasts, by End User (2020-2032) (USD Billion)

9.3.2.5 Germany

9.3.2.5.1 Germany Covered Stent Market Estimates and Forecasts, by Product (2020-2032) (USD Billion)

9.3.2.5.2 Germany Covered Stent Market Estimates and Forecasts, by End User (2020-2032) (USD Billion)

9.3.2.6 France

9.3.2.6.1 France Covered Stent Market Estimates and Forecasts, by Product (2020-2032) (USD Billion)

9.3.2.6.2 France Covered Stent Market Estimates and Forecasts, by End User (2020-2032) (USD Billion)

9.3.2.7 UK

9.3.2.7.1 UK Covered Stent Market Estimates and Forecasts, by Product (2020-2032) (USD Billion)

9.3.2.7.2 UK Covered Stent Market Estimates and Forecasts, by End User (2020-2032) (USD Billion)

9.3.2.8 Italy

9.3.2.8.1 Italy Covered Stent Market Estimates and Forecasts, by Product (2020-2032) (USD Billion)

9.3.2.8.2 Italy Covered Stent Market Estimates and Forecasts, by End User (2020-2032) (USD Billion)

9.3.2.9 Spain

9.3.2.9.1 Spain Covered Stent Market Estimates and Forecasts, by Product (2020-2032) (USD Billion)

9.3.2.9.2 Spain Covered Stent Market Estimates and Forecasts, by End User (2020-2032) (USD Billion)

9.3.2.10 Netherlands

9.3.2.10.1 Netherlands Covered Stent Market Estimates and Forecasts, by Product (2020-2032) (USD Billion)

9.3.2.10.2 Netherlands Covered Stent Market Estimates and Forecasts, by End User (2020-2032) (USD Billion)

9.3.2.11 Switzerland

9.3.2.11.1 Switzerland Covered Stent Market Estimates and Forecasts, by Product (2020-2032) (USD Billion)

9.3.2.11.2 Switzerland Covered Stent Market Estimates and Forecasts, by End User (2020-2032) (USD Billion)

9.3.2.12 Austria

9.3.2.12.1 Austria Covered Stent Market Estimates and Forecasts, by Product (2020-2032) (USD Billion)

9.3.2.12.2 Austria Covered Stent Market Estimates and Forecasts, by End User (2020-2032) (USD Billion)

9.3.2.13 Rest of Western Europe

9.3.2.13.1 Rest of Western Europe Covered Stent Market Estimates and Forecasts, by Product (2020-2032) (USD Billion)

9.3.2.13.2 Rest of Western Europe Covered Stent Market Estimates and Forecasts, by End User (2020-2032) (USD Billion)

9.4 Asia Pacific

9.4.1 Trends Analysis

9.4.2 Asia Pacific Covered Stent Market Estimates and Forecasts, by Country (2020-2032) (USD Billion)

9.4.3 Asia Pacific Covered Stent Market Estimates and Forecasts, by Product (2020-2032) (USD Billion) 

9.4.4 Asia Pacific Covered Stent Market Estimates and Forecasts, by End User (2020-2032) (USD Billion)

9.4.5 China

9.4.5.1 China Covered Stent Market Estimates and Forecasts, by Product (2020-2032) (USD Billion)

9.4.5.2 China Covered Stent Market Estimates and Forecasts, by End User (2020-2032) (USD Billion)

9.4.6 India

9.4.5.1 India Covered Stent Market Estimates and Forecasts, by Product (2020-2032) (USD Billion)

9.4.5.2 India Covered Stent Market Estimates and Forecasts, by End User (2020-2032) (USD Billion)

9.4.5 Japan

9.4.5.1 Japan Covered Stent Market Estimates and Forecasts, by Product (2020-2032) (USD Billion)

9.4.5.2 Japan Covered Stent Market Estimates and Forecasts, by End User (2020-2032) (USD Billion)

9.4.6 South Korea

9.4.6.1 South Korea Covered Stent Market Estimates and Forecasts, by Product (2020-2032) (USD Billion)

9.4.6.2 South Korea Covered Stent Market Estimates and Forecasts, by End User (2020-2032) (USD Billion)

9.4.7 Vietnam

9.4.7.1 Vietnam Covered Stent Market Estimates and Forecasts, by Product (2020-2032) (USD Billion)

9.2.7.2 Vietnam Covered Stent Market Estimates and Forecasts, by End User (2020-2032) (USD Billion)

9.4.8 Singapore

9.4.8.1 Singapore Covered Stent Market Estimates and Forecasts, by Product (2020-2032) (USD Billion)

9.4.8.2 Singapore Covered Stent Market Estimates and Forecasts, by End User (2020-2032) (USD Billion)

9.4.9 Australia

9.4.9.1 Australia Covered Stent Market Estimates and Forecasts, by Product (2020-2032) (USD Billion)

9.4.9.2 Australia Covered Stent Market Estimates and Forecasts, by End User (2020-2032) (USD Billion)

9.4.10 Rest of Asia Pacific

9.4.10.1 Rest of Asia Pacific Covered Stent Market Estimates and Forecasts, by Product (2020-2032) (USD Billion)

9.4.10.2 Rest of Asia Pacific Covered Stent Market Estimates and Forecasts, by End User (2020-2032) (USD Billion)

9.5 Middle East and Africa

9.5.1 Middle East

9.5.1.1 Trends Analysis

9.5.1.2 Middle East Covered Stent Market Estimates and Forecasts, by Country (2020-2032) (USD Billion)

9.5.1.3 Middle East Covered Stent Market Estimates and Forecasts, by Product (2020-2032) (USD Billion) 

9.5.1.4 Middle East Covered Stent Market Estimates and Forecasts, by End User (2020-2032) (USD Billion)

9.5.1.5 UAE

9.5.1.5.1 UAE Covered Stent Market Estimates and Forecasts, by Product (2020-2032) (USD Billion)

9.5.1.5.2 UAE Covered Stent Market Estimates and Forecasts, by End User (2020-2032) (USD Billion)

9.5.1.6 Egypt

9.5.1.6.1 Egypt Covered Stent Market Estimates and Forecasts, by Product (2020-2032) (USD Billion)

9.5.1.6.2 Egypt Covered Stent Market Estimates and Forecasts, by End User (2020-2032) (USD Billion)

9.5.1.7 Saudi Arabia

9.5.1.7.1 Saudi Arabia Covered Stent Market Estimates and Forecasts, by Product (2020-2032) (USD Billion)

9.5.1.7.2 Saudi Arabia Covered Stent Market Estimates and Forecasts, by End User (2020-2032) (USD Billion)

9.5.1.8 Qatar

9.5.1.8.1 Qatar Covered Stent Market Estimates and Forecasts, by Product (2020-2032) (USD Billion)

9.5.1.8.2 Qatar Covered Stent Market Estimates and Forecasts, by End User (2020-2032) (USD Billion)

9.5.1.9 Rest of Middle East

9.5.1.9.1 Rest of Middle East Covered Stent Market Estimates and Forecasts, by Product (2020-2032) (USD Billion)

9.5.1.9.2 Rest of Middle East Covered Stent Market Estimates and Forecasts, by End User (2020-2032) (USD Billion)

9.5.2 Africa

9.5.2.1 Trends Analysis

9.5.2.2 Africa Covered Stent Market Estimates and Forecasts, by Country (2020-2032) (USD Billion)

9.5.2.3 Africa Covered Stent Market Estimates and Forecasts, by Product (2020-2032) (USD Billion) 

9.5.2.4 Africa Covered Stent Market Estimates and Forecasts, by End User (2020-2032) (USD Billion)

9.5.2.5 South Africa

9.5.2.5.1 South Africa Covered Stent Market Estimates and Forecasts, by Product (2020-2032) (USD Billion)

9.5.2.5.2 South Africa Covered Stent Market Estimates and Forecasts, by End User (2020-2032) (USD Billion)

9.5.2.6 Nigeria

9.5.2.6.1 Nigeria Covered Stent Market Estimates and Forecasts, by Product (2020-2032) (USD Billion)

9.5.2.6.2 Nigeria Covered Stent Market Estimates and Forecasts, by End User (2020-2032) (USD Billion)

9.5.2.7 Rest of Africa

9.5.2.7.1 Rest of Africa Covered Stent Market Estimates and Forecasts, by Component (2020-2032) (USD Billion)

9.5.2.7.2 Rest of Africa Covered Stent Market Estimates and Forecasts, by Technology   (2020-2032) (USD Billion)


9.6 Latin America

9.6.1 Trends Analysis

9.6.2 Latin America Covered Stent Market Estimates and Forecasts, by Country (2020-2032) (USD Billion)

9.6.3 Latin America Covered Stent Market Estimates and Forecasts, by Product (2020-2032) (USD Billion) 

9.6.4 Latin America Covered Stent Market Estimates and Forecasts, by End User (2020-2032) (USD Billion)

9.6.5 Brazil

9.6.5.1 Brazil Covered Stent Market Estimates and Forecasts, by Product (2020-2032) (USD Billion)

9.6.5.2 Brazil Covered Stent Market Estimates and Forecasts, by End User (2020-2032) (USD Billion)

9.6.6 Argentina

9.6.6.1 Argentina Covered Stent Market Estimates and Forecasts, by Product (2020-2032) (USD Billion)

9.6.6.2 Argentina Covered Stent Market Estimates and Forecasts, by End User (2020-2032) (USD Billion)

9.6.7 Colombia

9.6.7.1 Colombia Covered Stent Market Estimates and Forecasts, by Product (2020-2032) (USD Billion)

9.6.7.2 Colombia Covered Stent Market Estimates and Forecasts, by End User (2020-2032) (USD Billion)

9.6.8 Rest of Latin America

9.6.8.1 Rest of Latin America Covered Stent Market Estimates and Forecasts, by Product (2020-2032) (USD Billion)

9.6.8.2 Rest of Latin America Covered Stent Market Estimates and Forecasts, by End User (2020-2032) (USD Billion)

10. Company Profiles

10.1 Boston Scientific Corporation

10.1.1 Company Overview

10.1.2 Financial

10.1.3 Products/ Services Offered

110.1.4 SWOT Analysis

10.2 Medtronic

10.2.1 Company Overview

10.2.2 Financial

10.2.3 Products/ Services Offered

10.2.4 SWOT Analysis

10.3 Cook

10.3.1 Company Overview

10.3.2 Financial

10.3.3 Products/ Services Offered

10.3.4 SWOT Analysis

10.4 W.L. Gore & Associates

10.4.1 Company Overview

10.4.2 Financial

10.4.3 Products/ Services Offered

10.4.4 SWOT Analysis

10.5 B. Braun Systems Inc.

10.5.1 Company Overview

10.5.2 Financial

10.5.3 Products/ Services Offered

10.5.4 SWOT Analysis

10.6 Getinge

10.6.1 Company Overview

10.6.2 Financial

10.6.3 Products/ Services Offered

10.6.4 SWOT Analysis

10.7 Biotronik

10.7.1 Company Overview

10.7.2 Financial

10.7.3 Products/ Services Offered

10.7.4 SWOT Analysis

10.8 Terumo Corp

10.8.1 Company Overview

10.8.2 Financial

10.8.3 Products/ Services Offered

10.8.4 SWOT Analysis

10.9 GE Healthcare

10.9.1 Company Overview

10.9.2 Financial

10.9.3 Products/ Services Offered

10.9.4 SWOT Analysis

10.10 Abbott Labs

10.9.1 Company Overview

10.9.2 Financial

10.9.3 Products/ Services Offered

10.9.4 SWOT Analysis

11. Use Cases and Best Practices

12. Conclusion

An accurate research report requires proper strategizing as well as implementation. There are multiple factors involved in the completion of good and accurate research report and selecting the best methodology to compete the research is the toughest part. Since the research reports we provide play a crucial role in any company’s decision-making process, therefore we at SNS Insider always believe that we should choose the best method which gives us results closer to reality. This allows us to reach at a stage wherein we can provide our clients best and accurate investment to output ratio.

Each report that we prepare takes a timeframe of 350-400 business hours for production. Starting from the selection of titles through a couple of in-depth brain storming session to the final QC process before uploading our titles on our website we dedicate around 350 working hours. The titles are selected based on their current market cap and the foreseen CAGR and growth.


The 5 steps process:

Step 1: Secondary Research:

Secondary Research or Desk Research is as the name suggests is a research process wherein, we collect data through the readily available information. In this process we use various paid and unpaid databases which our team has access to and gather data through the same. This includes examining of listed companies’ annual reports, Journals, SEC filling etc. Apart from this our team has access to various associations across the globe across different industries. Lastly, we have exchange relationships with various university as well as individual libraries.

Secondary Research

Step 2: Primary Research

When we talk about primary research, it is a type of study in which the researchers collect relevant data samples directly, rather than relying on previously collected data.  This type of research is focused on gaining content specific facts that can be sued to solve specific problems. Since the collected data is fresh and first hand therefore it makes the study more accurate and genuine.

We at SNS Insider have divided Primary Research into 2 parts.

Part 1 wherein we interview the KOLs of major players as well as the upcoming ones across various geographic regions. This allows us to have their view over the market scenario and acts as an important tool to come closer to the accurate market numbers. As many as 45 paid and unpaid primary interviews are taken from both the demand and supply side of the industry to make sure we land at an accurate judgement and analysis of the market.

This step involves the triangulation of data wherein our team analyses the interview transcripts, online survey responses and observation of on filed participants. The below mentioned chart should give a better understanding of the part 1 of the primary interview.

Primary Research

Part 2: In this part of primary research the data collected via secondary research and the part 1 of the primary research is validated with the interviews from individual consultants and subject matter experts.

Consultants are those set of people who have at least 12 years of experience and expertise within the industry whereas Subject Matter Experts are those with at least 15 years of experience behind their back within the same space. The data with the help of two main processes i.e., FGDs (Focused Group Discussions) and IDs (Individual Discussions). This gives us a 3rd party nonbiased primary view of the market scenario making it a more dependable one while collation of the data pointers.

Step 3: Data Bank Validation

Once all the information is collected via primary and secondary sources, we run that information for data validation. At our intelligence centre our research heads track a lot of information related to the market which includes the quarterly reports, the daily stock prices, and other relevant information. Our data bank server gets updated every fortnight and that is how the information which we collected using our primary and secondary information is revalidated in real time.

Data Bank Validation

Step 4: QA/QC Process

After all the data collection and validation our team does a final level of quality check and quality assurance to get rid of any unwanted or undesired mistakes. This might include but not limited to getting rid of the any typos, duplication of numbers or missing of any important information. The people involved in this process include technical content writers, research heads and graphics people. Once this process is completed the title gets uploader on our platform for our clients to read it.

Step 5: Final QC/QA Process:

This is the last process and comes when the client has ordered the study. In this process a final QA/QC is done before the study is emailed to the client. Since we believe in giving our clients a good experience of our research studies, therefore, to make sure that we do not lack at our end in any way humanly possible we do a final round of quality check and then dispatch the study to the client.

By Product

  • Vascular Stent
  • Non-vascular Stent

By End User

  • Hospitals
  • Ambulatory Care Centers (ACS)
  • Specialty Clinics

Request for Segment Customization as per your Business Requirement: Segment Customization Request

REGIONAL COVERAGE:

North America

  • US
  • Canada
  • Mexico

Europe

  • Eastern Europe
    • Poland
    • Romania
    • Hungary
    • Turkey
    • Rest of Eastern Europe
  • Western Europe
    • Germany
    • France
    • UK
    • Italy
    • Spain
    • Netherlands
    • Switzerland
    • Austria
    • Rest of Western Europe

Asia Pacific

  • China
  • India
  • Japan
  • South Korea
  • Vietnam
  • Singapore
  • Australia
  • Rest of Asia Pacific

Middle East & Africa

  • Middle East
    • UAE
    • Egypt
    • Saudi Arabia
    • Qatar
    • Rest of the Middle East
  • Africa
    • Nigeria
    • South Africa
    • Rest of Africa

Latin America

  • Brazil
  • Argentina
  • Colombia

Request for Country Level Research Report: Country Level Customization Request

Available Customization

With the given market data, SNS Insider offers customization as per the company’s specific needs. The following customization options are available for the report:

  • Product Analysis
  • Criss-Cross segment analysis (e.g. Product X Application)
  • Product Matrix which gives a detailed comparison of the product portfolio of each company
  • Geographic Analysis
  • Additional countries in any of the regions
  • Company Information
  • Detailed analysis and profiling of additional market players (Up to five)

  •            5000 (33% Discount)


  •            8950 (40% Discount)


  •            3050 (23% Discount)

Start a Conversation

Hi! Click one of our member below to chat on Phone