image

Cosmetic Pigments Market Report Scope & Overview

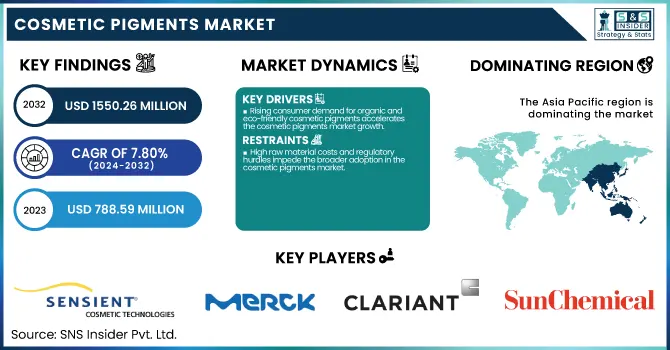
The Cosmetic Pigments Market size was USD 788.59 million in 2023 and is expected to reach USD 1550.26 million by 2032 and grow at a CAGR of 7.80% over the forecast period of 2024-2032.

Cosmetic Pigments Market Revenue Analysis

To Get more information on Cosmetic Pigments Market - Request Free Sample Report

​It offers detailed analysis of production capacities and utilization rates segmented by pigment type and region for 2023. It includes feedstock pricing trends across key countries, reflecting volatility and its impact on raw material costs. The report evaluates environmental metrics such as emissions levels and sustainable waste management practices adopted by major manufacturers. Regulatory frameworks influencing pigment safety, labeling, and usage limits are also covered, segmented by country. Innovation and R&D spending trends are analyzed, highlighting advancements in natural and surface-treated pigments. Additionally, adoption of digital color-matching software and formulation tools is assessed regionally. This data-driven section helps stakeholders understand operational dynamics, regulatory shifts, and sustainability priorities shaping the industry.

The Cosmetic Pigments market in the United States was Market size was USD 131.85 million in 2023 and is expected to reach USD 272.78 million by 2032 and grow at a CAGR of 8.41% over the forecast period of 2024-2032. This is due to its well-established cosmetics and personal care industry, driven by high consumer spending on premium and innovative beauty products. The presence of major global cosmetics brands, including Estée Lauder, L'Oréal USA, and Coty Inc., contributes significantly to the demand for advanced and diverse pigment formulations. Additionally, the country’s strong regulatory framework, such as FDA compliance for color additives, promotes the use of high-quality and safe pigments, encouraging innovation and product differentiation. The U.S. also benefits from a robust R&D ecosystem and early adoption of sustainable and natural cosmetic trends, which drives the demand for organic, special effect, and surface-treated pigments. With a rising preference for clean-label and visually appealing cosmetic products, the U.S. continues to lead in both pigment consumption and innovation.

Market Dynamics

Drivers

  • Rising consumer demand for organic and eco-friendly cosmetic pigments accelerates the cosmetic pigments market growth.

The Cosmetic Pigments Market is being significantly driven by the increasing consumer preference for organic and eco-friendly products. Modern consumers are more aware of the health and environmental impacts of synthetic chemicals and are actively seeking natural alternatives that offer safer, sustainable options for cosmetic formulations. This shift in consumer behavior is prompting manufacturers to invest in research and development to create high-performance, natural pigments. Market participants are focusing on innovative processing technologies and sourcing renewable raw materials, which not only enhance product quality but also reduce adverse environmental impacts. As trends like clean beauty and green cosmetic formulations continue to gain momentum, the demand for environmentally friendly cosmetic pigments is expected to fuel market expansion rapidly in both developed and emerging economies.

Restrain

  • High raw material costs and regulatory hurdles impede the broader adoption in the cosmetic pigments market.

One of the major restraints in the Cosmetic Pigments Market is the high cost associated with premium raw materials and the stringent regulatory landscape governing cosmetic ingredients. Manufacturers face rising expenses for high-quality, naturally derived pigments due to limited availability and complex extraction processes. In addition, the regulatory requirements across different regions demand rigorous testing and compliance protocols that further increase operational costs. These factors create a challenging environment, particularly for smaller players who may struggle with the capital needed for research, development, and extensive regulatory submissions. As a result, market growth is impacted by slower adoption rates in price-sensitive regions, with companies having to balance innovation with cost efficiency while navigating dynamic regulatory frameworks that vary widely by market and country.

Opportunity

  • Innovative R&d and emerging technological trends open boundless new frontiers for cosmetic pigments market expansion.

Advancements in research and development combined with emerging technological trends are creating significant growth opportunities for the Cosmetic Pigments Market. Companies are increasingly investing in innovative technologies to develop pigments that offer unique properties such as enhanced color stability, improved dispersion, and novel aesthetic effects that appeal to modern consumers. Breakthroughs in biotechnology and green chemistry are enabling the creation of pigments derived from renewable sources, reducing dependency on non-renewable resources, and aligning with consumer preferences for sustainable beauty solutions. These innovations also facilitate the development of multifunctional pigments that can be customized for various applications, further expanding market potential. Strategic collaborations between ingredient innovators, cosmetic formulators, and technology providers are poised to accelerate market growth by opening up new product categories and application segments worldwide.

Challenge

  • Intensifying market competition and price pressures challenge profit margins within the rapidly evolving cosmetic pigments market.

The Cosmetic Pigments Market faces a significant challenge due to intensifying competition among key players and escalating price pressures. As numerous companies vie for market share through product innovation, aggressive pricing strategies have become a common tactic, putting pressure on profit margins across the industry. Additionally, market saturation in developed regions has led to fierce competition, while emerging markets also present their own set of challenges in terms of cost variability and consumer price sensitivity. Companies are forced to continuously optimize their production processes and supply chains to maintain cost competitiveness without compromising quality. Furthermore, the dynamic nature of regulatory requirements across different geographies adds an extra layer of complexity, making it challenging for companies to sustain profitability while investing in new technologies and product enhancements to meet evolving consumer demands.

Segmentation Analysis

By Composition

Inorganic pigments held the largest market share around 68% in 2023. It is owing to the high stability, opacity and safety profile of the product. But pigments like iron oxides and titanium dioxide resist heat, light, and chemical degradation very well, which makes them ideal as long-lasting colorants in many products, such as foundations, lipsticks, eyeliners, and sunscreens. Inorganic versions on the other hand, are non-reactive and are therefore very much preferred in dermatologically tested and hypoallergenic formulations. Their ease of dispersion and ability to color consistently over wide range of concentrations also help in achieving uniformity of application in make-up products. In addition, the rise in the number of regulators evaluating synthetic and hazardous elements has naturally propelled the commercial growth of safe, FDA-approved inorganic colors, proven highly lucrative in North American and European regions, which have strict cosmetic regulations.

 By Type

The surface treated pigments held the largest market share at around 36% in 2023. It is due to their enhanced properties, which make them ideal for high-performance cosmetic formulations. The surface treatment process improves the dispersibility, stability, and color intensity of pigments, ensuring that they blend more easily and evenly in cosmetic products. These pigments also offer superior resistance to environmental factors such as UV light, heat, and moisture, making them perfect for long-lasting applications like foundation, blush, and eye makeup. Additionally, surface-treated pigments can be tailored to meet specific needs, such as improving skin feel, adding shimmer, or enhancing durability. As consumer demand grows for multifunctional beauty products that offer both aesthetics and skincare benefits, the versatility and superior functionality of surface-treated pigments have made them increasingly popular, thus contributing to their dominance in the market.

By Application

Facial Makeup held the largest market share, around 25%, in 2023. This is due to its widespread use and high demand across diverse consumer segments. Products like foundations, concealers, blushes, and highlighters are essential components of daily beauty routines, making facial makeup the primary application for cosmetic pigments. The growing trend toward flawless, customizable looks and the increasing consumer focus on skin-perfecting products have further fueled the demand for facial makeup products. Additionally, advancements in formulations that offer long-lasting wear, buildable coverage, and a natural finish have boosted the popularity of facial makeup, leading to higher pigment usage. With the rising popularity of clean beauty and skin care-infused cosmetics, facial makeup formulations are incorporating a wide variety of organic and inorganic pigments, ensuring that the demand for these products remains robust across all age groups and demographics.

Regional Analysis

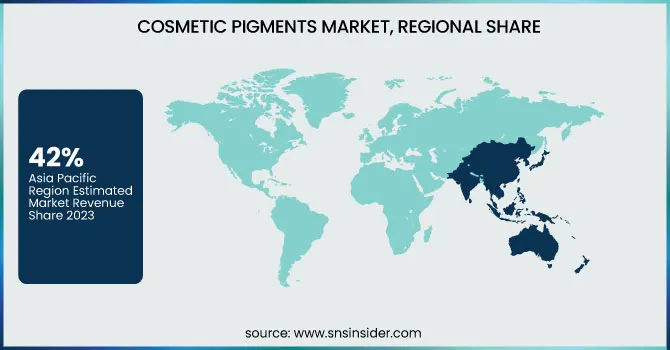
Asia Pacific held the largest market share, around 42%, in 2023. This is owing to the rapid development of beauty and personal care industry in the region, fuelling by increasing disposable incomes, urbanization, and consumers lifestyles. The expanding middle classes in China and India, along with a growing interest in cosmetics in Japan, have led to increased demand for premium and mass-market cosmetic products in all of these countries. Moreover, the demand for innovative inclusive cosmetic formulations has greatly surged in the region because of the burgeoning interest in beauty trends among the young and digits population particularly millennials and Gen Zs. In addition, the emergence of e-commerce platforms and impact of social media on beauty ideals have been instrumental in driving cosmetic product consumption across the region. Additionally, the pigment market is being propelled by a number of cosmetic manufacturers in Asia Pacific launching new and bespoke pigment solutions to match local requirements.

North America held a significant market share. It is due to the well-established presence of major global beauty and personal care brands, a strong consumer base, and high demand for premium cosmetic products. The region's consumers are highly invested in beauty and skincare, driven by a culture that emphasizes personal grooming and self-expression. With a preference for high-quality, innovative products, North American consumers are increasingly seeking advanced cosmetic formulations that include safe, effective, and unique pigments. Regulatory frameworks in the U.S. and Canada, such as those enforced by the FDA, ensure that only the safest, most effective ingredients are used, which has boosted consumer confidence in cosmetic products. Additionally, North America is a hub for research, development, and innovation in the cosmetics industry, making it a leader in introducing new trends and technology in pigment formulations. The rise of clean beauty and organic products, along with strong e-commerce growth, has further solidified North America's dominance in the market.

Cosmetic Pigments Market Regional Share

Get Customized Report as per Your Business Requirement - Enquiry Now

Key Players

  • Sensient Cosmetic Technologies (Unipure Red LC 381, Covapearl White ST 925)

  • Merck Group (Ronastar Golden Jewel, Colorona SynBerry Pink)

  • Clariant (Vibracolor Ruby Red, Hostaperm Pink E)

  • Sun Chemical (SunPURO Orange 5, SunCROMA Yellow Iron Oxide)

  • Eckart GmbH (Syncrystal Soft Ivory, Prestige Silver)

  • Kobo Products Inc. (KOBOPEARL Perpetual Tan, Iron Oxide Red 229C)

  • DayGlo Color Corp. (Zinc Sulfide Orange, Elara Glow Pigment)

  • BASF (Cosmenyl Red B, Reflecks MultiDimensions Glistening Gold)

  • LANXESS (Bayferrox 130 C, Colortherm Yellow 20)

  • Geotech International B.V. (Bi-Lite Silver 250, Gemtone Ruby Red)

  • Neelikon (Neeligran Red 6, Neeligran Yellow 5)

  • Toyal America Inc. (Aluminum Silver PG-903, Pearl Black S-901)

  • Nihon Koken Kogyo Co., Ltd. (Cokemica Red Iron Oxide, Cokemica Mica Pearl)

  • Miyoshi America, Inc. (MiyoNAT Yellow Iron Oxide, MiyoNAT Mica Titanium)

  • Venator Materials PLC (Durasheen 102, UV-Titan M160)

  • Kolortek Co., Ltd. (Holographic Pigment KTP, Thermochromic Pigment KT-WA)

  • Oxen Special Chemicals Co., Ltd. (Oxen Pearl Gold, Oxen Silver Crystal)

  • Sudarshan Chemical Industries (Sumicos White S210, Sumicos Copper S410)

  • Harman Finochem Ltd. (HFPink CP01, HFYellow CY02)

  • Yipin Pigments (Yipin Yellow Iron Oxide 920, Yipin Red 110)

Recent Development:

  • In 2024, Sun Chemical unveiled its next-gen INTENZA Hana effect pigments, blending FDA-approved colors with natural mica for enhanced shimmer. They also launched SunPURO Natural Carotenes from algae and mushrooms, and SACRANEX, a skincare active for hydration and pollution protection.

  • In April 2024, LANXESS expanded its cosmetics portfolio featuring Purox S Scopeblue, a more sustainable sodium benzoate. Made using green energy and renewable resources, it significantly lowers carbon emissions.

Cosmetic Pigments Market Report Scope

Report Attributes Details
Market Size in 2023 USD 788.59 Million
Market Size by 2032 USD 1550.26 Million
CAGR CAGR of7.80% % From 2024 to 2032
Base Year 2023
Forecast Period 2024-2032
Historical Data 2020-2022
Report Scope & Coverage Market Size, Segments Analysis, Competitive  Landscape, Regional Analysis, DROC & SWOT Analysis, Forecast Outlook
Key Segments • By Composition (Organic Pigments, Inorganic Pigments)
• By Type (Special Effect Pigments, Surface Treated Pigments, Nano Pigments, Natural Colorants),
• By Application (Facial Makeup, Lip Products, Hair Color Products, Eye Makeup, Others)
Regional Analysis/Coverage North America (US, Canada, Mexico), Europe (Eastern Europe [Poland, Romania, Hungary, Turkey, Rest of Eastern Europe] Western Europe] Germany, France, UK, Italy, Spain, Netherlands, Switzerland, Austria, Rest of Western Europe]), Asia Pacific (China, India, Japan, South Korea, Vietnam, Singapore, Australia, Rest of Asia Pacific), Middle East & Africa (Middle East [UAE, Egypt, Saudi Arabia, Qatar, Rest of Middle East], Africa [Nigeria, South Africa, Rest of Africa], Latin America (Brazil, Argentina, Colombia, Rest of Latin America)
Company Profiles Sensient Cosmetic Technologies, Merck Group, Clariant, Sun Chemical, Eckart GmbH, Kobo Products Inc., DayGlo Color Corp., BASF, LANXESS, Geotech International B.V., Neelikon, Toyal America Inc., Nihon Koken Kogyo Co., Ltd., Miyoshi America, Inc., Venator Materials PLC, Kolortek Co., Ltd., Oxen Special Chemicals Co., Ltd., Sudarshan Chemical Industries, Harman Finochem Ltd., Yipin Pigments

Frequently Asked Questions

Ans: The Cosmetic Pigments Market was valued at USD 788.59 Million in 2023.

Ans: The expected CAGR of the global Cosmetic Pigments Market during the forecast period is 7.80%

Ans:    Inorganic Pigments will grow rapidly in the Cosmetic Pigments Market from 2024 to 2032.

Ans: Rising consumer demand for organic and eco-friendly cosmetic pigments accelerates the cosmetic pigments market growth.

Ans: Asia Pacific led the Cosmetic Pigments Market in the region with the highest revenue share in 2023.

Table of Contents

1. Introduction

1.1 Market Definition

1.2 Scope (Inclusion and Exclusions)

1.3 Research Assumptions

2. Executive Summary

2.1 Market Overview

2.2 Regional Synopsis

2.3 Competitive Summary

3. Research Methodology

3.1 Top-Down Approach

3.2 Bottom-up Approach

3.3. Data Validation

3.4 Primary Interviews

4. Market Dynamics Impact Analysis

4.1 Market Driving Factors Analysis

4.1.1 Drivers

4.1.2 Restraints

4.1.3 Opportunities

4.1.4 Challenges

4.2 PESTLE Analysis

4.3 Porter’s Five Forces Model

5. Statistical Insights and Trends Reporting

    5.1 Production Capacity and Utilization by Country and by Type, 2023

    5.2 Regulatory Impact by Country and by Type, 2023

  5.3 Environmental Metrics: Emissions Data, Waste Management Practices, and Sustainability Initiatives by region

   5.4 Innovation and R&D, by Type, 2023

6. Competitive Landscape

6.1 List of Major Companies, By Region

6.2 Market Share Analysis, By Region

6.3 Product Benchmarking

6.3.1 Product specifications and features

6.3.2 Pricing

6.4 Strategic Initiatives

6.4.1 Marketing and promotional activities

6.4.2 Distribution and Supply Chain Strategies

6.4.3 Expansion plans and new Product launches

6.4.4 Strategic partnerships and collaborations

6.5 Technological Advancements

6.6 Market Positioning and Branding

7. Cosmetic Pigments Market Segmentation By Composition

7.1 Chapter Overview

7.2 Organic Pigments

7.2.1 Organic Pigments Market Trends Analysis (2020-2032)

7.2.2 Organic Pigments Market Size Estimates and Forecasts to 2032 (USD Million)

7.3 Inorganic Pigments

     7.3.1 Inorganic Pigments Market Trends Analysis (2020-2032)

          7.3.2 Inorganic Pigments Market Size Estimates and Forecasts to 2032 (USD Million)

8. Cosmetic Pigments Market Segmentation By Type

8.1 Chapter Overview

8.2 Special Effect Pigments

     8.2.1 Special Effect Pigments Market Trend Analysis (2020-2032)

           8.2.2 Special Effect Pigments Foams Market Size Estimates and Forecasts to 2032 (USD Million)

8.3 Surface Treated Pigments

      8.3.1 Surface Treated Pigments Market Trends Analysis (2020-2032)

           8.3.2 Surface Treated Pigments Market Size Estimates and Forecasts to 2032 (USD Million)

8.4 Nano Pigments

      8.4.1 Nano Pigments Market Trends Analysis (2020-2032)

           8.4.2 Nano Pigments Market Size Estimates and Forecasts to 2032 (USD Million)

8.5 Natural Colorants

      8.5.1 Natural Colorants Market Trends Analysis (2020-2032)

           8.5.2 Natural Colorants Market Size Estimates and Forecasts to 2032 (USD Million)

9. Cosmetic Pigments Market Segmentation By Application

9.1 Chapter Overview

9.2 Facial Makeup

        9.2.1 Facial Makeup Market Trends Analysis (2020-2032)

9.2.2 Facial Makeup Market Size Estimates and Forecasts to 2032 (USD Million)

9.3 Lip Products

        9.3.1 Lip Products Market Trends Analysis (2020-2032)

9.3.2 Lip Products Market Size Estimates and Forecasts to 2032 (USD Million)

9.4 Hair Color Products

        9.4.1 Hair Color Products Market Trends Analysis (2020-2032)

9.4.2 Hair Color Products Market Size Estimates and Forecasts to 2032 (USD Million)

9.5 Eye Makeup

        9.5.1 Eye Makeup Market Trends Analysis (2020-2032)

9.5.2 Eye Makeup Market Size Estimates and Forecasts to 2032 (USD Million)

9.6 Others

        9.6.1 Others Market Trends Analysis (2020-2032)

9.6.2 Others Market Size Estimates and Forecasts to 2032 (USD Million)

10. Regional Analysis

10.1 Chapter Overview

10.2 North America

10.2.1 Trends Analysis

10.2.2 North America Cosmetic Pigments Market Estimates and Forecasts, by Country (2020-2032) (USD Million)

10.2.3 North America Cosmetic Pigments Market Estimates and Forecasts, By Composition (2020-2032) (USD Million) 

10.2.4 North America Cosmetic Pigments Market Estimates and Forecasts, By Type (2020-2032) (USD Million)

10.2.5 North America Cosmetic Pigments Market Estimates and Forecasts, By Application (2020-2032) (USD Million)

10.2.6 USA

10.2.6.1 USA Cosmetic Pigments Market Estimates and Forecasts, By Composition (2020-2032) (USD Million)

10.2.6.2 USA Cosmetic Pigments Market Estimates and Forecasts, By Type (2020-2032) (USD Million)

10.2.6.3 USA Cosmetic Pigments Market Estimates and Forecasts, By Application (2020-2032) (USD Million)

10.2.7 Canada

10.2.7.1 Canada Cosmetic Pigments Market Estimates and Forecasts, By Composition (2020-2032) (USD Million)

10.2.7.2 Canada Cosmetic Pigments Market Estimates and Forecasts, By Type (2020-2032) (USD Million)

10.2.7.3 Canada Cosmetic Pigments Market Estimates and Forecasts, By Application (2020-2032) (USD Million)

10.2.8 Mexico

10.2.8.1 Mexico Cosmetic Pigments Market Estimates and Forecasts, By Composition (2020-2032) (USD Million)

10.2.8.2 Mexico Cosmetic Pigments Market Estimates and Forecasts, By Type (2020-2032) (USD Million)

10.2.8.3 Mexico Cosmetic Pigments Market Estimates and Forecasts, By Application (2020-2032) (USD Million)

10.3 Europe

10.3.1 Eastern Europe

10.3.1.1 Trends Analysis

10.3.1.2 Eastern Europe Cosmetic Pigments Market Estimates and Forecasts, by Country (2020-2032) (USD Million)

10.3.1.3 Eastern Europe Cosmetic Pigments Market Estimates and Forecasts, By Composition (2020-2032) (USD Million) 

10.3.1.4 Eastern Europe Cosmetic Pigments Market Estimates and Forecasts, By Type (2020-2032) (USD Million)

10.3.1.5 Eastern Europe Cosmetic Pigments Market Estimates and Forecasts, By Application (2020-2032) (USD Million)

10.3.1.6 Poland

10.3.1.6.1 Poland Cosmetic Pigments Market Estimates and Forecasts, By Composition (2020-2032) (USD Million)

10.3.1.6.2 Poland Cosmetic Pigments Market Estimates and Forecasts, By Type (2020-2032) (USD Million)

10.3.1.6.3 Poland Cosmetic Pigments Market Estimates and Forecasts, By Application (2020-2032) (USD Million)

10.3.1.7 Romania

10.3.1.7.1 Romania Cosmetic Pigments Market Estimates and Forecasts, By Composition (2020-2032) (USD Million)

10.3.1.7.2 Romania Cosmetic Pigments Market Estimates and Forecasts, By Type (2020-2032) (USD Million)

10.3.1.7.3 Romania Cosmetic Pigments Market Estimates and Forecasts, By Application (2020-2032) (USD Million)

10.3.1.8 Hungary

10.3.1.8.1 Hungary Cosmetic Pigments Market Estimates and Forecasts, By Composition (2020-2032) (USD Million)

10.3.1.8.2 Hungary Cosmetic Pigments Market Estimates and Forecasts, By Type (2020-2032) (USD Million)

10.3.1.8.3 Hungary Cosmetic Pigments Market Estimates and Forecasts, By Application (2020-2032) (USD Million)

10.3.1.9 Turkey

10.3.1.9.1 Turkey Cosmetic Pigments Market Estimates and Forecasts, By Composition (2020-2032) (USD Million)

10.3.1.9.2 Turkey Cosmetic Pigments Market Estimates and Forecasts, By Type (2020-2032) (USD Million)

10.3.1.9.3 Turkey Cosmetic Pigments Market Estimates and Forecasts, By Application (2020-2032) (USD Million)

10.3.1.10 Rest of Eastern Europe

10.3.1.10.1 Rest of Eastern Europe Cosmetic Pigments Market Estimates and Forecasts, By Composition (2020-2032) (USD Million)

10.3.1.10.2 Rest of Eastern Europe Cosmetic Pigments Market Estimates and Forecasts, By Type (2020-2032) (USD Million)

10.3.1.10.3 Rest of Eastern Europe Cosmetic Pigments Market Estimates and Forecasts, By Application (2020-2032) (USD Million)

10.3.2 Western Europe

10.3.2.1 Trends Analysis

10.3.2.2 Western Europe Cosmetic Pigments Market Estimates and Forecasts, by Country (2020-2032) (USD Million)

10.3.2.3 Western Europe Cosmetic Pigments Market Estimates and Forecasts, By Composition (2020-2032) (USD Million) 

10.3.2.4 Western Europe Cosmetic Pigments Market Estimates and Forecasts, By Type (2020-2032) (USD Million)

10.3.2.5 Western Europe Cosmetic Pigments Market Estimates and Forecasts, By Application (2020-2032) (USD Million)

10.3.2.6 Germany

10.3.2.6.1 Germany Cosmetic Pigments Market Estimates and Forecasts, By Composition (2020-2032) (USD Million)

10.3.2.6.2 Germany Cosmetic Pigments Market Estimates and Forecasts, By Type (2020-2032) (USD Million)

10.3.2.6.3 Germany Cosmetic Pigments Market Estimates and Forecasts, By Application (2020-2032) (USD Million)

10.3.2.7 France

10.3.2.7.1 France Cosmetic Pigments Market Estimates and Forecasts, By Composition (2020-2032) (USD Million)

10.3.2.7.2 France Cosmetic Pigments Market Estimates and Forecasts, By Type (2020-2032) (USD Million)

10.3.2.7.3 France Cosmetic Pigments Market Estimates and Forecasts, By Application (2020-2032) (USD Million)

10.3.2.8 UK

10.3.2.8.1 UK Cosmetic Pigments Market Estimates and Forecasts, By Composition (2020-2032) (USD Million)

10.3.2.8.2 UK Cosmetic Pigments Market Estimates and Forecasts, By Type (2020-2032) (USD Million)

10.3.2.8.3 UK Cosmetic Pigments Market Estimates and Forecasts, By Application (2020-2032) (USD Million)

10.3.2.9 Italy

10.3.2.9.1 Italy Cosmetic Pigments Market Estimates and Forecasts, By Composition (2020-2032) (USD Million)

10.3.2.9.2 Italy Cosmetic Pigments Market Estimates and Forecasts, By Type (2020-2032) (USD Million)

10.3.2.9.3 Italy Cosmetic Pigments Market Estimates and Forecasts, By Application (2020-2032) (USD Million)

10.3.2.10 Spain

10.3.2.10.1 Spain Cosmetic Pigments Market Estimates and Forecasts, By Composition (2020-2032) (USD Million)

10.3.2.10.2 Spain Cosmetic Pigments Market Estimates and Forecasts, By Type (2020-2032) (USD Million)

10.3.2.10.3 Spain Cosmetic Pigments Market Estimates and Forecasts, By Application (2020-2032) (USD Million)

10.3.2.11 Netherlands

10.3.2.11.1 Netherlands Cosmetic Pigments Market Estimates and Forecasts, By Composition (2020-2032) (USD Million)

10.3.2.11.2 Netherlands Cosmetic Pigments Market Estimates and Forecasts, By Type (2020-2032) (USD Million)

10.3.2.11.3 Netherlands Cosmetic Pigments Market Estimates and Forecasts, By Application (2020-2032) (USD Million)

10.3.2.12 Switzerland

10.3.2.12.1 Switzerland Cosmetic Pigments Market Estimates and Forecasts, By Composition (2020-2032) (USD Million)

10.3.2.12.2 Switzerland Cosmetic Pigments Market Estimates and Forecasts, By Type (2020-2032) (USD Million)

10.3.2.12.3 Switzerland Cosmetic Pigments Market Estimates and Forecasts, By Application (2020-2032) (USD Million)

10.3.2.13 Austria

10.3.2.13.1 Austria Cosmetic Pigments Market Estimates and Forecasts, By Composition (2020-2032) (USD Million)

10.3.2.13.2 Austria Cosmetic Pigments Market Estimates and Forecasts, By Type (2020-2032) (USD Million)

10.3.2.13.3 Austria Cosmetic Pigments Market Estimates and Forecasts, By Application (2020-2032) (USD Million)

10.3.2.14 Rest of Western Europe

10.3.2.14.1 Rest of Western Europe Cosmetic Pigments Market Estimates and Forecasts, By Composition (2020-2032) (USD Million)

10.3.2.14.2 Rest of Western Europe Cosmetic Pigments Market Estimates and Forecasts, By Type (2020-2032) (USD Million)

10.3.2.14.3 Rest of Western Europe Cosmetic Pigments Market Estimates and Forecasts, By Application (2020-2032) (USD Million)

10.4 Asia Pacific

10.4.1 Trends Analysis

  10.4.2 Asia Pacific Cosmetic Pigments Market Estimates and Forecasts, by Country (2020-2032) (USD Million)

 10.4.3 Asia Pacific Cosmetic Pigments Market Estimates and Forecasts, By Composition (2020-2032) (USD Million) 

 10.4.4 Asia Pacific Cosmetic Pigments Market Estimates and Forecasts, By Type (2020-2032) (USD Million)

 10.4.5 Asia Pacific Cosmetic Pigments Market Estimates and Forecasts, By Application (2020-2032) (USD Million)

10.4.6 China

10.4.6.1 China Cosmetic Pigments Market Estimates and Forecasts, By Composition (2020-2032) (USD Million)

10.4.6.2 China Cosmetic Pigments Market Estimates and Forecasts, By Type (2020-2032) (USD Million)

10.4.6.3 China Cosmetic Pigments Market Estimates and Forecasts, By Application (2020-2032) (USD Million)

10.4.7 India

10.4.7.1 India Cosmetic Pigments Market Estimates and Forecasts, By Composition (2020-2032) (USD Million)

10.4.7.2 India Cosmetic Pigments Market Estimates and Forecasts, By Type (2020-2032) (USD Million)

10.4.7.3 India Cosmetic Pigments Market Estimates and Forecasts, By Application (2020-2032) (USD Million)

10.4.8 Japan

10.4.8.1 Japan Cosmetic Pigments Market Estimates and Forecasts, By Composition (2020-2032) (USD Million)

10.4.8.2 Japan Cosmetic Pigments Market Estimates and Forecasts, By Type (2020-2032) (USD Million)

10.4.8.3 Japan Cosmetic Pigments Market Estimates and Forecasts, By Application (2020-2032) (USD Million)

10.4.9 South Korea

10.4.9.1 South Korea Cosmetic Pigments Market Estimates and Forecasts, By Composition (2020-2032) (USD Million)

10.4.9.2 South Korea Cosmetic Pigments Market Estimates and Forecasts, By Type (2020-2032) (USD Million)

10.4.9.3 South Korea Cosmetic Pigments Market Estimates and Forecasts, By Application (2020-2032) (USD Million)

10.4.10 Vietnam

10.4.10.1 Vietnam Cosmetic Pigments Market Estimates and Forecasts, By Composition (2020-2032) (USD Million)

10.4.10.2 Vietnam Cosmetic Pigments Market Estimates and Forecasts, By Type (2020-2032) (USD Million)

10.4.10.3 Vietnam Cosmetic Pigments Market Estimates and Forecasts, By Application (2020-2032) (USD Million)

10.4.11 Singapore

10.4.11.1 Singapore Cosmetic Pigments Market Estimates and Forecasts, By Composition (2020-2032) (USD Million)

10.4.11.2 Singapore Cosmetic Pigments Market Estimates and Forecasts, By Type (2020-2032) (USD Million)

10.4.11.3 Singapore Cosmetic Pigments Market Estimates and Forecasts, By Application (2020-2032) (USD Million)

10.4.12 Australia

10.4.12.1 Australia Cosmetic Pigments Market Estimates and Forecasts, By Composition (2020-2032) (USD Million)

10.4.12.2 Australia Cosmetic Pigments Market Estimates and Forecasts, By Type (2020-2032) (USD Million)

10.4.12.3 Australia Cosmetic Pigments Market Estimates and Forecasts, By Application (2020-2032) (USD Million)

10.4.13 Rest of Asia Pacific

10.4.13.1 Rest of Asia Pacific Cosmetic Pigments Market Estimates and Forecasts, By Composition (2020-2032) (USD Million)

10.4.13.2 Rest of Asia Pacific Cosmetic Pigments Market Estimates and Forecasts, By Type (2020-2032) (USD Million)

10.4.13.3 Rest of Asia Pacific Cosmetic Pigments Market Estimates and Forecasts, By Application (2020-2032) (USD Million)

10.5 Middle East and Africa

10.5.1 Middle East

10.5.1.1 Trends Analysis

10.5.1.2 Middle East Cosmetic Pigments Market Estimates and Forecasts, by Country (2020-2032) (USD Million)

10.5.1.3 Middle East Cosmetic Pigments Market Estimates and Forecasts, By Composition (2020-2032) (USD Million) 

10.5.1.4 Middle East Cosmetic Pigments Market Estimates and Forecasts, By Type (2020-2032) (USD Million)

10.5.1.5 Middle East Cosmetic Pigments Market Estimates and Forecasts, By Application (2020-2032) (USD Million)

10.5.1.6 UAE

10.5.1.6.1 UAE Cosmetic Pigments Market Estimates and Forecasts, By Composition (2020-2032) (USD Million)

10.5.1.6.2 UAE Cosmetic Pigments Market Estimates and Forecasts, By Type (2020-2032) (USD Million)

10.5.1.6.3 UAE Cosmetic Pigments Market Estimates and Forecasts, By Application (2020-2032) (USD Million)

10.5.1.7 Egypt

10.5.1.7.1 Egypt Cosmetic Pigments Market Estimates and Forecasts, By Composition (2020-2032) (USD Million)

10.5.1.7.2 Egypt Cosmetic Pigments Market Estimates and Forecasts, By Type (2020-2032) (USD Million)

10.5.1.7.3 Egypt Cosmetic Pigments Market Estimates and Forecasts, By Application (2020-2032) (USD Million)

10.5.1.8 Saudi Arabia

10.5.1.8.1 Saudi Arabia Cosmetic Pigments Market Estimates and Forecasts, By Composition (2020-2032) (USD Million)

10.5.1.8.2 Saudi Arabia Cosmetic Pigments Market Estimates and Forecasts, By Type (2020-2032) (USD Million)

10.5.1.8.3 Saudi Arabia Cosmetic Pigments Market Estimates and Forecasts, By Application (2020-2032) (USD Million)

10.5.1.9 Qatar

10.5.1.9.1 Qatar Cosmetic Pigments Market Estimates and Forecasts, By Composition (2020-2032) (USD Million)

10.5.1.9.2 Qatar Cosmetic Pigments Market Estimates and Forecasts, By Type (2020-2032) (USD Million)

10.5.1.9.3 Qatar Cosmetic Pigments Market Estimates and Forecasts, By Application (2020-2032) (USD Million)

10.5.1.10 Rest of Middle East

10.5.1.10.1 Rest of Middle East Cosmetic Pigments Market Estimates and Forecasts, By Composition (2020-2032) (USD Million)

10.5.1.10.2 Rest of Middle East Cosmetic Pigments Market Estimates and Forecasts, By Type (2020-2032) (USD Million)

10.5.1.10.3 Rest of Middle East Cosmetic Pigments Market Estimates and Forecasts, By Application (2020-2032) (USD Million)

10.5.2 Africa

10.5.2.1 Trends Analysis

10.5.2.2 Africa Cosmetic Pigments Market Estimates and Forecasts, by Country (2020-2032) (USD Million)

10.5.2.3 Africa Cosmetic Pigments Market Estimates and Forecasts, By Composition (2020-2032) (USD Million) 

10.5.2.4 Africa Cosmetic Pigments Market Estimates and Forecasts, By Type (2020-2032) (USD Million)

10.5.2.5 Africa Cosmetic Pigments Market Estimates and Forecasts, By Application (2020-2032) (USD Million)

10.5.2.6 South Africa

10.5.2.6.1 South Africa Cosmetic Pigments Market Estimates and Forecasts, By Composition (2020-2032) (USD Million)

10.5.2.6.2 South Africa Cosmetic Pigments Market Estimates and Forecasts By Type (2020-2032) (USD Million)

10.5.2.6.3 South Africa Cosmetic Pigments Market Estimates and Forecasts, By Application (2020-2032) (USD Million)

10.5.2.7 Nigeria

10.5.2.7.1 Nigeria Cosmetic Pigments Market Estimates and Forecasts, By Composition (2020-2032) (USD Million)

10.5.2.7.2 Nigeria Cosmetic Pigments Market Estimates and Forecasts, By Type (2020-2032) (USD Million)

10.5.2.7.3 Nigeria Cosmetic Pigments Market Estimates and Forecasts, By Application (2020-2032) (USD Million)

10.5.2.8 Rest of Africa

10.5.2.8.1 Rest of Africa Cosmetic Pigments Market Estimates and Forecasts, By Composition (2020-2032) (USD Million)

10.5.2.8.2 Rest of Africa Cosmetic Pigments Market Estimates and Forecasts, By Type (2020-2032) (USD Million)

10.5.2.8.3 Rest of Africa Cosmetic Pigments Market Estimates and Forecasts, By Application (2020-2032) (USD Million)

10.6 Latin America

10.6.1 Trends Analysis

10.6.2 Latin America Cosmetic Pigments Market Estimates and Forecasts, by Country (2020-2032) (USD Million)

10.6.3 Latin America Cosmetic Pigments Market Estimates and Forecasts, By Composition (2020-2032) (USD Million) 

10.6.4 Latin America Cosmetic Pigments Market Estimates and Forecasts, By Type (2020-2032) (USD Million)

10.6.5 Latin America Cosmetic Pigments Market Estimates and Forecasts, By Application (2020-2032) (USD Million)

10.6.6 Brazil

10.6.6.1 Brazil Cosmetic Pigments Market Estimates and Forecasts, By Composition (2020-2032) (USD Million)

10.6.6.2 Brazil Cosmetic Pigments Market Estimates and Forecasts, By Type (2020-2032) (USD Million)

10.6.6.3 Brazil Cosmetic Pigments Market Estimates and Forecasts, By Application (2020-2032) (USD Million)

10.6.7 Argentina

10.6.7.1 Argentina Cosmetic Pigments Market Estimates and Forecasts, By Composition (2020-2032) (USD Million)

10.6.7.2 Argentina Cosmetic Pigments Market Estimates and Forecasts, By Type (2020-2032) (USD Million)

10.6.7.3 Argentina Cosmetic Pigments Market Estimates and Forecasts, By Application (2020-2032) (USD Million)

10.6.8 Colombia

10.6.8.1 Colombia Cosmetic Pigments Market Estimates and Forecasts, By Composition (2020-2032) (USD Million)

10.6.8.2 Colombia Cosmetic Pigments Market Estimates and Forecasts, By Type (2020-2032) (USD Million)

10.6.8.3 Colombia Cosmetic Pigments Market Estimates and Forecasts, By Application (2020-2032) (USD Million)

10.6.9 Rest of Latin America

10.6.9.1 Rest of Latin America Cosmetic Pigments Market Estimates and Forecasts, By Composition (2020-2032) (USD Million)

10.6.9.2 Rest of Latin America Cosmetic Pigments Market Estimates and Forecasts, By Type (2020-2032) (USD Million)

10.6.9.3 Rest of Latin America Cosmetic Pigments Market Estimates and Forecasts, By Application (2020-2032) (USD Million)

11. Company Profiles

11.1 Sensient Cosmetic Technologies

11.1.1 Company Overview

11.1.2 Financial

11.1.3 Product/ Services Offered

11.1.4 SWOT Analysis

11.2 Merck Group

     11.2.1 Company Overview

11.2.2 Financial

11.2.3 Product/ Services Offered

11.2.4 SWOT Analysis

11.3 Clariant

11.3.1 Company Overview

11.3.2 Financial

11.3.3 Product/ Services Offered

11.3.4 SWOT Analysis

11.4 Sun Chemical

     11.4.1 Company Overview

11.4.2 Financial

11.4.3 Product/ Services Offered

11.4.4 SWOT Analysis

11.5 Eckart GmbH

     11.5.1 Company Overview

11.5.2 Financial

11.5.3 Product/ Services Offered

11.5.4 SWOT Analysis

11.6 Kobo Products Inc.

11.6.1 Company Overview

11.6.2 Financial

11.6.3 Product/ Services Offered

11.6.4 SWOT Analysis

11.7 DayGlo Color Corp.

11.7.1 Company Overview

11.7.2 Financial

11.7.3 Product/ Services Offered

11.7.4 SWOT Analysis

11.8 BASF

11.8.1 Company Overview

11.8.2 Financial

11.8.3 Product/ Services Offered

11.8.4 SWOT Analysis

11.9 Geotech International B.V.

     11.9.1 Company Overview

11.9.2 Financial

11.9.3 Product/ Services Offered

11.9.4 SWOT Analysis

11.10 Neelikon

11.10.1 Company Overview

11.10.2 Financial

11.10.3 Product/ Services Offered

11.10.4 SWOT Analysis

12. Use Cases and Best Practices

13. Conclusion

An accurate research report requires proper strategizing as well as implementation. There are multiple factors involved in the completion of good and accurate research report and selecting the best methodology to compete the research is the toughest part. Since the research reports we provide play a crucial role in any company’s decision-making process, therefore we at SNS Insider always believe that we should choose the best method which gives us results closer to reality. This allows us to reach at a stage wherein we can provide our clients best and accurate investment to output ratio.

Each report that we prepare takes a timeframe of 350-400 business hours for production. Starting from the selection of titles through a couple of in-depth brain storming session to the final QC process before uploading our titles on our website we dedicate around 350 working hours. The titles are selected based on their current market cap and the foreseen CAGR and growth.


The 5 steps process:

Step 1: Secondary Research:

Secondary Research or Desk Research is as the name suggests is a research process wherein, we collect data through the readily available information. In this process we use various paid and unpaid databases which our team has access to and gather data through the same. This includes examining of listed companies’ annual reports, Journals, SEC filling etc. Apart from this our team has access to various associations across the globe across different industries. Lastly, we have exchange relationships with various university as well as individual libraries.

Secondary Research

Step 2: Primary Research

When we talk about primary research, it is a type of study in which the researchers collect relevant data samples directly, rather than relying on previously collected data.  This type of research is focused on gaining content specific facts that can be sued to solve specific problems. Since the collected data is fresh and first hand therefore it makes the study more accurate and genuine.

We at SNS Insider have divided Primary Research into 2 parts.

Part 1 wherein we interview the KOLs of major players as well as the upcoming ones across various geographic regions. This allows us to have their view over the market scenario and acts as an important tool to come closer to the accurate market numbers. As many as 45 paid and unpaid primary interviews are taken from both the demand and supply side of the industry to make sure we land at an accurate judgement and analysis of the market.

This step involves the triangulation of data wherein our team analyses the interview transcripts, online survey responses and observation of on filed participants. The below mentioned chart should give a better understanding of the part 1 of the primary interview.

Primary Research

Part 2: In this part of primary research the data collected via secondary research and the part 1 of the primary research is validated with the interviews from individual consultants and subject matter experts.

Consultants are those set of people who have at least 12 years of experience and expertise within the industry whereas Subject Matter Experts are those with at least 15 years of experience behind their back within the same space. The data with the help of two main processes i.e., FGDs (Focused Group Discussions) and IDs (Individual Discussions). This gives us a 3rd party nonbiased primary view of the market scenario making it a more dependable one while collation of the data pointers.

Step 3: Data Bank Validation

Once all the information is collected via primary and secondary sources, we run that information for data validation. At our intelligence centre our research heads track a lot of information related to the market which includes the quarterly reports, the daily stock prices, and other relevant information. Our data bank server gets updated every fortnight and that is how the information which we collected using our primary and secondary information is revalidated in real time.

Data Bank Validation

Step 4: QA/QC Process

After all the data collection and validation our team does a final level of quality check and quality assurance to get rid of any unwanted or undesired mistakes. This might include but not limited to getting rid of the any typos, duplication of numbers or missing of any important information. The people involved in this process include technical content writers, research heads and graphics people. Once this process is completed the title gets uploader on our platform for our clients to read it.

Step 5: Final QC/QA Process:

This is the last process and comes when the client has ordered the study. In this process a final QA/QC is done before the study is emailed to the client. Since we believe in giving our clients a good experience of our research studies, therefore, to make sure that we do not lack at our end in any way humanly possible we do a final round of quality check and then dispatch the study to the client.

Key Segments:

By Composition

  • Organic Pigments

  • Inorganic Pigments

By Type

  • Special Effect Pigments

  • Surface Treated Pigments

  • Nano Pigments

  • Natural Colorants

By Application

  • Facial Makeup

  • Lip Products

  • Hair Color Products

  • Eye Makeup

  • Others

Request for Segment Customization as per your Business Requirement: Segment Customization Request

Regional Coverage:

North America

  • US

  • Canada

  • Mexico

Europe

  • Eastern Europe

    • Poland

    • Romania

    • Hungary

    • Turkey

    • Rest of Eastern Europe

  • Western Europe

    • Germany

    • France

    • UK

    • Italy

    • Spain

    • Netherlands

    • Switzerland

    • Austria

    • Rest of Western Europe

Asia Pacific

  • China

  • India

  • Japan

  • South Korea

  • Vietnam

  • Singapore

  • Australia

  • Rest of Asia Pacific

Middle East & Africa

  • Middle East

    • UAE

    • Egypt

    • Saudi Arabia

    • Qatar

    • Rest of Middle East

  • Africa

    • Nigeria

    • South Africa

    • Rest of Africa

  • Latin America

  • Brazil

  • Argentina

  • Colombia

  • Rest of Latin America 

Request for Country Level Research Report: Country Level Customization Request

Available Customization

With the given market data, SNS Insider offers customization as per the company’s specific needs. The following customization options are available for the report:

  • Detailed Volume Analysis

  • Criss-Cross segment analysis (e.g. Product X Application)

  • Competitive Product Benchmarking

  • Geographic Analysis

  • Additional countries in any of the regions

  • Customized Data Representation

  • Detailed analysis and profiling of additional market players


  •            5000 (33% Discount)


  •            8950 (40% Discount)


  •            3050 (23% Discount)

Start a Conversation

Hi! Click one of our member below to chat on Phone