Cosmetic Dentistry Market Size:
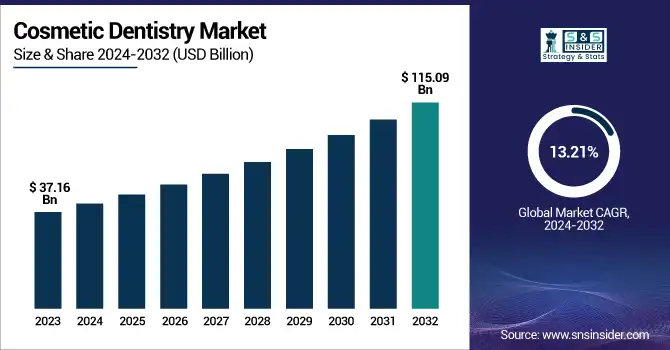
The Cosmetic Dentistry Market size was USD 37.16 billion in 2023 and is projected to reach USD 115.09 billion by 2032, with a CAGR of 13.21% during the forecast period.
The cosmetic dentistry market is growing exponentially, supported by increasing demands for aesthetic enhancement and improvements in surgical techniques and technologies. It is due to the increased influence of social media, increase in disposable income, and heightened awareness of aesthetic treatments that the adoption of cosmetic surgery has been driven considerably across the world. Non-invasive and minimally invasive procedures such as Botox, dermal fillers, and laser-based treatments are gaining popularity because recovery times are shorter and risks are lower. The American Society of Plastic Surgeons reported a sharp increase in minimally invasive cosmetic procedures, with botulinum toxin injections still the most popular.
Get More Information on Cosmetic Dentistry Market - Request Sample Report
New research by Dentistry 2023, has discovered that one in three people aged under 35 have had some form of cosmetic dental treatment in the last year, with a mean spend of USD 3773.34 in the 25-34 age group, 10% spent USD 2565.50 or more, and all of this spending is for cosmetic reasons to make their teeth look better. However, average spending on more regular dental care, such as appointments or products used to keep the teeth healthy, was a paltry USD 427.93 over the same period. The report said 20% of respondents had cosmetic work done by a dentist, 17% had treatments completed at home in the form of whitening kits or teeth aligners, and 4% used both services.
Technologies are evolving, for example, with 3D imaging systems, robotic-assisted surgery, and laser technologies revolutionizing the industry. For example, Allergan Aesthetics recently announced a new and improved version of its CoolSculpting Elite device that has been optimized for non-invasive fat reduction with precision, further improving outcomes for patients. Another factor has been the introduction of combination treatments where multiple procedures are performed within a single treatment session, increasing results and therefore patient satisfaction.
This trend is further accelerated by recent FDA approvals and new products in the market. For example, Revance Therapeutics has received FDA approval for RHA Collection dermal fillers for wrinkles and folds. This reflects the trend of dynamic changes in cosmetic treatments. Growth in medical tourism also accelerates market growth, primarily from South Korea, Brazil, and India, due to low-priced services with state-of-the-art surgical options.
Cosmetic Dentistry Market Dynamics
Drivers
-
Rising Demand for Minimally Invasive Procedures propels the cosmetic surgery market growth.
The demand for minimally invasive cosmetic treatments is the main driving force behind the cosmetic surgery market. Botox, dermal fillers, chemical peels, and laser resurfacing are procedures that have become popular because they have shorter recovery periods, fewer risks, and are less expensive than traditional surgical methods. According to the American Society of Plastic Surgeons 2023, more than 26.2 million minimally invasive treatments were recorded in 2022. New FDA-approved long-lasting fillers and laser systems with precision continue to advance patient results and open doors. These treatments also tend to appeal to younger demographics, as increasingly more individuals in their 20s and 30s begin seeking preventive anti-aging solutions significant extension of the market.
-
The Influence of social media and Changing Beauty Standards increased the demand for cosmetic dentistry surgery.
Influencers, celebrities, and beauty gurus share their experiences on Instagram, YouTube, and TikTok, increasing awareness and demand for aesthetic procedures. The American Academy of Facial Plastic and Reconstructive Surgery conducted a survey that found that in 2022, 72% of surgeons said patients wanted cosmetic treatments to look better in selfies and on social media platforms. This perception has heightened demand for non-surgical enhancements such as lip fillers and contouring and surgical procedures like rhinoplasty. Further, the "Zoom Effect" with more work-from-home culture and video conferencing is increasingly fuelling the interest in facial rejuvenation treatments perceived to address imperfections when viewed through cameras, hence pushing the growth in the market.
Restraint
-
High Cost of Cosmetic Procedures restraining the cosmetic dentistry market.
Dentistry is restrained from market expansion by the outrageous costs of most cosmetic surgeries, even though these cosmetic treatments are necessary for most medical professionals. There exists an elective medical process in nature cosmetic treatment entails surgical treatment not covered by healthcare insurance therefore affecting patients at will. For example, a surgical process like rhinoplasty or liposuction may range from USD 5,000 to as high as USD 15,000 or more depending on the place and the procedure, but a non-surgical treatment like Botox or fillers requires frequent refills that raise costs over time. These are highly costly and not available to quite a good portion of the population, especially third-world countries that hardly have disposable income. However, direct and indirect post-procedure costs such as follow-up visits, medicine, and recovery tools discourage would-be patients. This cost factor prevents the market from expanding more significantly in the mid and lower economies.
Segmentation Analysis
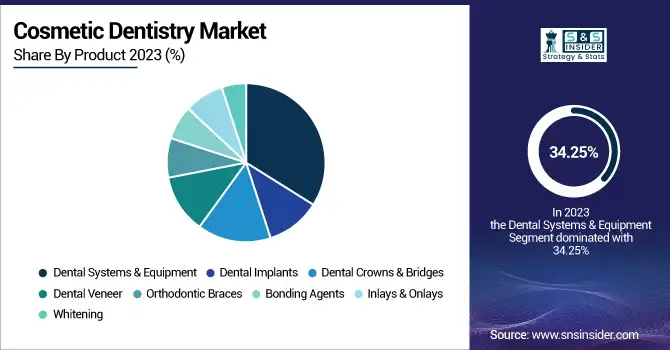
By Product
The dental systems & equipment segment dominated the cosmetic dentistry market with a 34.25% market share. They are highly prevalent in cosmetic surgery because the market has always been in tune with technological improvements and aesthetic demand for dental work. The technologies involved include laser treatments, 3D imaging, and CAD, which improved the precision by many folds in the process of dental treatment and allowed for minimally invasive processes. As such, cosmetic dental treatments such as whitening teeth, veneers, and orthodontics become popular. Increased emphasis on appearance by society and increasing awareness have brought many consumers who now seek dental procedures to beautify their smiles. Moreover, dental systems & equipment enable the practitioner to offer efficient, quality treatments that fulfill this growing need. As non-invasive procedures with rapid recovery times are priorities for both practitioners and patients, dental systems & equipment are inevitable to the cosmetic surgery market growth and dominance.
The Orthodontic Braces segment is experience to witness the fastest growth throughout the forecast period with 28.33% CAGR, due to rising demand for better dental aesthetics and growing dental health awareness. The demand for orthodontic braces has picked up dramatically with teenagers and adults putting more emphasis on correcting misaligned teeth and bites. Some innovations in the technology of orthodontic braces, such as clear aligners, have made orthodontic treatment pretty discreet and comfortable, thus attracting a wider demographic. The increased demand for a perfect smile caused by social media further fuels orthodontic treatments. Increasing the aspect of appearance, with the additional factor of affordability and accessibility of braces, leads to increased adoption, moving orthodontic braces to the front as a major growth driver in the cosmetic surgery market.
Cosmetic Dentistry Market Regional Insights
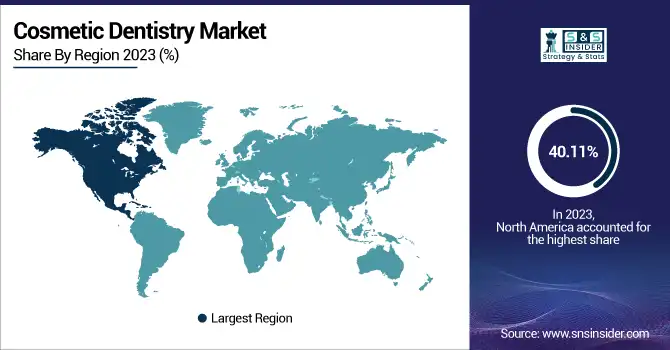
North America dominated the cosmetic dentistry market with a 40.11% market share due to highly developed healthcare infrastructure, significant disposable income, and strong social emphasis on aesthetics and personal image. Though the U.S. is the largest cosmetic surgery market, there is also an aging population looking for rejuvenation, enhanced technological advancements with surgical techniques, and a growth in the adoption of minimally invasive treatments. Celebrity culture and social media also inspire many people to have cosmetic procedures for better physical looks.
The Asia Pacific region is growing the fastest in the cosmetic dentistry market with a 16.47% CAGR, because of the growing middle class, increasing urbanization, and expanding access to sophisticated medical technologies. Countries such as South Korea, Japan, and China lead, but South Korea alone is so called as "plastic surgery capital of the world." Producers such as double eyelid surgery, rhinoplasty, and rejuvenating the skin have taken shoots to high tide levels. For those individuals with dreams already within sight of fulfillment, having surgery becomes an aesthetic enhancement to more successful lives, either at personal or professional dimensions. The popularity of non-invasive procedures such as Botox and dermal fillers is increasing due to lower costs as well as short recovery times thereby driving the further expansion of markets.
Get Customized Report as per Your Business Requirement - Request For Customized Report
Key Players in the Cosmetic Dentistry Market
-
Dentsply Sirona (CEREC CAD/CAM System, SureSmile Clear Aligners)
-
Align Technology, Inc. (Invisalign, iTero Intraoral Scanner)
-
3M Company (Filtek Dental Restoratives, Clinpro Sealant)
-
Zimmer Biomet (T3 Implants, Trabecular Metal Dental Implants)
-
Envista Holdings Corporation (Nobel Biocare Implants, Spark Clear Aligners)
-
GC Corporation (G-CEM LinkForce, Initial LiSi Veneers)
-
Straumann Group (BLX Implants, ClearCorrect Aligners)
-
Henry Schein, Inc. (E4D CAD/CAM System, BioCeram Crowns)
-
Planmeca Oy (Planmeca Creo C5, ProMax 3D Imaging Systems)
-
Danaher Corporation (KaVo Dental Instruments, Ormco Brackets)
-
Ivoclar Vivadent AG (IPS e.max, Bluephase PowerCure)
-
Coltene Holding AG (Brilliant EverGlow, HyFlex CM)
-
BIOLASE, Inc. (Waterlase, Epic X Laser)
-
Carestream Dental (CS 3600 Intraoral Scanner, CS 9600 CBCT System)
-
Shofu Dental Corporation (Beautifil II, EyeSpecial C-III Dental Camera)
-
Vatech (PaX-i 3D Green, EzRay Air Portable)
-
Bicon Dental Implants (SHORT Implants, Integrated Abutment Crowns)
-
Philips Sonicare (Philips Zoom Whitening Kits, Sonicare DiamondClean Toothbrush)
-
Kuraray Noritake Dental Inc. (PANAVIA SA Cement, KATANA Zirconia)
-
Voco GmbH (Admira Fusion, GrandioSO)
Suppliers (These suppliers play a critical role in supporting cosmetic dentistry product innovation and manufacturing.)
-
BASF SE
-
Evonik Industries AG
-
Mitsui Chemicals
-
3M Oral Care
-
Heraeus Kulzer GmbH
-
Dupont
-
Solvay
-
SABIC
-
Kuraray Co., Ltd.
-
Kurabo Industries
Recent Development in the Cosmetic Dentistry Industry
-
In October 2024, Align Technology, Inc. announced the launch of updated Invisalign Smile Architect software. The latest release, Multiple Treatment Plans, lets doctors visually review and compare orthodontic and ortho-restorative plans side by side in the ClinCheck software. This advancement simplifies treatment planning, guiding physicians in selecting the best option for each patient.
-
In May 2024 - The Swiss-based dental implant company, Straumann, introduced its high end range system of implants iEXCEL in France, achieving a noteworthy advancement in artificial teeth and dental implants. The system provides dental experts with accurate and visually attractive models.
| Report Attributes | Details |
|---|---|
| Market Size in 2023 | US$ 37.16 Billion |
| Market Size by 2032 | US$ 115.09 Billion |
| CAGR | CAGR of 13.21% From 2024 to 2032 |
| Base Year | 2023 |
| Forecast Period | 2024-2032 |
| Historical Data | 2020-2022 |
| Report Scope & Coverage | Market Size, Segments Analysis, Competitive Landscape, Regional Analysis, DROC & SWOT Analysis, Forecast Outlook |
| Key Segments | • By Product (Dental Systems & Equipment, Dental Implants, Dental Crowns & Bridges, Dental Veneer, Orthodontic Braces, Bonding Agents, Inlays & Onlays, Whitening) |
| Regional Analysis/Coverage | North America (US, Canada, Mexico), Europe (Eastern Europe [Poland, Romania, Hungary, Turkey, Rest of Eastern Europe] Western Europe] Germany, France, UK, Italy, Spain, Netherlands, Switzerland, Austria, Rest of Western Europe]), Asia Pacific (China, India, Japan, South Korea, Vietnam, Singapore, Australia, Rest of Asia Pacific), Middle East & Africa (Middle East [UAE, Egypt, Saudi Arabia, Qatar, Rest of Middle East], Africa [Nigeria, South Africa, Rest of Africa], Latin America (Brazil, Argentina, Colombia, Rest of Latin America) |
| Company Profiles | Dentsply Sirona, Align Technology, Inc., 3M Company, Zimmer Biomet, Envista Holdings Corporation, GC Corporation, Straumann Group, Henry Schein, Inc., Planmeca Oy, Danaher Corporation, Ivoclar Vivadent AG, Coltene Holding AG, BIOLASE, Inc., Carestream Dental, Shofu Dental Corporation, Vatech, Bicon Dental Implants, Philips Sonicare, Kuraray Noritake Dental Inc., Voco GmbH. |
| Key Drivers | •Rising Demand for Minimally Invasive Procedures propels the cosmetic surgery market growth. •The Influence of social media and Changing Beauty Standards increased the demand for cosmetic surgery. |
| Restraints | •High Cost of Cosmetic Procedures restraining the cosmetic surgery market. |
