image

Corrosion Inhibitors Market Report Scope & Overview

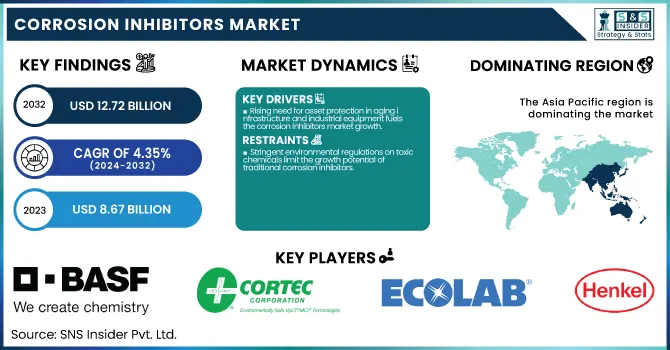
The Corrosion Inhibitors Market size was USD 8.67 billion in 2023 and is expected to reach USD 12.72 billion by 2032 and grow at a CAGR of 4.35% over the forecast period of 2024-2032.

Corrosion Inhibitors Market Revenue Analysis

To Get more information on Corrosion Inhibitors Market - Request Free Sample Report

​It offers detailed analysis of production capacity and utilization rates by type and region for 2023. It includes detailed tracking of raw material price trends and fluctuations across key countries. The report evaluates regulatory frameworks impacting the corrosion inhibitors industry, with specific attention to compliance shifts and environmental restrictions. It further assesses carbon emission data, waste management practices, and sustainability initiatives adopted by major manufacturers. Innovation trends are covered, highlighting R&D investments in eco-friendly and high-performance inhibitor formulations. Additionally, adoption rates of corrosion monitoring software and key features analysis are presented by region, supporting strategic decision-making. This comprehensive dataset supports manufacturers, policymakers, and investors in understanding evolving market dynamics.

The Corrosion Inhibitors market in the United States was Market size was USD 1.41 billion in 2023 and is expected to reach USD 2.17 billion by 2032 and grow at a CAGR of 4.89% over the forecast period of 2024-2032. This is due to its highly developed industrial infrastructure, stringent regulatory framework, and substantial demand across key end-use sectors such as oil & gas, power generation, water treatment, and automotive manufacturing. The country’s extensive pipeline and refinery network, coupled with the presence of aging infrastructure, necessitates the regular use of corrosion inhibitors to ensure operational safety and efficiency. Moreover, strong government enforcement of environmental regulations from agencies like the EPA has encouraged the use of advanced, environmentally friendly corrosion protection solutions. The presence of global industry leaders such as BASF Corporation, Henkel, and Dow Inc., along with ongoing innovation and investment in sustainable corrosion prevention technologies, further strengthens the U.S. market position.

Market Dynamics

Drivers

  • Rising need for asset protection in aging infrastructure and industrial equipment fuels the corrosion inhibitors market growth.

A major driver propelling the corrosion inhibitors market is the growing demand for asset preservation in aging infrastructure, particularly in sectors such as oil & gas, power generation, water treatment, and manufacturing. In the U.S., over 60% of pipelines and industrial assets are more than 30 years old, as reported by the U.S. Department of Transportation in 2023. These aging systems are more prone to corrosion, necessitating regular maintenance and the use of high-performance inhibitors to ensure safety and operational efficiency. Furthermore, industries are increasingly investing in corrosion prevention to avoid costly unplanned shutdowns, environmental incidents, and structural failures. This has spurred demand for advanced, cost-effective, and eco-friendly corrosion inhibitors that can extend the life of critical infrastructure, reduce maintenance costs, and comply with strict environmental regulations.

Restrain

  • Stringent environmental regulations on toxic chemicals limit the growth potential of traditional corrosion inhibitors.

One of the major restraints hampering market expansion is the increasing enforcement of stringent environmental regulations related to the use of hazardous chemicals in corrosion inhibitors. Government agencies such as the U.S. Environmental Protection Agency (EPA) and the European Chemicals Agency (ECHA) have restricted the use of certain phosphate-based and chromate-containing inhibitors due to their adverse environmental and health impacts. This has forced manufacturers to either reformulate existing products or invest heavily in the development of greener alternatives. However, eco-friendly formulations often come with higher production costs and may not match the performance of traditional inhibitors in extreme conditions. As a result, the industry faces challenges in striking a balance between regulatory compliance, product performance, and cost-effectiveness, which slows down adoption rates, particularly in developing countries with price-sensitive markets.

Opportunity

  • Rising demand for green and bio-based inhibitors presents lucrative opportunities for sustainable product innovation.

The increasing global emphasis on sustainability and environmental safety has opened up significant opportunities in the development of green and bio-based corrosion inhibitors. With regulatory bodies pushing for lower emissions and less toxic chemicals, industries are shifting towards formulations derived from natural extracts, plant oils, and biodegradable compounds. For example, recent R&D trends have focused on inhibitors based on amino acids, chitosan, and lignin derivatives that offer corrosion protection with minimal environmental impact. Governments and organizations are also offering grants and incentives for sustainable chemical innovations. This transition is particularly gaining momentum in industries such as water treatment and marine coatings, where ecological sensitivity is paramount. The rising adoption of circular economy principles and eco-label certifications in industrial procurement further supports the commercial viability of sustainable corrosion inhibitor products.

Challenge

  • Difficulty in achieving long-term corrosion protection in harsh industrial and marine environments poses a major challenge.

Despite technological advancements, delivering long-lasting corrosion protection in highly aggressive environments remains a key challenge for the market. Sectors like offshore oil & gas, chemical processing, and marine transport operate under extreme conditions involving high salinity, pressure, temperature, and chemical exposure. Traditional inhibitors often degrade over time or fail to provide consistent performance under such stress. Furthermore, the development of high-performance formulations that can endure these harsh conditions while remaining environmentally safe is both technologically complex and cost-intensive. Research into nanotechnology-enhanced and smart-release inhibitors is ongoing but not yet widely commercialized. These performance limitations hinder the ability of corrosion inhibitors to offer reliable, long-term solutions in critical applications, making end-users wary of complete dependence on chemical solutions and prompting investments in supplementary mechanical protection methods.

Segmentation Analysis

By Product

Inorganic pigments held the largest market share around 68% in 2023. It is due to their eco-friendly composition, cost-effectiveness, and compatibility with various industrial applications. These inhibitors, often derived from amines, carboxylic acids, and plant extracts, are increasingly favored for their biodegradability and low toxicity, aligning with global environmental regulations. Unlike their inorganic counterparts, organic inhibitors offer excellent film-forming capabilities, providing effective protection in both aqueous and non-aqueous systems, including oil & gas, water treatment, and metalworking industries. Moreover, advancements in green chemistry have led to the development of high-performance organic inhibitors that can function efficiently under harsh conditions while reducing environmental hazards. With industries prioritizing sustainable solutions and governments incentivizing the adoption of cleaner chemicals, the demand for organic corrosion inhibitors continues to rise, solidifying their dominant position in the global market.

 By Type

Oil Based held the largest market share at around 58% in 2023. It is due to their superior long-lasting protection and strong affinity for metal surfaces in harsh environments. These inhibitors are particularly effective in industries like oil & gas, marine, and automotive, where equipment is exposed to moisture, salt, and other corrosive agents. The oil-based formulation forms a hydrophobic barrier that resists water penetration and adheres tightly to metal surfaces, preventing oxidation and corrosion over extended periods. Additionally, oil-based inhibitors perform well under extreme temperatures and pressures, making them ideal for pipelines, offshore platforms, and machinery lubrication systems. Their ease of application and compatibility with existing industrial processes further contribute to widespread adoption. As industries continue to prioritize equipment longevity and operational reliability, the robust performance of oil-based corrosion inhibitors drives their dominance in the market.

By End Use

Oil and Gas held the largest market share, around 32%, in 2023. This is due to the vulnerability of critical infrastructure to corrosion-related damage in the oil and gas sector, the corrosion inhibitors market has been dominated by the oil and gas industry. Pipelines, storage tanks, and drilling equipment, as well as refineries, function in particularly corrosive conditions including saltwater, hydrogen sulfide, and higher temperatures. Due to the serious safety threats, operational interruption, and financial loss that corrosion causes, the industry expends a lot of its resources on solutions to prevent corrosion. The importance of corrosion inhibitors for upstream and downstream operations is evident for asset integrity, equipment longevity, and meeting stringent environmental and safety regulations. In addition, there has been an increase of energy demand on a global scale and oil exploration in offshore and deepwater areas which creates a greater initiative to develop reliable and effective corrosion protection technologies.

Regional Analysis

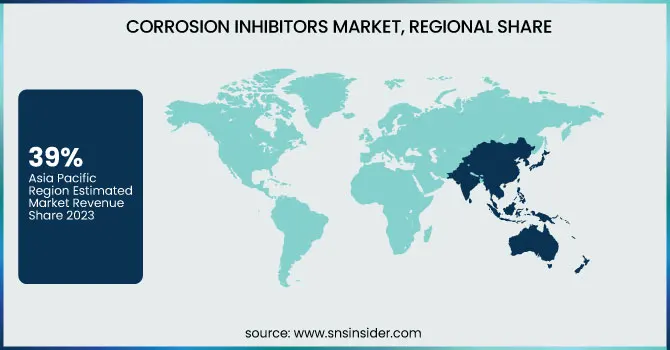
Asia Pacific held the largest market share, around 39%, in 2023. This is due to its rapid industrialization, expansive manufacturing base, and significant investments in infrastructure and energy sectors. Countries such as China, India, Japan, and South Korea have witnessed substantial growth in industries like oil & gas, power generation, construction, and water treatment key areas that demand extensive use of corrosion inhibitors to maintain operational efficiency and reduce equipment wear. Additionally, rising urbanization and the development of smart cities have increased the need for protective coatings and maintenance chemicals. Government initiatives promoting industrial expansion and stricter environmental regulations regarding corrosion-related pollution have further accelerated demand. Moreover, the availability of raw materials and cost-effective manufacturing processes in the region support large-scale production and consumption of corrosion inhibitors, solidifying Asia Pacific's dominant position in the global market.

North America held a significant market share. It is due to its well-established industrial and energy infrastructure, particularly in the oil & gas, chemical processing, and power generation sectors. The United States, being one of the world’s largest producers of oil and natural gas, heavily relies on corrosion protection solutions to extend the life of pipelines, storage tanks, and refinery equipment. Additionally, stringent environmental and safety regulations enforced by agencies like the U.S. Environmental Protection Agency (EPA) have pushed industries toward the use of advanced, eco-friendly corrosion inhibitors. High R&D investments by key players, coupled with technological advancements in formulation and application techniques, further boost the market. The presence of major manufacturers and a mature distribution network ensures steady supply and adoption, reinforcing North America’s significant share in the global corrosion inhibitors market.

Corrosion Inhibitors Market Regional Share

Get Customized Report as per Your Business Requirement - Enquiry Now

Key Players

  • BASF SE (Irgamet 42, Basocorr 2500)

  • Cortec Corporation (VpCI-377, VpCI-609)

  • Ecolab Inc. (Nalco 77362, Nalco 72210)

  • Henkel AG & Co. KGaA (BONDERITE L-GP, AQUENCE CS)

  • Ashland Global (Drewgard 251, Drewplus L-493)

  • The Lubrizol Corporation (Carbosperse K-797, LUBRIZOL 677A)

  • Dow Inc. (VERSENE NA2, ACUMER 3100)

  • Solvay (OXYNOX 200, ACTISOL 550)

  • Solenis (Zinc BZT 216, Spectrus NX1100)

  • Daubert Chemical Company (Nox-Rust 9300, Tectyl 300G)

  • LANXESS (Bayhibit AM, Velcorin)

  • Dorf Ketal Chemicals (Doral 2785, Dorchem 364)

  • INOLEX (Lexgard O, LexFeel N5)

  • AkzoNobel (Intergard 251, Resicoat R 4-ES)

  • Italmatch Chemicals (Dequest 2010, Briquest ADPA)

  • GE Water & Process Technologies (CorrShield 100, Spectrus CT130)

  • Chemtreat Inc. (CWT 150, CWT 300)

  • W.R. Grace & Co. (DARACLAR 910, GRACE XDS)

  • ICL Group (FERTINOR M-6, PHOSCHECK)

  • Axalta Coating Systems (Nap-Gard 7-2555, Alesta AM)

Recent Development:

  • In June 2024, BASF introduced a new range of eco-friendly anti-rust solutions tailored for the automotive and manufacturing industries. These innovative products are engineered to deliver high-performance corrosion protection while adhering to strict environmental compliance standards.

  • In May 2024, AkzoNobel launched a new line of marinized corrosion inhibitors designed to improve protection for ships and offshore structures operating in extreme marine conditions. This launch supports the company’s commitment to sustainable growth and environmental responsibility.

Corrosion Inhibitors Market Report Scope:

Report Attributes Details
Market Size in 2023 USD 8.67 Billion
Market Size by 2032 USD12.72Billion
CAGR CAGR of4.35 % From 2024 to 2032
Base Year 2023
Forecast Period 2024-2032
Historical Data 2020-2022
Report Scope & Coverage Market Size, Segments Analysis, Competitive  Landscape, Regional Analysis, DROC & SWOT Analysis, Forecast Outlook
Key Segments • By Composition (Organic, Inorganic)
• By Type (Water Based, Oil Based)
• By End Use (Oil and Gas, Power Generation, Metal Processing, Water Treatment, Chemical Processing, Paper and Pulp, Other)
Regional Analysis/Coverage North America (US, Canada, Mexico), Europe (Eastern Europe [Poland, Romania, Hungary, Turkey, Rest of Eastern Europe] Western Europe] Germany, France, UK, Italy, Spain, Netherlands, Switzerland, Austria, Rest of Western Europe]), Asia Pacific (China, India, Japan, South Korea, Vietnam, Singapore, Australia, Rest of Asia Pacific), Middle East & Africa (Middle East [UAE, Egypt, Saudi Arabia, Qatar, Rest of Middle East], Africa [Nigeria, South Africa, Rest of Africa], Latin America (Brazil, Argentina, Colombia, Rest of Latin America)
Company Profiles BASF SE, Cortec Corporation, Ecolab Inc., Henkel AG & Co. KGaA, Ashland Global, The Lubrizol Corporation, Dow Inc., Solvay, Solenis, Daubert Chemical Company, LANXESS, Dorf Ketal Chemicals, INOLEX, AkzoNobel, Italmatch Chemicals, GE Water & Process Technologies, Chemtreat Inc., W.R. Grace & Co., ICL Group, Axalta Coating Systems

Frequently Asked Questions

Ans: The Corrosion Inhibitors Market was valued at USD 8.67 Billion in 2023.

Ans: The expected CAGR of the global Corrosion Inhibitors Market during the forecast period is 4.35%.

Ans: Organic will grow rapidly in the Corrosion Inhibitors Market from 2024 to 2032.

Ans: Rising consumer demand for organic and eco-friendly Corrosion Inhibitors accelerates the Corrosion Inhibitors market growth.

Ans: Asia Pacific led the Corrosion Inhibitors Market in the region with the highest revenue share in 2023.

Table of Contents

1. Introduction

1.1 Market Definition

1.2 Scope (Inclusion and Exclusions)

1.3 Research Assumptions

2. Executive Summary

2.1 Market Overview

2.2 Regional Synopsis

2.3 Competitive Summary

3. Research Methodology

3.1 Top-Down Approach

3.2 Bottom-up Approach

3.3. Data Validation

3.4 Primary Interviews

4. Market Dynamics Impact Analysis

4.1 Market Driving Factors Analysis

4.1.1 Drivers

4.1.2 Restraints

4.1.3 Opportunities

4.1.4 Challenges

4.2 PESTLE Analysis

4.3 Porter’s Five Forces Model

5. Statistical Insights and Trends Reporting

    5.1 Production Capacity and Utilization by Country and by Type, 2023

    5.2 Regulatory Impact by Country and by Type, 2023

  5.3 Environmental Metrics: Emissions Data, Waste Management Practices, and Sustainability Initiatives by region

   5.4 Innovation and R&D, by Type, 2023

6. Competitive Landscape

6.1 List of Major Companies, By Region

6.2 Market Share Analysis, By Region

6.3 Product Benchmarking

6.3.1 Product specifications and features

6.3.2 Pricing

6.4 Strategic Initiatives

6.4.1 Marketing and promotional activities

6.4.2 Distribution and Supply Chain Strategies

6.4.3 Expansion plans and new Product launches

6.4.4 Strategic partnerships and collaborations

6.5 Technological Advancements

6.6 Market Positioning and Branding

7. Corrosion Inhibitors Market Segmentation By Product

7.1 Chapter Overview

7.2 Organic

        7.2.1 Organic Market Trends Analysis (2020-2032)

7.2.2 Organic Market Size Estimates and Forecasts to 2032 (USD Billion)

7.3 Inorganic

     7.3.1 Inorganic Market Trends Analysis (2020-2032)

          7.3.2 Inorganic Market Size Estimates and Forecasts to 2032 (USD Billion)

8. Corrosion Inhibitors Market Segmentation By Type

8.1 Chapter Overview

8.2 Water Based

     8.2.1 Water Based Market Trend Analysis (2020-2032)

           8.2.2 Water Based Market Size Estimates and Forecasts to 2032 (USD Billion)

8.3 Oil Based

      8.3.1 Oil Based Market Trends Analysis (2020-2032)

           8.3.2 Oil Based Market Size Estimates and Forecasts to 2032 (USD Billion)

9. Corrosion Inhibitors Market Segmentation By End Use

9.1 Chapter Overview

9.2 Oil and Gas

        9.2.1 Oil and Gas Market Trends Analysis (2020-2032)

9.2.2 Oil and Gas Market Size Estimates and Forecasts to 2032 (USD Billion)

9.3 Power Generation

        9.3.1 Power Generation Market Trends Analysis (2020-2032)

9.3.2 Power Generation Market Size Estimates and Forecasts to 2032 (USD Billion)

9.4 Metal Processing

        9.4.1 Metal Processing Market Trends Analysis (2020-2032)

9.4.2 Metal Processing Market Size Estimates and Forecasts to 2032 (USD Billion)

9.5 Water Treatment

        9.5.1 Water Treatment Market Trends Analysis (2020-2032)

9.5.2 Water Treatment Market Size Estimates and Forecasts to 2032 (USD Billion)

9.6 Chemical Processing

        9.6.1 Chemical Processing Market Trends Analysis (2020-2032)

9.6.2 Chemical Processing Market Size Estimates and Forecasts to 2032 (USD Billion)

9.7 Paper and Pulp

        9.7.1 Paper and Pulp Market Trends Analysis (2020-2032)

9.7.2 Paper and Pulp Market Size Estimates and Forecasts to 2032 (USD Billion)

9.8 Other

        9.8.1 Other Market Trends Analysis (2020-2032)

9.8.2 Other Market Size Estimates and Forecasts to 2032 (USD Billion)

10. Regional Analysis

10.1 Chapter Overview

10.2 North America

10.2.1 Trends Analysis

10.2.2 North America Corrosion Inhibitors Market Estimates and Forecasts, by Country (2020-2032) (USD Billion)

10.2.3 North America Corrosion Inhibitors Market Estimates and Forecasts, By Product (2020-2032) (USD Billion) 

10.2.4 North America Corrosion Inhibitors Market Estimates and Forecasts, By Type (2020-2032) (USD Billion)

10.2.5 North America Corrosion Inhibitors Market Estimates and Forecasts, By End Use (2020-2032) (USD Billion)

10.2.6 USA

10.2.6.1 USA Corrosion Inhibitors Market Estimates and Forecasts, By Product (2020-2032) (USD Billion)

10.2.6.2 USA Corrosion Inhibitors Market Estimates and Forecasts, By Type (2020-2032) (USD Billion)

10.2.6.3 USA Corrosion Inhibitors Market Estimates and Forecasts, By End Use (2020-2032) (USD Billion)

10.2.7 Canada

10.2.7.1 Canada Corrosion Inhibitors Market Estimates and Forecasts, By Product (2020-2032) (USD Billion)

10.2.7.2 Canada Corrosion Inhibitors Market Estimates and Forecasts, By Type (2020-2032) (USD Billion)

10.2.7.3 Canada Corrosion Inhibitors Market Estimates and Forecasts, By End Use (2020-2032) (USD Billion)

10.2.8 Mexico

10.2.8.1 Mexico Corrosion Inhibitors Market Estimates and Forecasts, By Product (2020-2032) (USD Billion)

10.2.8.2 Mexico Corrosion Inhibitors Market Estimates and Forecasts, By Type (2020-2032) (USD Billion)

10.2.8.3 Mexico Corrosion Inhibitors Market Estimates and Forecasts, By End Use (2020-2032) (USD Billion)

10.3 Europe

10.3.1 Eastern Europe

10.3.1.1 Trends Analysis

10.3.1.2 Eastern Europe Corrosion Inhibitors Market Estimates and Forecasts, by Country (2020-2032) (USD Billion)

10.3.1.3 Eastern Europe Corrosion Inhibitors Market Estimates and Forecasts, By Product (2020-2032) (USD Billion) 

10.3.1.4 Eastern Europe Corrosion Inhibitors Market Estimates and Forecasts, By Type (2020-2032) (USD Billion)

10.3.1.5 Eastern Europe Corrosion Inhibitors Market Estimates and Forecasts, By End Use (2020-2032) (USD Billion)

10.3.1.6 Poland

10.3.1.6.1 Poland Corrosion Inhibitors Market Estimates and Forecasts, By Product (2020-2032) (USD Billion)

10.3.1.6.2 Poland Corrosion Inhibitors Market Estimates and Forecasts, By Type (2020-2032) (USD Billion)

10.3.1.6.3 Poland Corrosion Inhibitors Market Estimates and Forecasts, By End Use (2020-2032) (USD Billion)

10.3.1.7 Romania

10.3.1.7.1 Romania Corrosion Inhibitors Market Estimates and Forecasts, By Product (2020-2032) (USD Billion)

10.3.1.7.2 Romania Corrosion Inhibitors Market Estimates and Forecasts, By Type (2020-2032) (USD Billion)

10.3.1.7.3 Romania Corrosion Inhibitors Market Estimates and Forecasts, By End Use (2020-2032) (USD Billion)

10.3.1.8 Hungary

10.3.1.8.1 Hungary Corrosion Inhibitors Market Estimates and Forecasts, By Product (2020-2032) (USD Billion)

10.3.1.8.2 Hungary Corrosion Inhibitors Market Estimates and Forecasts, By Type (2020-2032) (USD Billion)

10.3.1.8.3 Hungary Corrosion Inhibitors Market Estimates and Forecasts, By End Use (2020-2032) (USD Billion)

10.3.1.9 Turkey

10.3.1.9.1 Turkey Corrosion Inhibitors Market Estimates and Forecasts, By Product (2020-2032) (USD Billion)

10.3.1.9.2 Turkey Corrosion Inhibitors Market Estimates and Forecasts, By Type (2020-2032) (USD Billion)

10.3.1.9.3 Turkey Corrosion Inhibitors Market Estimates and Forecasts, By End Use (2020-2032) (USD Billion)

10.3.1.10 Rest of Eastern Europe

10.3.1.10.1 Rest of Eastern Europe Corrosion Inhibitors Market Estimates and Forecasts, By Product (2020-2032) (USD Billion)

10.3.1.10.2 Rest of Eastern Europe Corrosion Inhibitors Market Estimates and Forecasts, By Type (2020-2032) (USD Billion)

10.3.1.10.3 Rest of Eastern Europe Corrosion Inhibitors Market Estimates and Forecasts, By End Use (2020-2032) (USD Billion)

10.3.2 Western Europe

10.3.2.1 Trends Analysis

10.3.2.2 Western Europe Corrosion Inhibitors Market Estimates and Forecasts, by Country (2020-2032) (USD Billion)

10.3.2.3 Western Europe Corrosion Inhibitors Market Estimates and Forecasts, By Product (2020-2032) (USD Billion) 

10.3.2.4 Western Europe Corrosion Inhibitors Market Estimates and Forecasts, By Type (2020-2032) (USD Billion)

10.3.2.5 Western Europe Corrosion Inhibitors Market Estimates and Forecasts, By End Use (2020-2032) (USD Billion)

10.3.2.6 Germany

10.3.2.6.1 Germany Corrosion Inhibitors Market Estimates and Forecasts, By Product (2020-2032) (USD Billion)

10.3.2.6.2 Germany Corrosion Inhibitors Market Estimates and Forecasts, By Type (2020-2032) (USD Billion)

10.3.2.6.3 Germany Corrosion Inhibitors Market Estimates and Forecasts, By End Use (2020-2032) (USD Billion)

10.3.2.7 France

10.3.2.7.1 France Corrosion Inhibitors Market Estimates and Forecasts, By Product (2020-2032) (USD Billion)

10.3.2.7.2 France Corrosion Inhibitors Market Estimates and Forecasts, By Type (2020-2032) (USD Billion)

10.3.2.7.3 France Corrosion Inhibitors Market Estimates and Forecasts, By End Use (2020-2032) (USD Billion)

10.3.2.8 UK

10.3.2.8.1 UK Corrosion Inhibitors Market Estimates and Forecasts, By Product (2020-2032) (USD Billion)

10.3.2.8.2 UK Corrosion Inhibitors Market Estimates and Forecasts, By Type (2020-2032) (USD Billion)

10.3.2.8.3 UK Corrosion Inhibitors Market Estimates and Forecasts, By End Use (2020-2032) (USD Billion)

10.3.2.9 Italy

10.3.2.9.1 Italy Corrosion Inhibitors Market Estimates and Forecasts, By Product (2020-2032) (USD Billion)

10.3.2.9.2 Italy Corrosion Inhibitors Market Estimates and Forecasts, By Type (2020-2032) (USD Billion)

10.3.2.9.3 Italy Corrosion Inhibitors Market Estimates and Forecasts, By End Use (2020-2032) (USD Billion)

10.3.2.10 Spain

10.3.2.10.1 Spain Corrosion Inhibitors Market Estimates and Forecasts, By Product (2020-2032) (USD Billion)

10.3.2.10.2 Spain Corrosion Inhibitors Market Estimates and Forecasts, By Type (2020-2032) (USD Billion)

10.3.2.10.3 Spain Corrosion Inhibitors Market Estimates and Forecasts, By End Use (2020-2032) (USD Billion)

10.3.2.11 Netherlands

10.3.2.11.1 Netherlands Corrosion Inhibitors Market Estimates and Forecasts, By Product (2020-2032) (USD Billion)

10.3.2.11.2 Netherlands Corrosion Inhibitors Market Estimates and Forecasts, By Type (2020-2032) (USD Billion)

10.3.2.11.3 Netherlands Corrosion Inhibitors Market Estimates and Forecasts, By End Use (2020-2032) (USD Billion)

10.3.2.12 Switzerland

10.3.2.12.1 Switzerland Corrosion Inhibitors Market Estimates and Forecasts, By Product (2020-2032) (USD Billion)

10.3.2.12.2 Switzerland Corrosion Inhibitors Market Estimates and Forecasts, By Type (2020-2032) (USD Billion)

10.3.2.12.3 Switzerland Corrosion Inhibitors Market Estimates and Forecasts, By End Use (2020-2032) (USD Billion)

10.3.2.13 Austria

10.3.2.13.1 Austria Corrosion Inhibitors Market Estimates and Forecasts, By Product (2020-2032) (USD Billion)

10.3.2.13.2 Austria Corrosion Inhibitors Market Estimates and Forecasts, By Type (2020-2032) (USD Billion)

10.3.2.13.3 Austria Corrosion Inhibitors Market Estimates and Forecasts, By End Use (2020-2032) (USD Billion)

10.3.2.14 Rest of Western Europe

10.3.2.14.1 Rest of Western Europe Corrosion Inhibitors Market Estimates and Forecasts, By Product (2020-2032) (USD Billion)

10.3.2.14.2 Rest of Western Europe Corrosion Inhibitors Market Estimates and Forecasts, By Type (2020-2032) (USD Billion)

10.3.2.14.3 Rest of Western Europe Corrosion Inhibitors Market Estimates and Forecasts, By End Use (2020-2032) (USD Billion)

10.4 Asia Pacific

10.4.1 Trends Analysis

  10.4.2 Asia Pacific Corrosion Inhibitors Market Estimates and Forecasts, by Country (2020-2032) (USD Billion)

 10.4.3 Asia Pacific Corrosion Inhibitors Market Estimates and Forecasts, By Product (2020-2032) (USD Billion) 

 10.4.4 Asia Pacific Corrosion Inhibitors Market Estimates and Forecasts, By Type (2020-2032) (USD Billion)

 10.4.5 Asia Pacific Corrosion Inhibitors Market Estimates and Forecasts, By End Use (2020-2032) (USD Billion)

10.4.6 China

10.4.6.1 China Corrosion Inhibitors Market Estimates and Forecasts, By Product (2020-2032) (USD Billion)

10.4.6.2 China Corrosion Inhibitors Market Estimates and Forecasts, By Type (2020-2032) (USD Billion)

10.4.6.3 China Corrosion Inhibitors Market Estimates and Forecasts, By End Use (2020-2032) (USD Billion)

10.4.7 India

10.4.7.1 India Corrosion Inhibitors Market Estimates and Forecasts, By Product (2020-2032) (USD Billion)

10.4.7.2 India Corrosion Inhibitors Market Estimates and Forecasts, By Type (2020-2032) (USD Billion)

10.4.7.3 India Corrosion Inhibitors Market Estimates and Forecasts, By End Use (2020-2032) (USD Billion)

10.4.8 Japan

10.4.8.1 Japan Corrosion Inhibitors Market Estimates and Forecasts, By Product (2020-2032) (USD Billion)

10.4.8.2 Japan Corrosion Inhibitors Market Estimates and Forecasts, By Type (2020-2032) (USD Billion)

10.4.8.3 Japan Corrosion Inhibitors Market Estimates and Forecasts, By End Use (2020-2032) (USD Billion)

10.4.9 South Korea

10.4.9.1 South Korea Corrosion Inhibitors Market Estimates and Forecasts, By Product (2020-2032) (USD Billion)

10.4.9.2 South Korea Corrosion Inhibitors Market Estimates and Forecasts, By Type (2020-2032) (USD Billion)

10.4.9.3 South Korea Corrosion Inhibitors Market Estimates and Forecasts, By End Use (2020-2032) (USD Billion)

10.4.10 Vietnam

10.4.10.1 Vietnam Corrosion Inhibitors Market Estimates and Forecasts, By Product (2020-2032) (USD Billion)

10.4.10.2 Vietnam Corrosion Inhibitors Market Estimates and Forecasts, By Type (2020-2032) (USD Billion)

10.4.10.3 Vietnam Corrosion Inhibitors Market Estimates and Forecasts, By End Use (2020-2032) (USD Billion)

10.4.11 Singapore

10.4.11.1 Singapore Corrosion Inhibitors Market Estimates and Forecasts, By Product (2020-2032) (USD Billion)

10.4.11.2 Singapore Corrosion Inhibitors Market Estimates and Forecasts, By Type (2020-2032) (USD Billion)

10.4.11.3 Singapore Corrosion Inhibitors Market Estimates and Forecasts, By End Use (2020-2032) (USD Billion)

10.4.12 Australia

10.4.12.1 Australia Corrosion Inhibitors Market Estimates and Forecasts, By Product (2020-2032) (USD Billion)

10.4.12.2 Australia Corrosion Inhibitors Market Estimates and Forecasts, By Type (2020-2032) (USD Billion)

10.4.12.3 Australia Corrosion Inhibitors Market Estimates and Forecasts, By End Use (2020-2032) (USD Billion)

10.4.13 Rest of Asia Pacific

10.4.13.1 Rest of Asia Pacific Corrosion Inhibitors Market Estimates and Forecasts, By Product (2020-2032) (USD Billion)

10.4.13.2 Rest of Asia Pacific Corrosion Inhibitors Market Estimates and Forecasts, By Type (2020-2032) (USD Billion)

10.4.13.3 Rest of Asia Pacific Corrosion Inhibitors Market Estimates and Forecasts, By End Use (2020-2032) (USD Billion)

10.5 Middle East and Africa

10.5.1 Middle East

10.5.1.1 Trends Analysis

10.5.1.2 Middle East Corrosion Inhibitors Market Estimates and Forecasts, by Country (2020-2032) (USD Billion)

10.5.1.3 Middle East Corrosion Inhibitors Market Estimates and Forecasts, By Product (2020-2032) (USD Billion) 

10.5.1.4 Middle East Corrosion Inhibitors Market Estimates and Forecasts, By Type (2020-2032) (USD Billion)

10.5.1.5 Middle East Corrosion Inhibitors Market Estimates and Forecasts, By End Use (2020-2032) (USD Billion)

10.5.1.6 UAE

10.5.1.6.1 UAE Corrosion Inhibitors Market Estimates and Forecasts, By Product (2020-2032) (USD Billion)

10.5.1.6.2 UAE Corrosion Inhibitors Market Estimates and Forecasts, By Type (2020-2032) (USD Billion)

10.5.1.6.3 UAE Corrosion Inhibitors Market Estimates and Forecasts, By End Use (2020-2032) (USD Billion)

10.5.1.7 Egypt

10.5.1.7.1 Egypt Corrosion Inhibitors Market Estimates and Forecasts, By Product (2020-2032) (USD Billion)

10.5.1.7.2 Egypt Corrosion Inhibitors Market Estimates and Forecasts, By Type (2020-2032) (USD Billion)

10.5.1.7.3 Egypt Corrosion Inhibitors Market Estimates and Forecasts, By End Use (2020-2032) (USD Billion)

10.5.1.8 Saudi Arabia

10.5.1.8.1 Saudi Arabia Corrosion Inhibitors Market Estimates and Forecasts, By Product (2020-2032) (USD Billion)

10.5.1.8.2 Saudi Arabia Corrosion Inhibitors Market Estimates and Forecasts, By Type (2020-2032) (USD Billion)

10.5.1.8.3 Saudi Arabia Corrosion Inhibitors Market Estimates and Forecasts, By End Use (2020-2032) (USD Billion)

10.5.1.9 Qatar

10.5.1.9.1 Qatar Corrosion Inhibitors Market Estimates and Forecasts, By Product (2020-2032) (USD Billion)

10.5.1.9.2 Qatar Corrosion Inhibitors Market Estimates and Forecasts, By Type (2020-2032) (USD Billion)

10.5.1.9.3 Qatar Corrosion Inhibitors Market Estimates and Forecasts, By End Use (2020-2032) (USD Billion)

10.5.1.10 Rest of Middle East

10.5.1.10.1 Rest of Middle East Corrosion Inhibitors Market Estimates and Forecasts, By Product (2020-2032) (USD Billion)

10.5.1.10.2 Rest of Middle East Corrosion Inhibitors Market Estimates and Forecasts, By Type (2020-2032) (USD Billion)

10.5.1.10.3 Rest of Middle East Corrosion Inhibitors Market Estimates and Forecasts, By End Use (2020-2032) (USD Billion)

10.5.2 Africa

10.5.2.1 Trends Analysis

10.5.2.2 Africa Corrosion Inhibitors Market Estimates and Forecasts, by Country (2020-2032) (USD Billion)

10.5.2.3 Africa Corrosion Inhibitors Market Estimates and Forecasts, By Product (2020-2032) (USD Billion) 

10.5.2.4 Africa Corrosion Inhibitors Market Estimates and Forecasts, By Type (2020-2032) (USD Billion)

10.5.2.5 Africa Corrosion Inhibitors Market Estimates and Forecasts, By End Use (2020-2032) (USD Billion)

10.5.2.6 South Africa

10.5.2.6.1 South Africa Corrosion Inhibitors Market Estimates and Forecasts, By Product (2020-2032) (USD Billion)

10.5.2.6.2 South Africa Corrosion Inhibitors Market Estimates and Forecasts By Type (2020-2032) (USD Billion)

10.5.2.6.3 South Africa Corrosion Inhibitors Market Estimates and Forecasts, By End Use (2020-2032) (USD Billion)

10.5.2.7 Nigeria

10.5.2.7.1 Nigeria Corrosion Inhibitors Market Estimates and Forecasts, By Product (2020-2032) (USD Billion)

10.5.2.7.2 Nigeria Corrosion Inhibitors Market Estimates and Forecasts, By Type (2020-2032) (USD Billion)

10.5.2.7.3 Nigeria Corrosion Inhibitors Market Estimates and Forecasts, By End Use (2020-2032) (USD Billion)

10.5.2.8 Rest of Africa

10.5.2.8.1 Rest of Africa Corrosion Inhibitors Market Estimates and Forecasts, By Product (2020-2032) (USD Billion)

10.5.2.8.2 Rest of Africa Corrosion Inhibitors Market Estimates and Forecasts, By Type (2020-2032) (USD Billion)

10.5.2.8.3 Rest of Africa Corrosion Inhibitors Market Estimates and Forecasts, By End Use (2020-2032) (USD Billion)

10.6 Latin America

10.6.1 Trends Analysis

10.6.2 Latin America Corrosion Inhibitors Market Estimates and Forecasts, by Country (2020-2032) (USD Billion)

10.6.3 Latin America Corrosion Inhibitors Market Estimates and Forecasts, By Product (2020-2032) (USD Billion) 

10.6.4 Latin America Corrosion Inhibitors Market Estimates and Forecasts, By Type (2020-2032) (USD Billion)

10.6.5 Latin America Corrosion Inhibitors Market Estimates and Forecasts, By End Use (2020-2032) (USD Billion)

10.6.6 Brazil

10.6.6.1 Brazil Corrosion Inhibitors Market Estimates and Forecasts, By Product (2020-2032) (USD Billion)

10.6.6.2 Brazil Corrosion Inhibitors Market Estimates and Forecasts, By Type (2020-2032) (USD Billion)

10.6.6.3 Brazil Corrosion Inhibitors Market Estimates and Forecasts, By End Use (2020-2032) (USD Billion)

10.6.7 Argentina

10.6.7.1 Argentina Corrosion Inhibitors Market Estimates and Forecasts, By Product (2020-2032) (USD Billion)

10.6.7.2 Argentina Corrosion Inhibitors Market Estimates and Forecasts, By Type (2020-2032) (USD Billion)

10.6.7.3 Argentina Corrosion Inhibitors Market Estimates and Forecasts, By End Use (2020-2032) (USD Billion)

10.6.8 Colombia

10.6.8.1 Colombia Corrosion Inhibitors Market Estimates and Forecasts, By Product (2020-2032) (USD Billion)

10.6.8.2 Colombia Corrosion Inhibitors Market Estimates and Forecasts, By Type (2020-2032) (USD Billion)

10.6.8.3 Colombia Corrosion Inhibitors Market Estimates and Forecasts, By End Use (2020-2032) (USD Billion)

10.6.9 Rest of Latin America

10.6.9.1 Rest of Latin America Corrosion Inhibitors Market Estimates and Forecasts, By Product (2020-2032) (USD Billion)

10.6.9.2 Rest of Latin America Corrosion Inhibitors Market Estimates and Forecasts, By Type (2020-2032) (USD Billion)

10.6.9.3 Rest of Latin America Corrosion Inhibitors Market Estimates and Forecasts, By End Use (2020-2032) (USD Billion)

11. Company Profiles

11.1 BASF SE

11.1.1 Company Overview

11.1.2 Financial

11.1.3 Product/ Services Offered

11.1.4 SWOT Analysis

11.2 Cortec Corporation

     11.2.1 Company Overview

11.2.2 Financial

11.2.3 Product/ Services Offered

11.2.4 SWOT Analysis

11.3 Ecolab Inc.

11.3.1 Company Overview

11.3.2 Financial

11.3.3 Product/ Services Offered

11.3.4 SWOT Analysis

11.4 Henkel AG & Co. KGaA

     11.4.1 Company Overview

11.4.2 Financial

11.4.3 Product/ Services Offered

11.4.4 SWOT Analysis

11.5 Ashland Global

     11.5.1 Company Overview

11.5.2 Financial

11.5.3 Product/ Services Offered

11.5.4 SWOT Analysis

11.6 The Lubrizol Corporation

11.6.1 Company Overview

11.6.2 Financial

11.6.3 Product/ Services Offered

11.6.4 SWOT Analysis

11.7 Dow Inc.

11.7.1 Company Overview

11.7.2 Financial

11.7.3 Product/ Services Offered

11.7.4 SWOT Analysis

11.8 Solvay

     11.8.1 Company Overview

11.8.2 Financial

11.8.3 Product/ Services Offered

11.8.4 SWOT Analysis

11.9 Solenis

     11.9.1 Company Overview

11.9.2 Financial

11.9.3 Product/ Services Offered

11.9.4 SWOT Analysis

11.10 Daubert Chemical Company

11.10.1 Company Overview

11.10.2 Financial

11.10.3 Product/ Services Offered

11.10.4 SWOT Analysis

12. Use Cases and Best Practices

13. Conclusion

An accurate research report requires proper strategizing as well as implementation. There are multiple factors involved in the completion of good and accurate research report and selecting the best methodology to compete the research is the toughest part. Since the research reports we provide play a crucial role in any company’s decision-making process, therefore we at SNS Insider always believe that we should choose the best method which gives us results closer to reality. This allows us to reach at a stage wherein we can provide our clients best and accurate investment to output ratio.

Each report that we prepare takes a timeframe of 350-400 business hours for production. Starting from the selection of titles through a couple of in-depth brain storming session to the final QC process before uploading our titles on our website we dedicate around 350 working hours. The titles are selected based on their current market cap and the foreseen CAGR and growth.


The 5 steps process:

Step 1: Secondary Research:

Secondary Research or Desk Research is as the name suggests is a research process wherein, we collect data through the readily available information. In this process we use various paid and unpaid databases which our team has access to and gather data through the same. This includes examining of listed companies’ annual reports, Journals, SEC filling etc. Apart from this our team has access to various associations across the globe across different industries. Lastly, we have exchange relationships with various university as well as individual libraries.

Secondary Research

Step 2: Primary Research

When we talk about primary research, it is a type of study in which the researchers collect relevant data samples directly, rather than relying on previously collected data.  This type of research is focused on gaining content specific facts that can be sued to solve specific problems. Since the collected data is fresh and first hand therefore it makes the study more accurate and genuine.

We at SNS Insider have divided Primary Research into 2 parts.

Part 1 wherein we interview the KOLs of major players as well as the upcoming ones across various geographic regions. This allows us to have their view over the market scenario and acts as an important tool to come closer to the accurate market numbers. As many as 45 paid and unpaid primary interviews are taken from both the demand and supply side of the industry to make sure we land at an accurate judgement and analysis of the market.

This step involves the triangulation of data wherein our team analyses the interview transcripts, online survey responses and observation of on filed participants. The below mentioned chart should give a better understanding of the part 1 of the primary interview.

Primary Research

Part 2: In this part of primary research the data collected via secondary research and the part 1 of the primary research is validated with the interviews from individual consultants and subject matter experts.

Consultants are those set of people who have at least 12 years of experience and expertise within the industry whereas Subject Matter Experts are those with at least 15 years of experience behind their back within the same space. The data with the help of two main processes i.e., FGDs (Focused Group Discussions) and IDs (Individual Discussions). This gives us a 3rd party nonbiased primary view of the market scenario making it a more dependable one while collation of the data pointers.

Step 3: Data Bank Validation

Once all the information is collected via primary and secondary sources, we run that information for data validation. At our intelligence centre our research heads track a lot of information related to the market which includes the quarterly reports, the daily stock prices, and other relevant information. Our data bank server gets updated every fortnight and that is how the information which we collected using our primary and secondary information is revalidated in real time.

Data Bank Validation

Step 4: QA/QC Process

After all the data collection and validation our team does a final level of quality check and quality assurance to get rid of any unwanted or undesired mistakes. This might include but not limited to getting rid of the any typos, duplication of numbers or missing of any important information. The people involved in this process include technical content writers, research heads and graphics people. Once this process is completed the title gets uploader on our platform for our clients to read it.

Step 5: Final QC/QA Process:

This is the last process and comes when the client has ordered the study. In this process a final QA/QC is done before the study is emailed to the client. Since we believe in giving our clients a good experience of our research studies, therefore, to make sure that we do not lack at our end in any way humanly possible we do a final round of quality check and then dispatch the study to the client.

Key Segments:

By Product

  • Organic

  • Inorganic

By Type

  • Water Based

  • Oil Based

By End Use

  • Oil and Gas

  • Power Generation

  • Metal Processing

  • Water Treatment

  • Chemical Processing

  • Paper and Pulp

  • Other

Request for Segment Customization as per your Business Requirement: Segment Customization Request

Regional Coverage:

North America

  • US

  • Canada

  • Mexico

Europe

  • Eastern Europe

    • Poland

    • Romania

    • Hungary

    • Turkey

    • Rest of Eastern Europe

  • Western Europe

    • Germany

    • France

    • UK

    • Italy

    • Spain

    • Netherlands

    • Switzerland

    • Austria

    • Rest of Western Europe

Asia Pacific

  • China

  • India

  • Japan

  • South Korea

  • Vietnam

  • Singapore

  • Australia

  • Rest of Asia Pacific

Middle East & Africa

  • Middle East

    • UAE

    • Egypt

    • Saudi Arabia

    • Qatar

    • Rest of Middle East

  • Africa

    • Nigeria

    • South Africa

    • Rest of Africa

  • Latin America

  • Brazil

  • Argentina

  • Colombia

  • Rest of Latin America


Request for Country Level Research Report: Country Level Customization Request

Available Customization

With the given market data, SNS Insider offers customization as per the company’s specific needs. The following customization options are available for the report:

  • Detailed Volume Analysis

  • Criss-Cross segment analysis (e.g. Product X Application)

  • Competitive Product Benchmarking

  • Geographic Analysis

  • Additional countries in any of the regions

  • Customized Data Representation

  • Detailed analysis and profiling of additional market players


  •            5000 (33% Discount)


  •            8950 (40% Discount)


  •            3050 (23% Discount)

Start a Conversation

Hi! Click one of our member below to chat on Phone